1548
T1ρ Dispersion in White Matter Correlates with Quantitative Metrics of Cognitive Impairment1Vanderbilt University Institute of Imaging Science, NASHVILLE, TN, United States, 2Department of Radiology and Radiological Sciences, Vanderbilt University Medical Center, NASHVILLE, TN, United States, 3Department of Neurology, Vanderbilt University Medical Center, NASHVILLE, TN, United States, 4Department of Biomedical Engineering, Vanderbilt University, Nashville, TN, United States
Synopsis
R1ρ dispersion at weak locking fields (R1ρDiff) has the potential to reveal information on microvascular geometry and density. Our results show ΔR1ρ of white matter extracted from R1ρDiff dispersion is significantly greater in subjects with lower RBANS and MoCA scores. R2 or R1p values measured at a single locking field amplitude have no significant correlation with cognitive impairment scores. This work supports the hypothesis that microvascular impairment in white matter may be one of the causal factors in the progression of cognitive impairment in older adults.
INTRODUCTION:
Alzheimer ‘s disease (AD) is the most frequent form of dementia in elderly adults and has a total estimated worldwide cost that rises to $2 trillion by 2030.1 Much previous neuroimaging research in AD has focused on the roles of amyloid and tau proteins using PET, but there have also been several MRI studies that have implicated microvascular changes as an early indicator of damage related to later dementia.2,3 Recently it has been shown that the variation of R1ρ-weighted imaging (R1ρ = 1/T1ρ) measured at high field (≥ 3T) using weak locking fields (FSL, 0-300Hz) provides a unique way to characterize the geometry and structure of microvasculature.4,5 Previous studies that used T1ρ imaging at a single locking field claimed improved detection of abnormalities such as neurofibrillary entanglements.6,7 Here we provide preliminary evidence that the variation of T1ρ measurements with weak FSLs from the brains of healthy and mildly cognitively impaired (MCI) adults differ and change with the progression of cognitive impairment.MATERIALS & METHODS:
R1ρ dispersion at low FSL: Previous studies indicate that R1ρ dispersion of tissues over weak locking fields may be due to diffusion in intrinsic gradients (R1ρDiff) induced by inhomogeneities such as microvasculature.4,5 R1ρDiff has the potential to reveal information on microvascular geometry and density, such as the sizes and spacings of vessels. Both theoretical and empirical results show that the contribution of diffusion should be negligible at locking frequencies beyond approximately 300Hz. Here we choose two different FSLs to quantify R1ρDiff [= ΔR1ρ= R1ρ{0Hz} - R1ρ{300Hz}].In vivo measurement: After providing informed consent, 14 adults aged 67±13.4 years underwent a comprehensive battery of tests of cognitive abilities and an MRI scan. Cognitively impaired subjects were recruited from patients referred to our department of neurology as showing signs of early onset cognitive impairment. Cognitively normal subjects were recruited from family members of cognitively impaired patients and from community advertising. Exclusion criteria aside from the standard contraindications to MRI were a history of other psychiatric and neurological diseases or major head injury.
Examination of the cognitive impairment and MRI acquisition: Behavioral tests to evaluate the cognitive abilities of each subject included a Clinical Dementia Rating, the Montreal Cognitive Assessment (MoCA), and the Repeatable Battery for the Assessment of Neuropsychological Status (RBANS). 3DT1ρ-weighted images of brain were obtained at 3T (Ingenia MRI scanner, Philips Healthcare) using a T1ρ spin-lock preparation (90×-τ/2y-180y-τ/2−y-90×) turbo spin-echo pulse sequence. Two FSL were used and R1ρ values were estimated by fitting data obtained with three different locking times; 2, 20, and 48 ms (see Fig.1). 3D T2-weighted FLAIR, T1-weighted MPRAGE, and Susceptibility-weighted images were also collected to evaluate the brain condition of the subjects.
RESULTS & DISCUSSION:
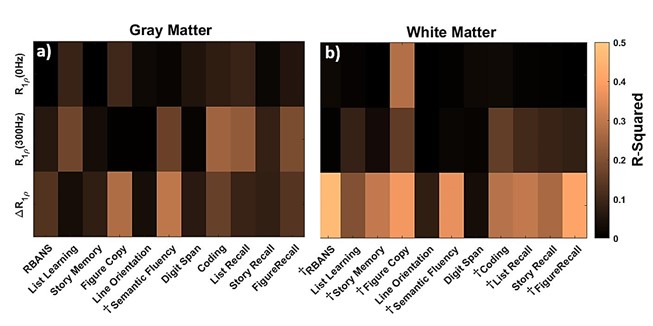
Fig.1 shows calculated R1ρ and ΔR1ρ maps of a healthy brain compared to an MCI subject. Fig.2a demonstrates that ΔR1ρ (= R1ρ{0Hz} - R1ρ{300Hz}) of white matter is significantly greater in subjects with lower RBANS scores, which indicate a higher level of cognitive impairment (p-value = 0.007). To examine whether this association is explained by age, we added age to the regression analysis as an independent variable. After accounting for age, the regression coefficient of RBANS did not change, and the association between ΔR1ρ and age did not show a significant correlation (p-value = 0.71). The correlation between ΔR1ρ and MoCA score supports Fig.2a. No significant correlations were found for R1ρ measured at FSL= 0 and 300Hz (see Fig.2c-f). Our results did not show a significant difference in R1ρ between healthy and MCI subjects, which is in contrast with the previous finding by Haris et al.6,7 This discrepancy could be due to the different locking field frequency used for R1ρ measurements. The association of MRI biomarkers and RBANS index scores was assessed using linear regression analyses. R-Squared values extracted from each regression are shown in Fig.3.CONCLUSION:
The results indicate that ΔR1ρ has a stronger correlation with RBANS index scores than measurements of R1ρ at a single FSL. This study suggests ΔR1ρ measured over low locking fields changes with the progression of cognitive impairment. We interpret ΔR1ρ as indicating changes in microvascular density and geometry. These results need to be verified in a larger sample size to establish whether ΔR1ρ is a biomarker of WM disorder which may lead to cognitive impairment in older adults.Acknowledgements
The
authors are grateful to Dr. Saikat Sengupta for his assistance
with the image-based B0 shimming method. We
also gratefully acknowledge financial support provided by NIH grants
R01EB024525 and R01EB024525 Supplement awarded to Dr. John C. Gore.
References
1. Patterson, C., World Alzheimer Report 2018, The state of the art of dementia research: New frontiers. 2018.
2. Nielsen RB, Parbo P, Ismail R, et al. Impaired perfusion and capillary dysfunction in prodromal Alzheimer’s disease. Alzheimers Dement, 2020;12(1):e12032.
3. Meyer E, Ulmann-Schuler A, Staufenbiel M, Krucker T. Altered morphology and 3D architecture of brain vasculature in a mouse model for Alzheimer's disease. PNAS, 2007;105(9):3587.
4. Spear JT, Zu Z, Gore JC. Dispersion of relaxation rates in the rotating frame under the action of spin-locking pulses and diffusion in inhomogeneous magnetic fields. Magn Reson Med. May 2014;71(5):1906-1911.
5. Adelnia F, Zu Z, Spear JT, et al. Tissue characterization using R1rho dispersion imaging at low locking fields. J Magn Reson Imaging. May 2021; 84:1-11.
6. Haris M, Yadav SK, Rizwan R, et al, T1rho MRI and CSF biomarkers in diagnosis of Alzheimer's disease. NeuroImage: Clinical. 2015;7:598-604
7. Haris M, Singh A, Cai K, et al, T1rho (T1ρ) MR imaging in Alzheimer's disease and Parkinson's disease with and without dementia. J Neurol. Oct 2011;258(3):380-385.
Figures