1547
Resting-state Functional connectivity to differentiate Mild Cognitive Impairment, Alzheimer's disease, and Normal subjects1Department of Medical physics and Biomedical Engineering, Tehran university of medical sciences, TEHRAN, Iran (Islamic Republic of), 2Department of Psychiatry, Tehran university of medical sciences, TEHRAN, Iran (Islamic Republic of), 3Iran University of Medical Sciences, TEHRAN, Iran (Islamic Republic of), 4Quantitative MR Imaging and Spectroscopy Group, Research Center for Molecular and Cellular Imaging, Tehran University of Medical Sciences, TEHRAN, Iran (Islamic Republic of), 5Tehran university of medical sciences, TEHRAN, Iran (Islamic Republic of), 6Quantitative MR Imaging and Spectroscopy Group, Research Center for Molecular and Cellular Imaging, Tehran University of Medical Sciences, Tehran, Iran (Islamic Republic of)
Synopsis
Millions of people around the world suffer from Alzheimer's disease (AD), the most common neurodegenerative disease. Due to the progressive cognitive decline of the disease, early diagnosis can play an important role in the treatment and prevention of disease progression. Because functional and physiological changes occur before structural changes, functional imaging-based biomarkers such as Functional connectivity (FC) can show these changes well.
INTRODUCTION:
Alzheimer's disease (AD) is an age-related, irreversible disease (1), typically begins with episodic memory impairment (2) and gradually has a destructive effect on regions that are responsible for thinking, learning, and behavior in the brain (1). AD is the most common form of dementia that is associated with dysfunction of brain networks and can be understood as disconnection syndrome (3). The etiology is still not understood but experimental and neuroimaging evidence shows that AD may be associated with neuronal loss and brain system dysfunction due to the accumulation of neuropathological markers (4). It is important to diagnose in the early stages when known as mild cognitive impairment (MCI) (5). MCI can be considered as a stage between normal aging and dementia (6) and associated with a deficiency in cognitive function without significant affection on daily activities (7). The fMRI technique (rs-fMRI) has been widely used in the diagnosis of AD due to its safety, high spatial resolution, and reproducibility, this method can detect connectivity-based brain dysfunction (8, 9). There are two large network systems in the brain: resting networks, which is a set of regions in the brain that show more activity at rest, and the other is task-based networks (10, 11). We want to describe the connectivity between resting-state networks based on Functional connectivity, which is defined as the synchronization of neural and functional activity (9) or statistical correlation between two or more anatomically distinct regions (12).METHODS:
Subjects: 3 groups, including 14 normal, 16 MCI, and 14 AD subjects participated in this study, these subjects were examined and selected by Yaadmaan Institute for Brain, Cognition & Memory Studies (Tehran, Iran) through neuropsychological assessments. (Table. 1).Table. 1 Clinical and demographic data
| AD | MCI | Normal | |
| 14 | 16 | 14 | Number of subject |
| 5-9 | 6-10 | 6-8 | Sex (male-female) |
| 77.8 | 72.4 | 71.5 | Mean age |
| 18.1 | 25 | 28.66 | Mean MMSE score |
MRI protocol: 3D-T1-MPRAGE and rs-fMRI protocol were performed on participants using a 3.0 T Prisma MRI scanner (Siemens Healthcare, Germany) at the National Brain Mapping Laboratory (Tehran, Iran). The rs-fMRI images were acquired using an Echo-Planar Imaging sequence: TR: 3000 ms, TE: 30 ms, flip angle: 90 degrees, voxel size: 2.8×2.8×3 mm, slice thickness: 3 mm, FOV read: 220 mm.
Image processing: preprocessing included Removal of non-brain tissue, Intensity and spatial MNI normalization, tissue segmentation for 3D-T1-MPRAGE data and Realignment, Slice timing correction, Outlier detection, Segmentation, MNI normalization, and Functional smoothing for rs-fMRI data was performed using CONN's default preprocessing pipeline (12). We performed ROI-to-ROI connectivity that measure the level of FC between a pair of ROI BOLD time series on 32 ROI from 8 resting-state networks: Default Mode Network (DMN), Sensorimotor Network, Visual Network, Salience Network, Dorsal attention Network (DAN), Frontoparietal Network (FPN), Language Network and Cerebellar Network, using Fisher-transformed bivariate correlation coefficient (13).
We performed parametric multivariate statistical analysis with an FDR-corrected p<0.05 cluster-level threshold and post-hoc uncorrected p<0.05 height (connection-level) threshold.
RESULTS:
In group AD versus MCI, AD subjects showed a decrease in FC at 6 ROI-ROI connection and in comparison between AD and normal group, AD subjects showed a decrease in FC at 20 ROI-ROI connection (Fig. 1, 2).We also found a decrease in FC in DMN, Salience, DAN, FPN, Language, Visual and Cerebellar networks in AD compared to the normal and MCI group. Several altered correlations can also distinguish between MCI and normal: increase in FC in MPFC-LPL connection in DMN, RPFCL - AInsula L connection in Salience network, IPSR - IPSL and FEFL - IPSR connection in the DAN, PPC R - PPCL, LPFCR- PPCR, and PPCL - LPFCL connection in FPN and increase the overall connection strength in Language and Visual network (Fig. 3- 5).
DISCUSSION:
The DMN has been reported as the most vulnerable brain network in AD and decreased FC in the DMN may be one of the causes of cognitive impairment. (14, 15). FPN that involved in attention and working memory function showed a decrease in FC in AD subjects (14, 16). Cognitive and motor dysfunctions in AD patients may have been associated with grey matter loss in posterior hemispheric cerebellar regions (17, 18). A decrease in FC of the cerebellar network is probably due to cerebral atrophy. We saw a decrease in FC in DAN in AD subjects. Significant impairments in functional and structures of DAN were reported so that AD subjects have a problem in unexpected locations and they are poor in orientation and executive tasks (19). In the visual and language networks, the strongest FC was seen in the MCI group compared to the other two groups, this increase in connection strength shows the possible efforts of the Visual and language network to prevent segregation. Salience network dysfunctions will disrupt the performance of other networks because play a key role in regulating dynamic changes in other networks (20). Our result showed a decrease in FC of salience network in AD patients.CONLUSION:
We found that the functional architecture of normal, MCI, and AD brain subjects are different at rest. Our study demonstrates the usefulness of resting-state FC as a biomarker of AD. Also, this biomarker can be used to differentiate MCI from the normal group.Acknowledgements
This research has been supported by Tehran University of Medical Sciences & health Services grant 99-3-101-45445.
References
1. Hojjati SH, Ebrahimzadeh A, Khazaee A, Babajani-Feremi A, Initiative AsDN. Predicting conversion from MCI to AD by integrating rs-fMRI and structural MRI. Computers in biology and medicine. 2018;102:30-9.
2. Kivistö J, Soininen H, Pihlajamaki M. Functional mri in alzheimer’s disease. Advanced brain neuroimaging topics in health and disease-methods and applications: IntechOpen; 2014.
3. Yu E, Liao Z, Tan Y, Qiu Y, Zhu J, Han Z, et al. High-sensitivity neuroimaging biomarkers for the identification of amnestic mild cognitive impairment based on resting-state fMRI and a triple network model. Brain imaging and behavior. 2019;13(1):1-14.
4. Costumero V, Uquillas FdO, Diez I, Andorrà M, Basaia S, Bueichekú E, et al. Distance disintegration delineates the brain connectivity failure of Alzheimer's disease. Neurobiology of aging. 2020;88:51-60.
5. Ma X, Zhuo Z, Wei L, Ma Z, Li Z, Li H, et al. Altered temporal organization of brief spontaneous brain activities in patients with Alzheimer’s disease. Neuroscience. 2020;425:1-11.
6. Bonifacio G, Zamboni G. Brain imaging in dementia. Postgraduate medical journal. 2016;92(1088):333-40.
7. Li H, Gao S, Jia X, Jiang T, Li K. Distinctive Alterations of Functional Connectivity Strength between Vascular and Amnestic Mild Cognitive Impairment. Neural plasticity. 2021;2021.
8. Gao Z, Feng Y, Ma C, Ma K, Cai Q, Initiative AsDN. Disrupted Time-Dependent and Functional Connectivity Brain Network in Alzheimer's Disease: A Resting-State fMRI Study Based on Visibility Graph. Current Alzheimer Research. 2020;17(1):69-79.
9. Zhao J, Du Y-H, Ding X-T, Wang X-H, Men G-Z. Alteration of functional connectivity in patients with Alzheimer’s disease revealed by resting-state functional magnetic resonance imaging. Neural regeneration research. 2020;15(2):285.
10. Rajamanickam K. A mini review on different methods of functional-MRI data analysis. Archives of Internal Medicine Research. 2020;3(1):44-60.
11. Rosazza C, Minati L. Resting-state brain networks: literature review and clinical applications. Neurological sciences. 2011;32(5):773-85.
12. Whitfield-Gabrieli S, Nieto-Castanon A. Conn: a functional connectivity toolbox for correlated and anticorrelated brain networks. Brain connectivity. 2012;2(3):125-41.
13. Nieto-Castanon A. Handbook of functional connectivity Magnetic Resonance Imaging methods in CONN2020.
14. Tang F, Zhu D, Ma W, Yao Q, Li Q, Shi J. Differences Changes in Cerebellar Functional Connectivity Between Mild Cognitive Impairment and Alzheimer's Disease: A Seed-Based Approach. Frontiers in Neurology. 2021;12:987.
15. Dillen KN, Jacobs HI, Kukolja J, Richter N, von Reutern B, Onur ÖA, et al. Functional disintegration of the default mode network in prodromal Alzheimer’s disease. Journal of Alzheimer's disease. 2017;59(1):169-87.
16. Zhao Q, Sang X, Metmer H, Lu J, Initiative AsDN. Functional segregation of executive control network and frontoparietal network in Alzheimer's disease. Cortex. 2019;120:36-48.
17. Olivito G, Serra L, Marra C, Di Domenico C, Caltagirone C, Toniolo S, et al. Cerebellar dentate nucleus functional connectivity with cerebral cortex in Alzheimer's disease and memory: a seed-based approach. Neurobiology of aging. 2020;89:32-40.
18. Toniolo S, Serra L, Olivito G, Marra C, Bozzali M, Cercignani M. Patterns of cerebellar gray matter atrophy across Alzheimer’s disease progression. Frontiers in cellular neuroscience. 2018;12:430.
19. Zhang Z, Zheng H, Liang K, Wang H, Kong S, Hu J, et al. Functional degeneration in dorsal and ventral attention systems in amnestic mild cognitive impairment and Alzheimer’s disease: an fMRI study. Neuroscience letters. 2015;585:160-5.
20. Smitha K, Akhil Raja K, Arun K, Rajesh P, Thomas B, Kapilamoorthy T, et al. Resting state fMRI: A review on methods in resting state connectivity analysis and resting state networks. The neuroradiology journal. 2017;30(4):305-17.
Figures
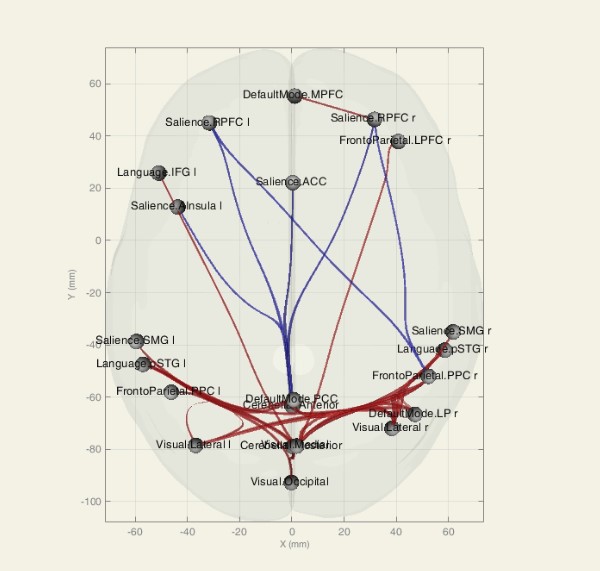
Figure 1. Functional connectivity (ROI-ROI) between resting-state networks, group AD versus MCI, 3D glass display. Blue connections show a strongest negative correlation
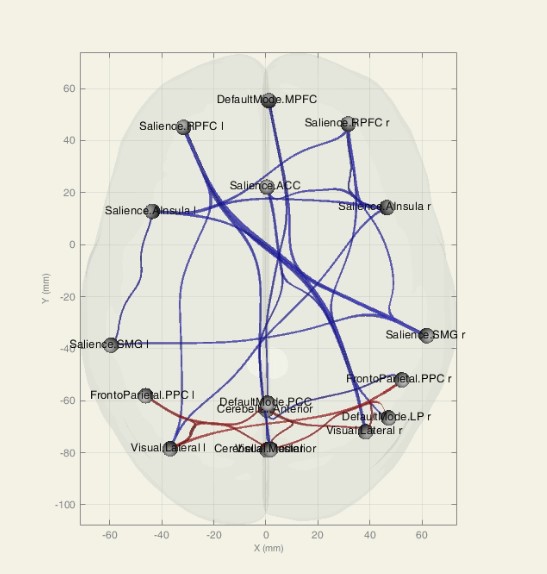
Figure 2. Functional connectivity (ROI-ROI) between resting-state networks, group AD versus normal, 3D glass display. Blue connections show a strongest negative correlation
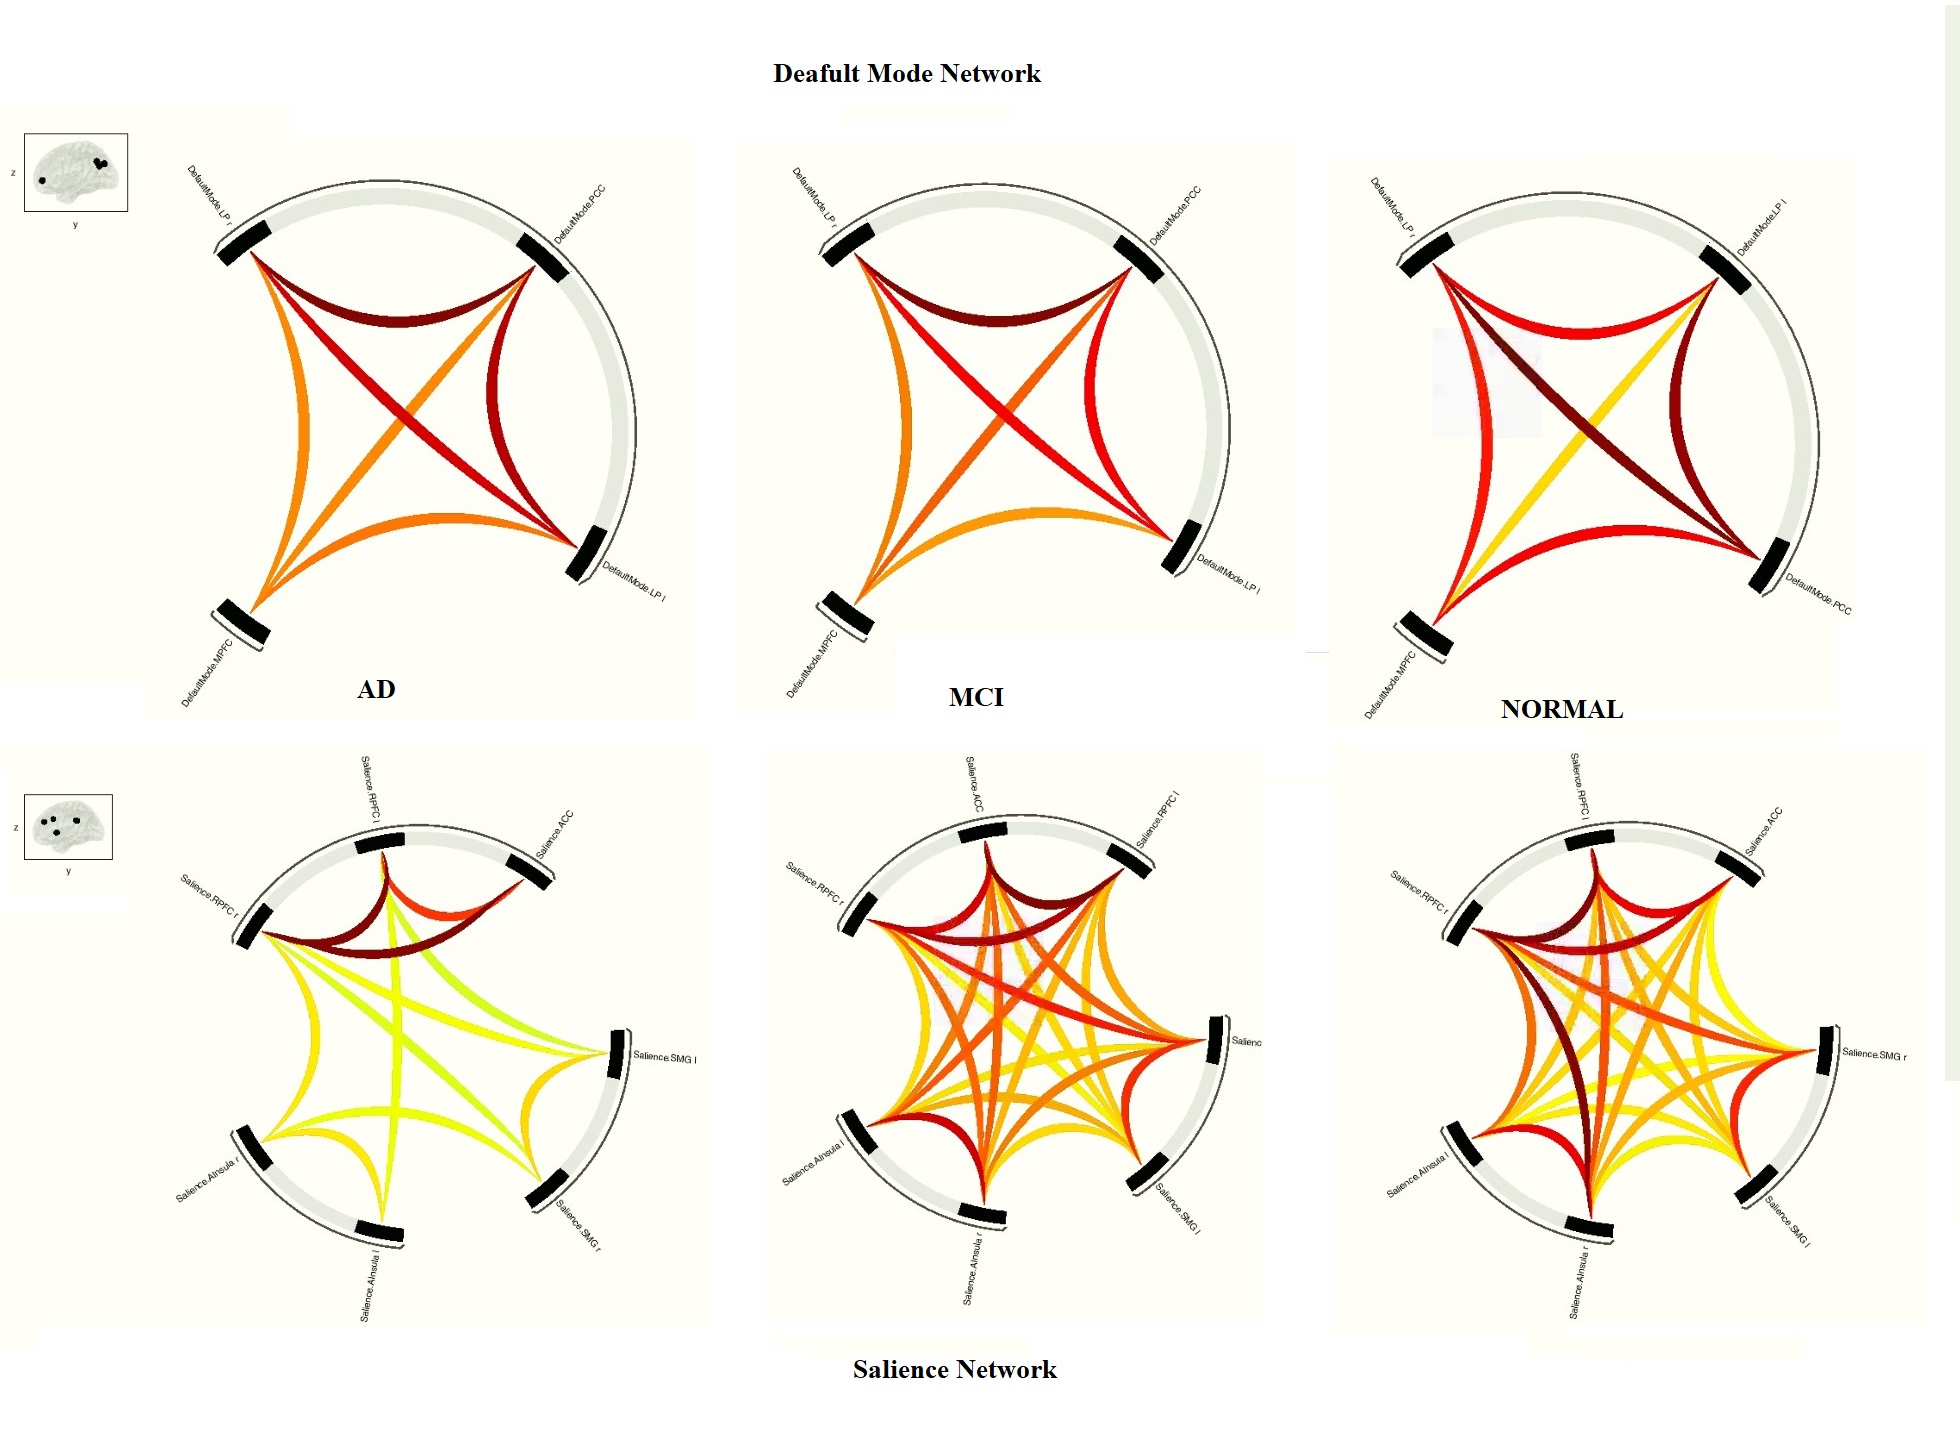
Figure 3. Within network comparison in AD, MCI, and normal subjects in the Salience and Default Mode Networks
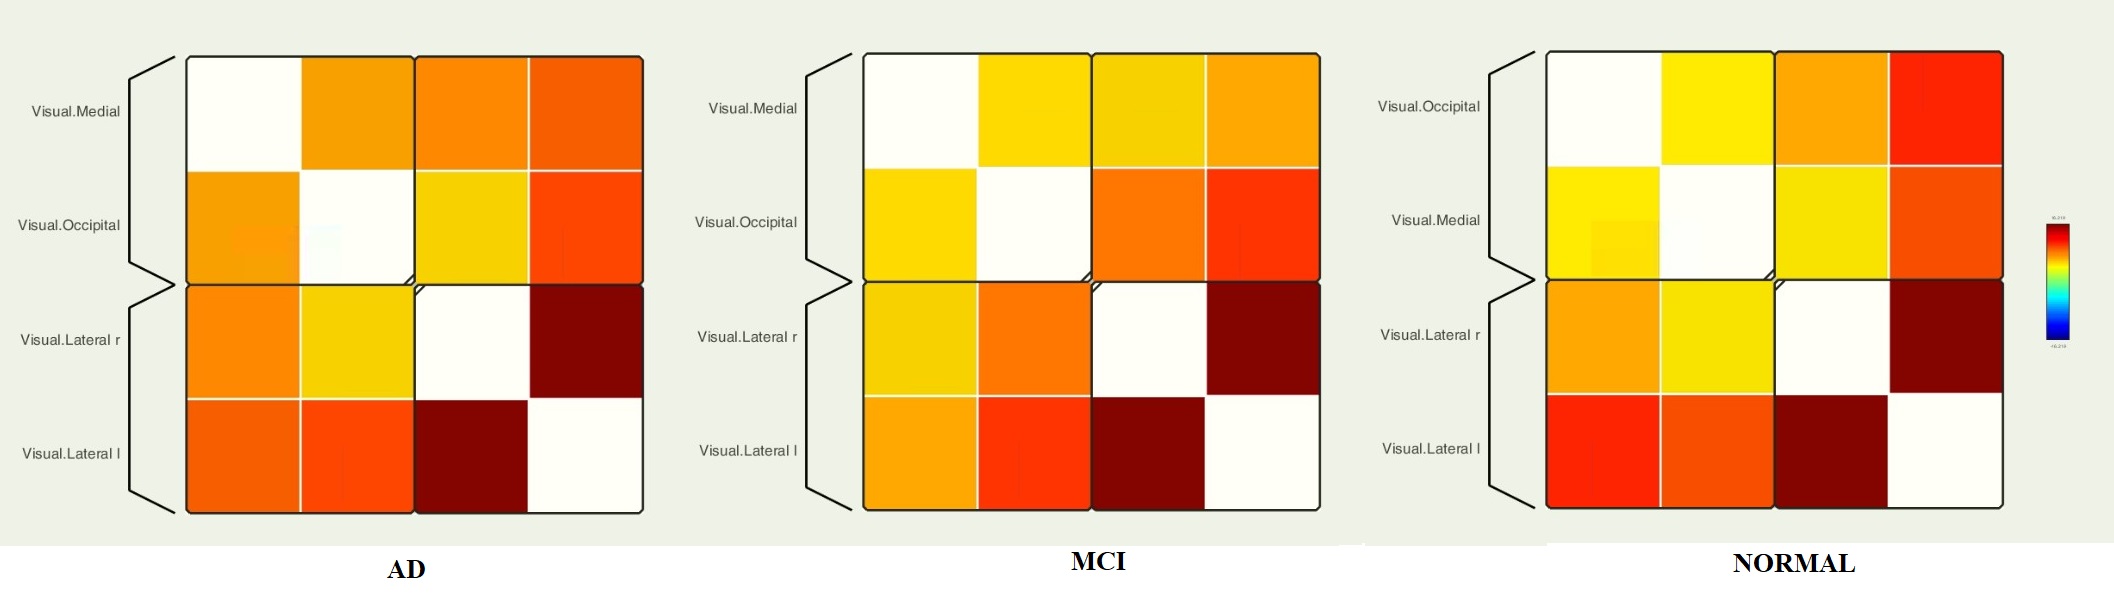
Figure 4. Within network comparison in AD, MCI, and normal subjects in the Visual Networks
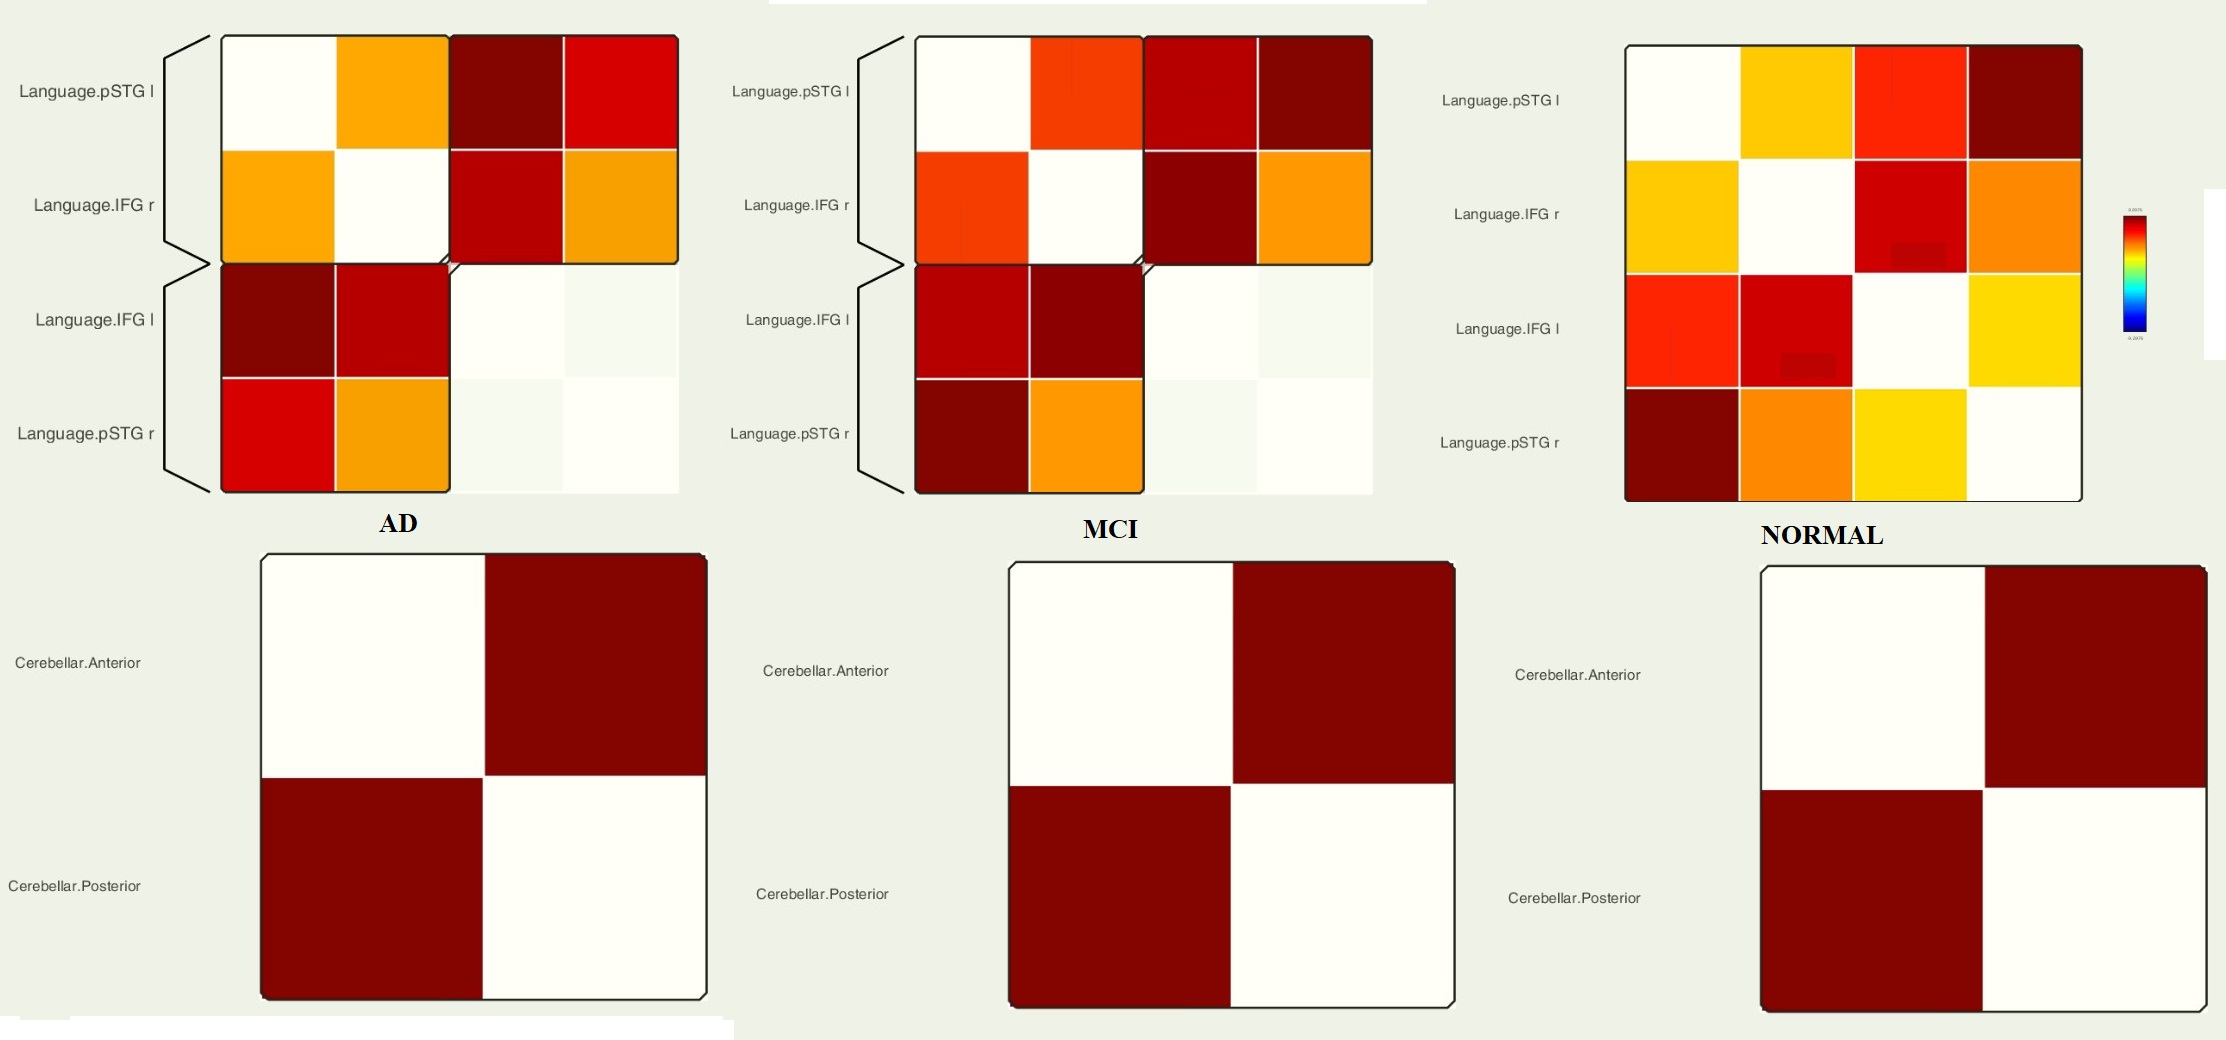
Figure 5. Within network comparison in AD, MCI, and normal subjects in the Language and Cerebellar Networks