1543
Noise Considerations for a Microsolenoid at 15.2T Designed for MR Microscopy1Vanderbilt University Institute of Imaging Science, Vanderbilt University, Nashville, TN, United States, 2Department of Physics and Astronomy, Vanderbilt University, Nashville, TN, United States, 3Department of Radiology and Radiological Sciences, Vanderbilt University Medical Center, Nashville, TN, United States, 4Department of Biomedical Engineering, Vanderbilt University, Nashville, TN, United States, 5Department of Radiology and Radiological Science, Vanderbilt University Medical Center, Nashville, TN, United States
Synopsis
Magnetic Resonance Microscopy aims to produce micron scale resolution images in reasonable times, but SNR decreases as voxel sizes shrink. RF coils must be optimized and their performance depends on coil resistance and sample size. We compared the relative performance of a commercially available cryogenically cooled surface coil of 24 mm in diameter to a smaller, 1.5 mm diameter, room temperature microcoil at 15.2T. A silver microsolenoid had threefold SNR increase but with decreased FOV and susceptibility artifacts. An optimized microcoil should be able to produce images with 10 µm isotropic resolution within 10 hours with an SNR of 10.
Introduction
Magnetic Resonance Microscopy (MRM) is capable in theory of imaging intact samples at micron scale1. As resolution increases however, signal per voxel is lost. Further signal losses from diffusion arise as gradient strengths increase2. The relative magnitudes of both sample and coil noise are important considerations at UHF and will depend on the sample size, amongst other factors. For small samples, the dominant source of noise is the RF coil itself. Cryogenic cooling reduces coil noise, but cryogenic volume coils are difficult to construct so at present cryogenic surface coils are in use at high field. For a surface coil, from previous experiments and published data, cooling to 30 K can increase SNR by a factor of ≈ 4. SNR is inversely proportional to the diameter of the loop, so a smaller loop (e.g. 1.5 mm diameter) could lead to an increase of SNR ≈ 16. Solenoids placed transverse to the main field can be designed to be closely coupled to the sample and produce uniform RF fields so microsolenoids have been previously proposed for MR microscopy of small samples3. The work aims to compare the relative performance (SNR) of a cryogenic 24 mm diameter loop and a 1.5 mm diameter room temperature solenoid and to characterize the sources of noise for different samples.Methods
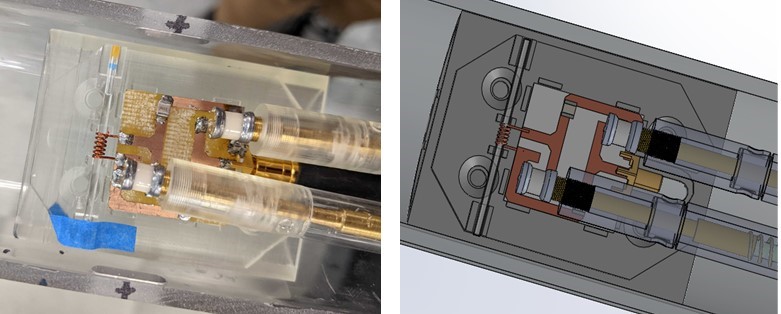
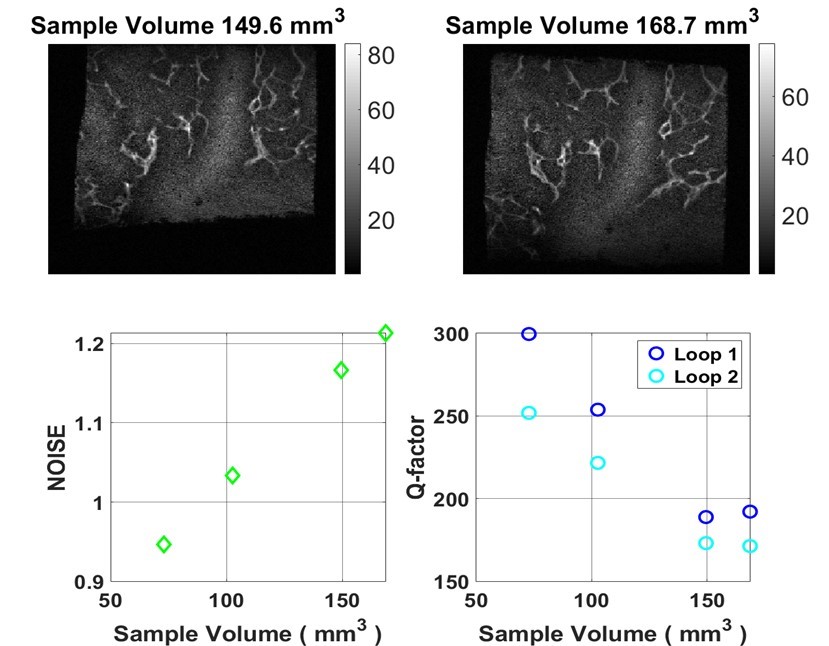
All studies were performed with a Bruker 15.2T Biospec imaging spectrometer equipped with 100 G/cm magnetic field gradients. A cryogenically-cooled 2-channel surface transmit-receive loop with a 24 mm diameter with a 5-Watt peak power limit was used to acquire images of small samples placed at 2 mm from the coil. These were compared to images obtained with a room temperature microsolenoid of 6 turns made using 0.4 mm diameter wire, 6mm length, and 1.5mm diameter. The coil was made using insulated copper wrapped around a capillary tube into which small samples could be placed (fig. 2). The coil circuit consists of 2 fixed capacitors and 2 variable capacitors for tuning and matching the coil to 647 MHz within the bore. A second microsolenoid of the same dimensions was fabricated using silver wire. To eliminate high-frequency common mode currents on the shielding of the coaxial cable, a floating trap was used4. A reference solution of 6 mM/L CuSO4 was placed in a capillary for SNR comparisons (fig. 3) between the cryoprobe, the copper and the silver solenoids. The CuSO4 solution had a T1 and T2 of roughly 150ms and 45ms respectively. 3D FLASH images of different spatial resolutions were acquired with common parameters of 6x5x5mm field of view, 50 kHz receiver bandwidth. TE, TR, and flip angle were varied with increasing resolution but were the same for the 3 RF coils investigated. SNR was calculated by measuring the signal within the capillary and noise from the corner of the image. Images in a coronal plane (length-wise with the solenoid) are shown in figure 2. Sample noise in the surface array was investigated by scanning and incrementally removing portions of Solanum tuberosum to determine the sample’s noise contribution (fig.4).Results
For each resolution ranging roughly from 100 µm to 20 µm isotropic 3D FLASH imaging, the silver solenoid’s SNR was 3.8 times better than the cryoprobe, and 1.4 times better than the copper solenoid (fig. 2). Apart from brightening near the increased sensitivity near the solenoid windings, the silver solenoid’s highest resolution (23x20x20 µm) image has noticeable distortion in the first phase encoding direction.Discussion
The cryoprobe is designed for mice brain imaging when the sample noise is relatively greater than the reference sample considered here. However, the coil noise is still a significant limitation on performance and samples capable of being placed within the 1.5 mm solenoid produce higher SNR. The SNR gain due to the silver wire is greater than would be predicted (factor of 1.02) by consideration only of its lower resistivity (1.59x10⁻⁸ ohm m) compared to copper (1.68 x 10⁻⁸ ohm m), and may be due to a more optimal tune and match. The artifacts in the silver solenoid images may be from the higher magnetic susceptibility5 and can be circumvented by submerging the coil in a perfluorocarbon6. Frequency drift in the coil’s resonance becomes more apparent with longer scan times and can be seen in figure 2 as the image is blurred and moved out of the FOV in the frequency encoding direction. The circuit may need to be designed in such a way that the coil’s resonance is more robust to temperature changes in the load and frequency drift of the receiver. Further signal loss due to diffusion at resolutions < 10 µm may be addressed with phase encoding in all 3 directions although at the cost of longer scan times7.Conclusion
Given the inverse relationship of coil diameter with SNR and the gain due to the cryogenics, the improvement factor of 3.8 is in line with the expected SNR ratio of 4. Given the SNR results of the silver solenoid and assuming ideal imaging conditions over an excised piece of tissue (T1 ≈ 300 ms), the silver solenoid should achieve an SNR of 10 in 7 hours at 10 µm isotropic resolution.Acknowledgements
The Chan-Zuckerberg Initiative (CZI) for Deep Tissue ImagingReferences
1. L Ciobanu, CH Pennington. 3D micron-scale MRI of single biological cells. Solid State Nucl Magn Reson. 2004;25(1-3):138-141.
2. CB Ahn, ZH Cho. A generalized formulation of diffusion effects in micron resolution nuclear magnetic resonance imaging. Med Phys. 1989;16(1):22-28.
3. Peck TL, Magin RL, Lauterbur PC. Design and Analysis of Microcoils for NMR Microscopy. J Magn Reson Ser B. 1995;108(2):114-124.
4. Seeber DA, Jevtic J, Menon A. Floating shield current suppression trap. Concepts Magn Reson Part B Magn Reson Eng. 2004;21B(1):26-31.
5. Dupree R, Ford CJ. Magnetic Susceptibility of the Noble Metals around Their Melting Points. Phys Rev B. 1973;8(4):1780.
6. Kc R, Gowda YN, Djukovic D, Henry ID, Park GHJ, Raftery D. Susceptibility-matched plugs for microcoil NMR probes. J Magn Reson. 2010;205(1):63-68.
7. Webb AG. Optimizing the point spread function in phase-encoded magnetic resonance microscopy. Concepts Magn Reson Part A. 2004;22A(1):25-36.
Figures