1540
Simulation validation of an 8-channel parallel-transmit dipole array: including RF losses for robust correlation with experimental results1Biomedical Engineering Department, School of Biomedical Engineering and Imaging Sciences, King's College London, London, United Kingdom
Synopsis
A method for validation of the simulation model with respect to experimental results is introduced for an 8-channel parallel-transmit dipole coil array. An original approach to include RF losses is described. The simulation results were quantitatively compared to the experimental data in terms of scattering parameters, individual transmit field (magnitude/phase) and combined transmit field. Two distinct configurations, not including RF losses were compared to the proposed approach. High correlation was achieved between simulated and experimental data. We conclude that with the proposed approach for RF losses, a robust validation is achieved for the 8-channel parallel-transmit dipole coil array at 7T.
Introduction
It is crucial to demonstrate a robust correlation of the simulated and manufactured parallel-transmit (pTx) arrays performances to release the currently-use very restrictive safety margins (5x more restrictive compared to single-Tx for commercial coils). Up to date, pTx is not extensively used due to heavy local specific-absorption-rate (SAR) restrictions on the acquisition parameters. In this work, we studied three simulation setup configurations to investigate the role of design parameters on the correspondence of the simulated and experimental scattering matrix and individual and shimmed B1+-field maps with similar amplitude and phase pTx RF pulse settings for the manufactured pTx dipole array with in-house manufactured phantom.Methods
The three simulation configurations are following:Configuration 1: 8pTx-dipole array1 with the exact circuit layout including copper traces and printed-circuit board (Fig.2A). In co-simulation, the lumped elements were defined as inductors or capacitors. To include component losses, capacitors were assigned a general Q-factor of 15002. In addition, to mimic RF losses along the line from RF power amplifiers to the coil input, a series resistor was added to both inductors (Fig.2A&D) in co-simulation.
Configuration 2: 8pTx-dipole array with the exact circuit layout only. Note that the simulated model was similar as in configuration 1, but the capacitors were considered lossless, and no resistors were included (Fig.2B&E).
Configuration 3: 8pTx-dipole array simulated with co-simulation method3 only (Fig.2C). Instead of the exact circuit layout, each dipole included only the source which was defined as a matching circuit in co-simulation with one series inductor and one parallel capacitor (Fig.2F). This is a common approach in the field to spare computational time and power.
The built eight dipoles were tuned and matched to 297.2MHz and the experimental scattering matrix (S-matrix) was acquired using a purpose-designed phantom4. Reflection (Si,i) and coupling curves were recorded. MR acquisitions were performed on phantom on a 7T MR scanner (MAGNETOM Terra,Siemens,Germany). The B1+-field distribution was acquired5 in circularly polarized (CP) mode, C2P mode (reversed CP phases), and one RF shimmed configuration. Individual B1+-field maps (magnitude/phase) were acquired6. Combined and individual B1+-field maps were normalized to 1kW total output power at RF amplifiers. The individual phase maps were computed relative to the shimmed combined RF phase map.
Electromagnetic field simulations were performed using a finite-difference time-domain (FDTD) simulation software (Sim4life 6.2,ZMT,Switzerland) for the 8pTx-dipole array. The simulated impedance data was exported to a co-simulation software (Optenni,Finland) to tune/match the dipoles.
For the three configurations, the S-matrix was optimized to match the experimental S-matrix for the reflection coefficients (Si,i), and 1st (Si,j) and 2nd (Si,j+1) coupling terms. The simulated optimized S-matrix was compared to the experimental values. Simulated S-curves were computed in configuration 1.
Simulated individual B1+-field maps were computed and were normalized, per channel, to the corresponding averaged measured B1+-field value. The three combined maps in CP, C2P, and RF shimmed configurations were calculated using the same RF phases applied in measurements. Difference maps were calculated, and the normalized root-mean-square error (NRMSE) was computed between simulated and measured B1+-field maps.
Results
In configuration 1, an average relative difference of 1.1% was found between simulated and experimental Si,i values, 4.2% for Si,j, and 9.4% for Si,j+1 (Fig.3B). The experimental/simulated S-curves presented a similar shape although the difference between 1st and 2nd coupling curves were more pronounced with the simulated data (Fig.3C-F). In the same configuration setup, the simulated individual B1+-field magnitude maps were remarkably well correlated with the experimental results. Notably, the regions where the B1+-field is canceled were similar (Fig.4A). The NRMSE values for individual B1+-field maps ranged from 2% to 4.8%. An averaged difference of 15 degrees was found between simulated and experimental individual phase maps. The simulated B1+-field maps in CP, C2P, and shimmed modes were comparable to the experimental maps, using the exact same phases. NRMSE values of 6.2%, 10.3%, and 7.5% were observed between experimental and simulated maps in CP, C2P, and shimmed modes, respectively.In configurations 2 and 3, the average relative difference with experimental S-parameters was increased to 44% and 43%, respectively, for Si,j values. Clear coupling was visible between the dipoles in the simulated individual B1+-field maps and NRMSE values ranged from 5.3% to 7.3% in configuration 2 and 3.9% to 6.4% in configuration 3. The averaged phase difference was about 13 degrees in both configurations.
Discussion and Conclusion
In this study, we introduced a model to include RF losses in the simulations for an 8pTx-dipole array. The effectiveness of the model to accurately predict the B1+-field patterns was assessed, qualitatively and quantitatively, through a comparison with experimental data.Including component losses and a series resistor into the co-simulation circuit model highly contributed to getting a robust correlation between the experimental and simulated S-matrices. Input power is damped by the resistors, and consequently, the B1+-field efficiency of the simulated dipoles is decreased. The coupling between dipoles is therefore decreased in the simulated model. Nevertheless, the need for individual scaling indicates that additional sources of RF losses may have to be considered. We conclude that using the co-simulation approach and the proposed model for RF losses, a robust correlation is achieved between simulated and experimental data using the 8pTx-dipole array at 7T.
Acknowledgements
This work was supported by core funding from the Wellcome/EPSRC Centre for Medical Engineering [WT203148/Z/16/Z], the Wellcome Trust Collaboration in Science grant [WT201526/Z/16/Z], and by the National Institute for Health Research (NIHR) Biomedical Research Centre based at Guy’s and St Thomas’ NHS Foundation Trust and King’s College London and/or the NIHR Clinical Research Facility. The views expressed are those of the author(s) and not necessarily those of the NHS, the NIHR or the Department of Health and Social Care.References
1. Clément J, Tomi-Tricot R, Satnarine R, Hand JW, Malik SJ, Zivkovic I, Webb A, Hajnal JV, Ipek Ö (2020) 8-channel dipole array for 7 Tesla neonatal brain and cardiac MRI. 28th Annual Meeting of ISMRM, #4618
2. Chen G, Collins CM, Sodickson DK, Wiggins GC (2018) A method to assess the loss of a dipole antenna for ultra-high-field MRI. Magnetic Resonance in Medicine 79:1773–1780.
3. Kozlov M, Turner R (2009) Fast MRI coil analysis based on 3-D electromagnetic and RF circuit co-simulation. Journal of Magnetic Resonance 200:147–152.
4. Clement J, Ipek Ö (2021) A robust validation of parallel-transmit dipole array simulation setup for infant MRI at 7 Tesla. Annual Meeting of ESMRMB, #150
5. Yarnykh VL (2007) Actual flip-angle imaging in the pulsed steady state: a method for rapid three-dimensional mapping of the transmitted radiofrequency field. Magn Reson Med 57:192–200.
6. Fautz H-P, Vogel M, Gross P, Kerr A, Zhu Y (2008) B1 mapping of coil arrays for parallel transmission. 16th Annual Meeting of ISMRM, #1247
Figures
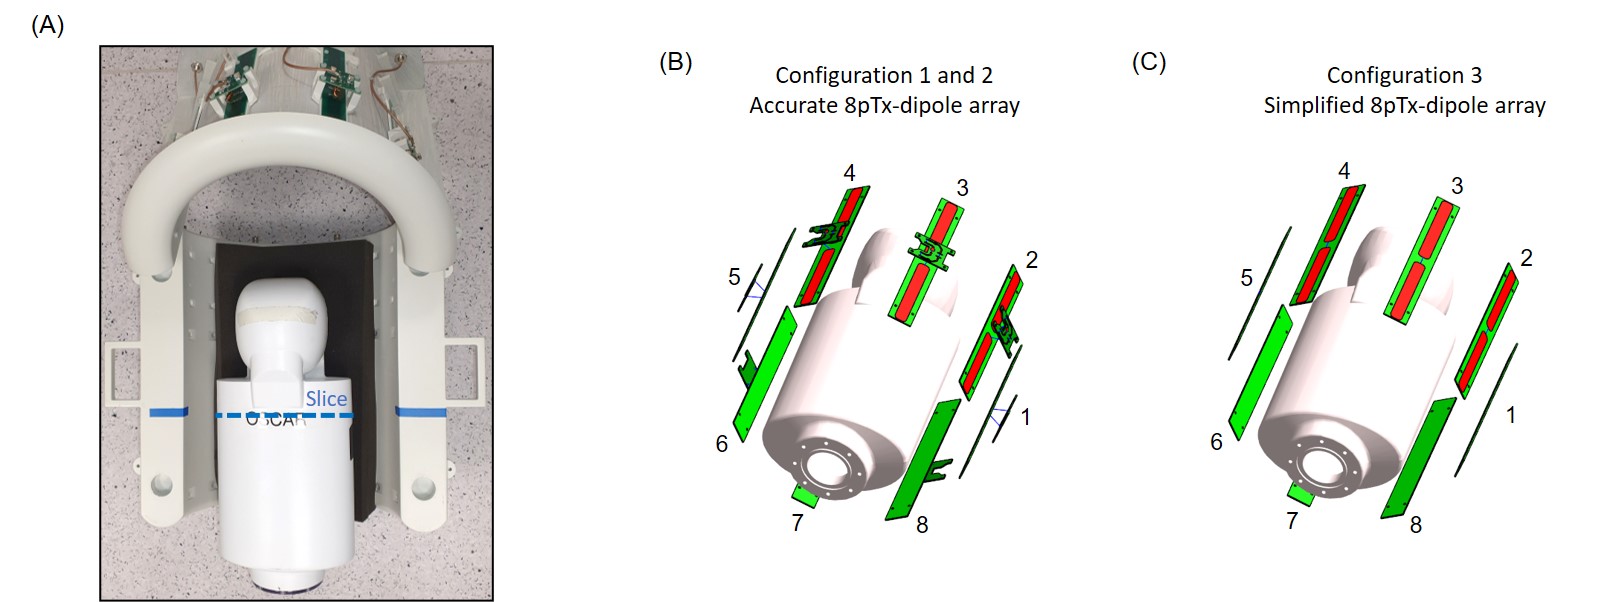
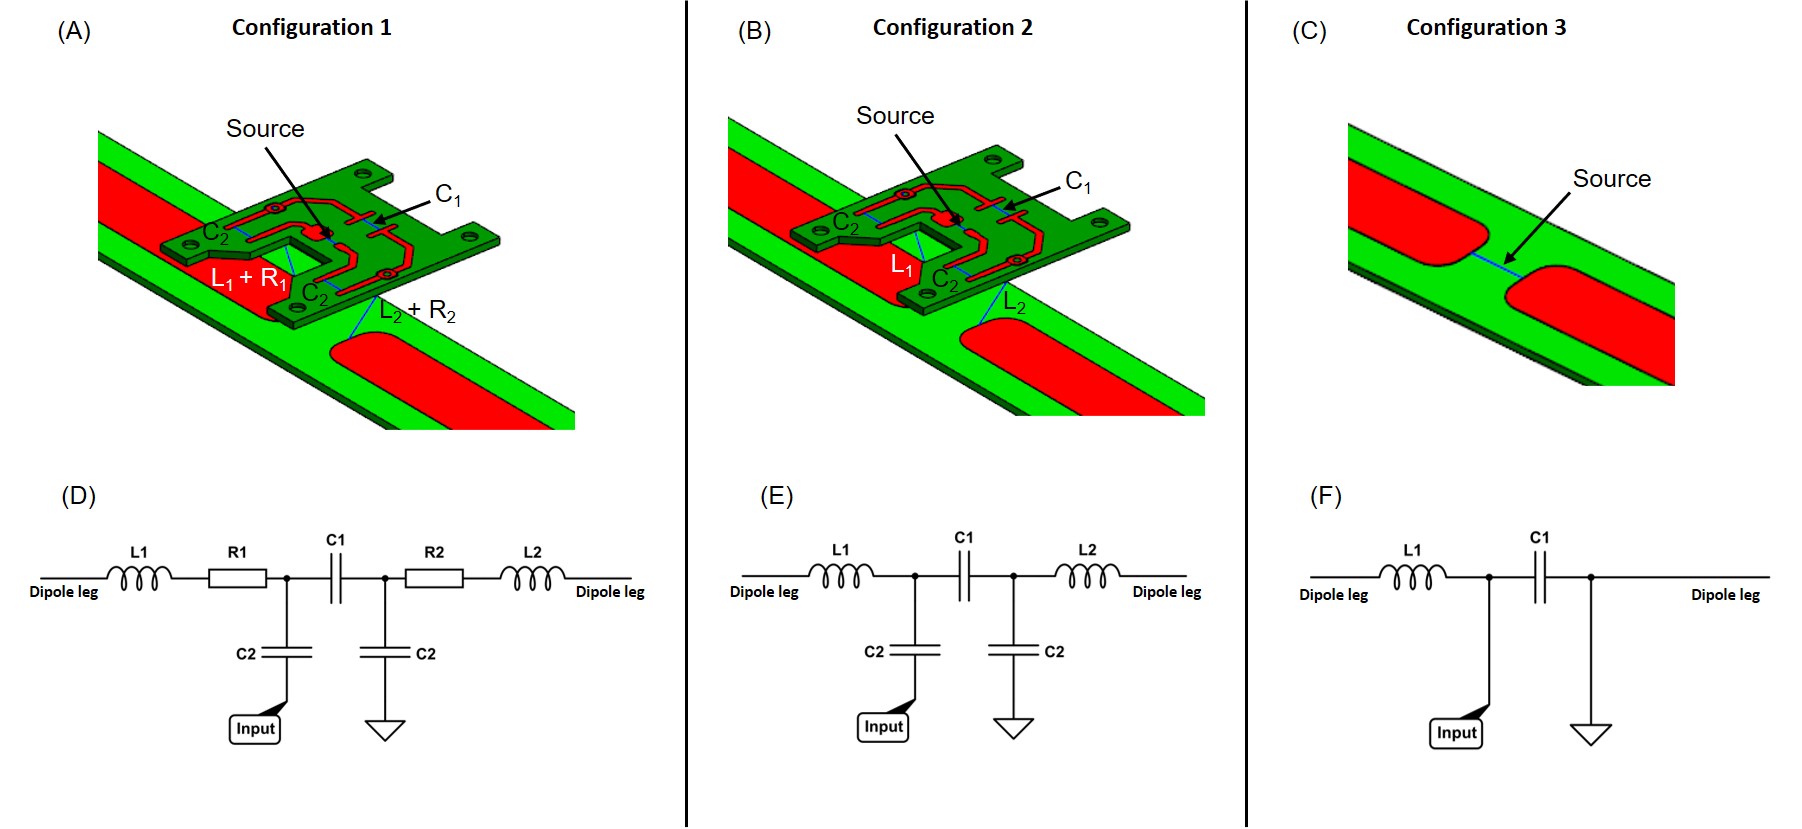
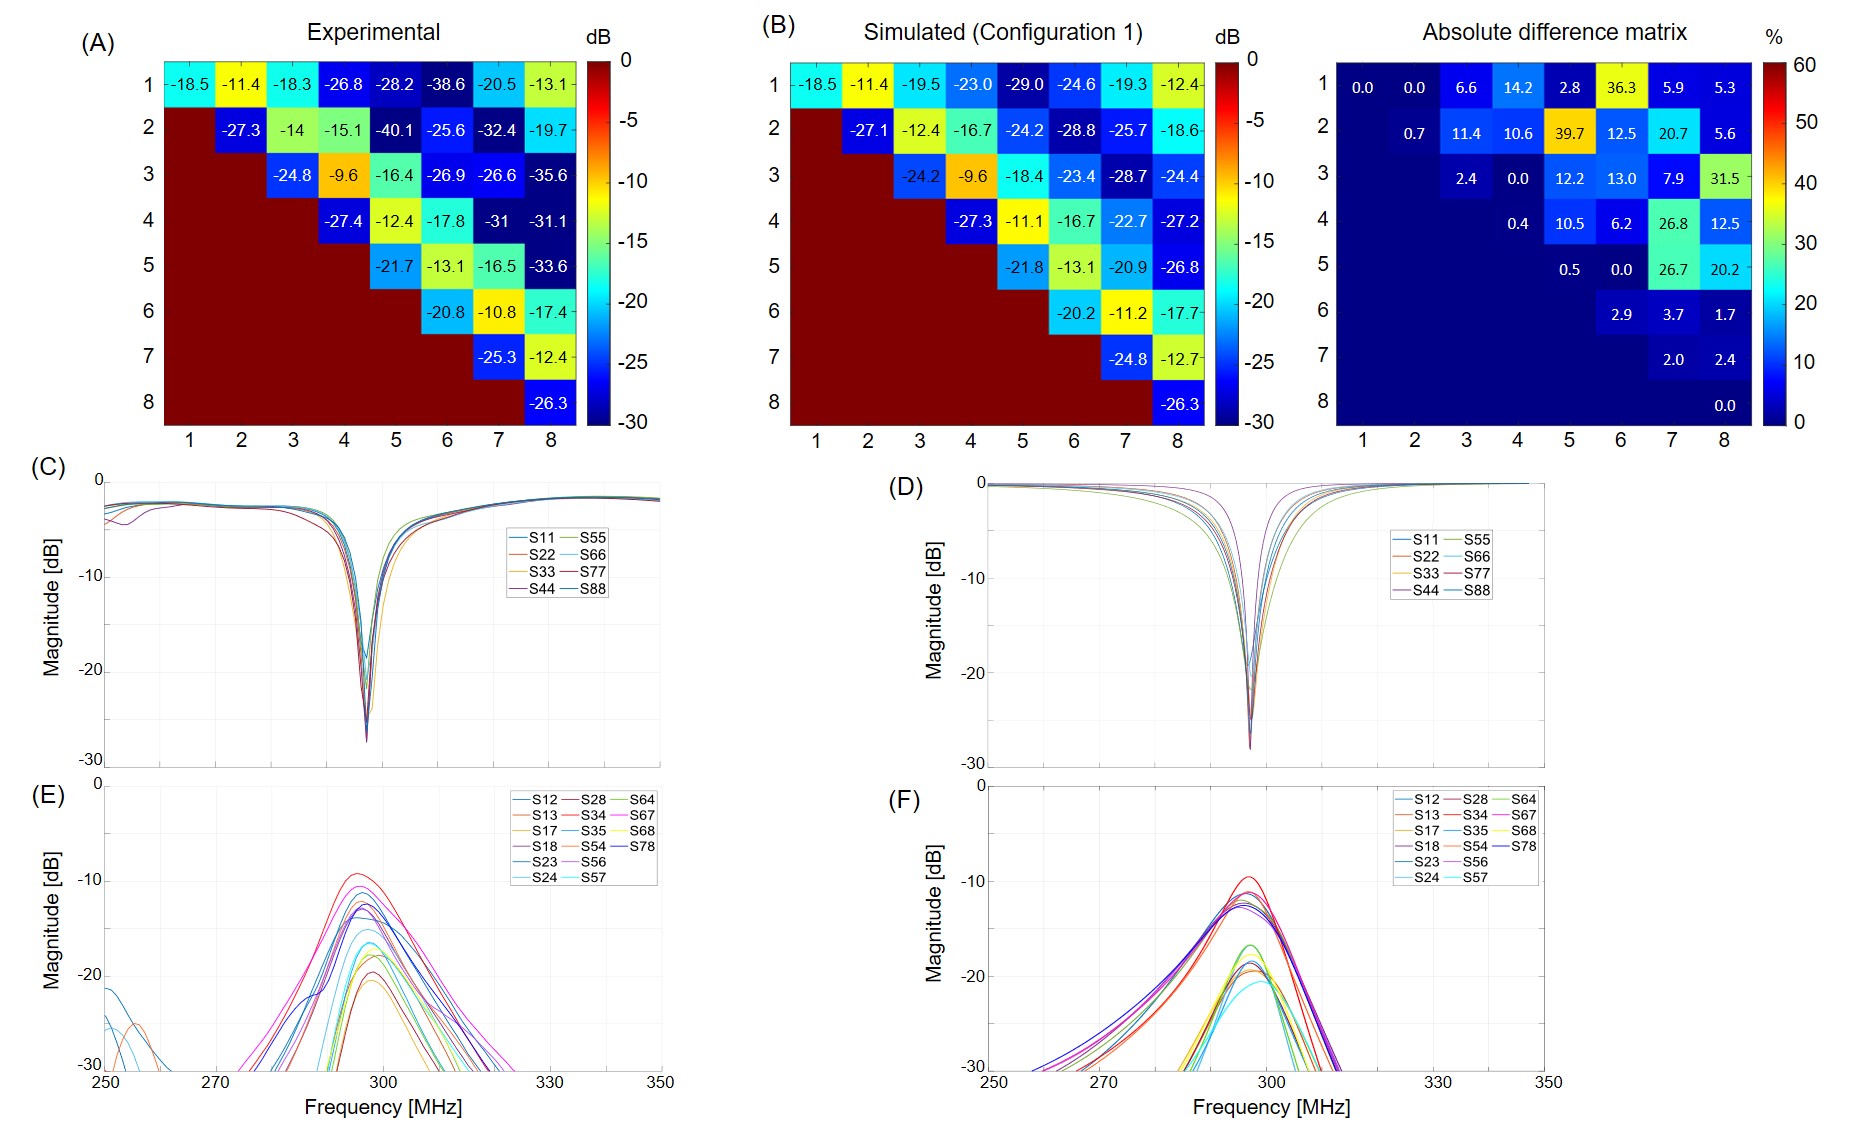
Figure 3. (A) Experimental and (B) simulated S-matrices and absolute difference matrix obtained for the in-house manufactured phantom (Fig.1A) in configuration 1. An average relative difference of 1.1% was found between simulated and experimental Si,i values, 4.2% for Si,j and 9.4% for Si,j+1. (C-F) Experimental (C&E) and simulated (D&F) scattering curves. In (C) and (D), the reflection coefficients are shown across a bandwidth of 100 MHz while in (E) and (F) the first and second coupling curves are shown.
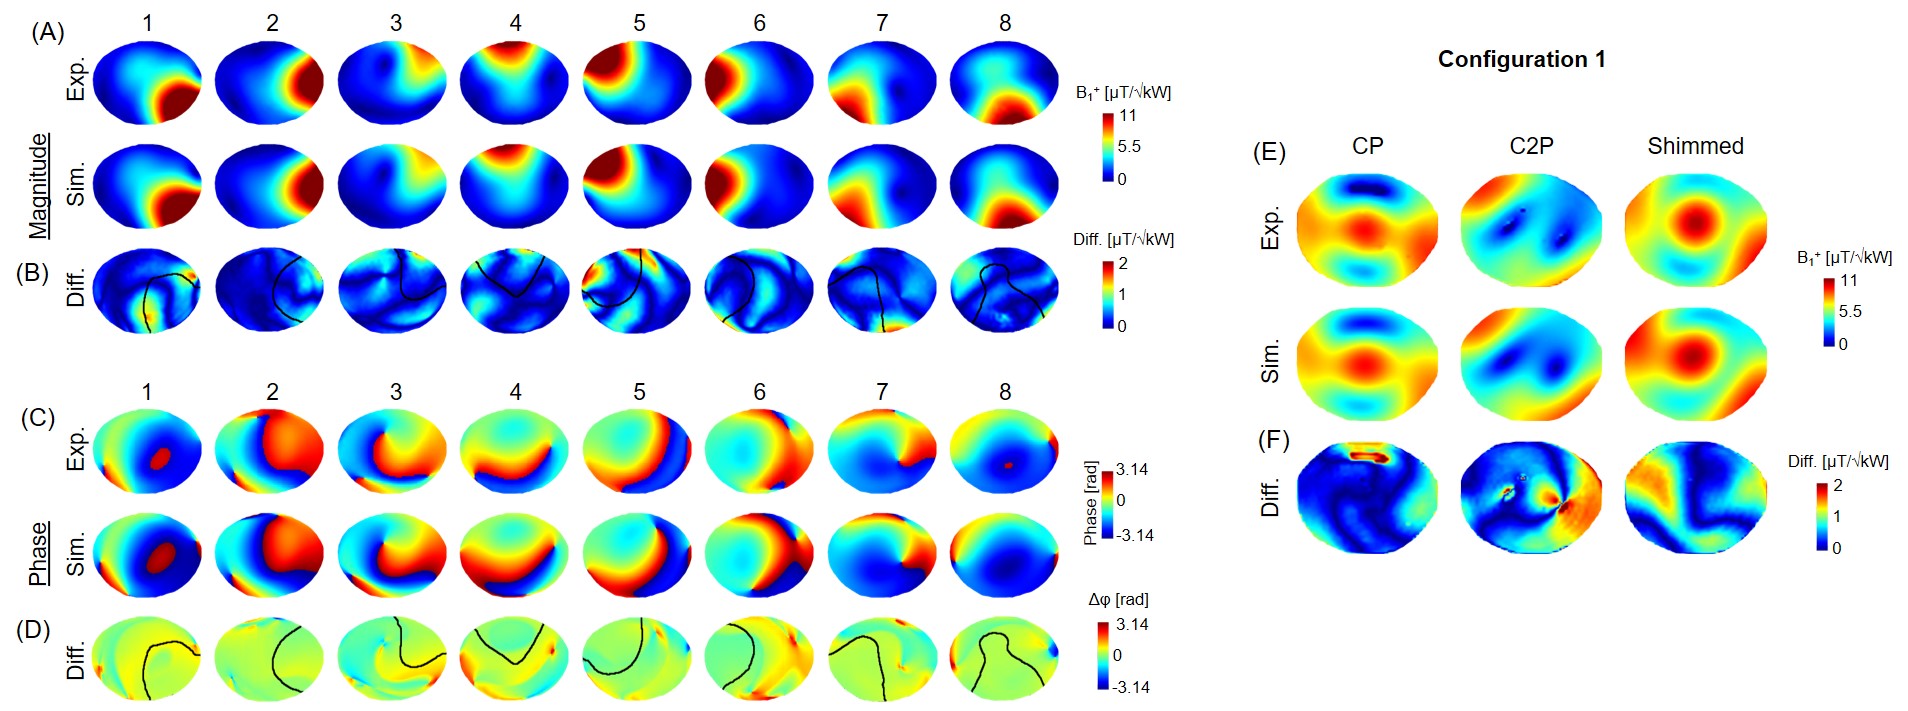
Figure 4. Experimental and simulated B1+-field maps, normalized to 1kW total input power, shown in A) for individual dipoles and E) for CP&C2P modes, and one RF shimmed configuration. (C) Experimental and simulated individual phase maps, computed relative to the shimmed mode. B,D&F) Difference maps calculated for the combined maps and individual B1+-field maps with a different scale than A&E.In B&D a contour line was drawn (in black) to represent the experimental individual B1+-field distribution patterns
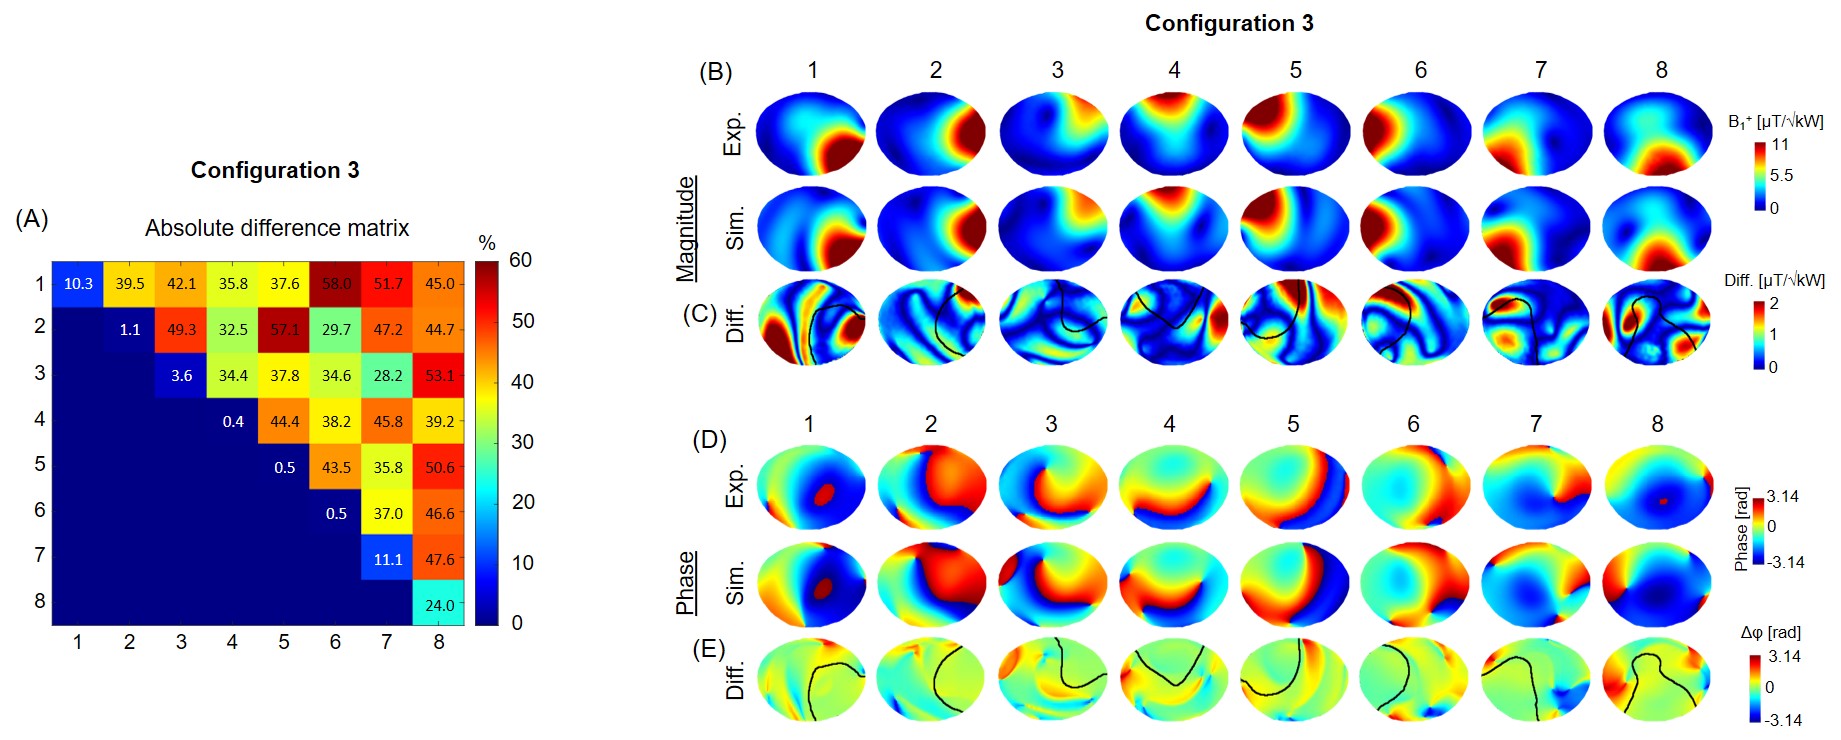
Figure 5. (A) Absolute difference matrix between simulated and experimental S-matrices. Experimental and simulated magnitude (B) and phase (D) for individual B1+-field maps. (C)&(E) Difference maps calculated for the individual B1+-field maps (B&D). In C) and E) a contour line was drawn (in black) to represent the experimental individual B1+-field distribution patterns (shown in B). The colour bar for the magnitude differences (C&E) have been rescaled to show residuals more clearly