1538
Investigation of correlation between surface current and coupling using conventional coils and shielded coaxial cable coils operating at 7T1Department of Electrical Engineering, Technology University of Eindhoven, Eindhoven, Netherlands, 2Department of Electrical Engineering, Technical University of Denmark, Kongens Lyngby, Denmark, 3Danish Research Centre for Magnetic Resonance, Centre for Functional and Diagnostic Imaging and Research, Copenhagen University Hospital Amager and Hvidovre, Copenhagen, Denmark
Synopsis
One of the major challenges in the design of multichannel arrays for UHF MRI is minimizing coupling between elements. Shielded-coaxial-cable (SCC) coils have been recently proposed as highly decoupled elements per se: however, the decoupling mechanism of SCC coils is still not determined. In this work, we examined the relationship between coupling, surface current density uniformity, and the total current on coil conductor through measuring and simulating three different 2-coils arrays. While no correlation was observed between surface current density uniformity and interelement coupling, a negative correlation was observed between the coupling and the total current on coil conductor.
Introduction
One of the major challenges in the design of multichannel arrays for UHF MRI is minimizing coupling between elements. A summary of the existing decoupling techniques can be found in [1]. Use of the shielded-coaxial-cable (SCC) coil as array elements is convenient since no additional decoupling is needed [2,3]. However, the exact decoupling mechanism of SCC coils is still not determined. One assumption was that interelement coupling is related to surface current distribution (SCD) on the coil shield.In this work, we examine the relationship between coupling, SCD uniformity, and Total Loop Currents (TLC) using Conventional Coils (CC) (1 mm and 3 mm wire diameter) and SCC coils at 300MHz (7T MRI).
Methods
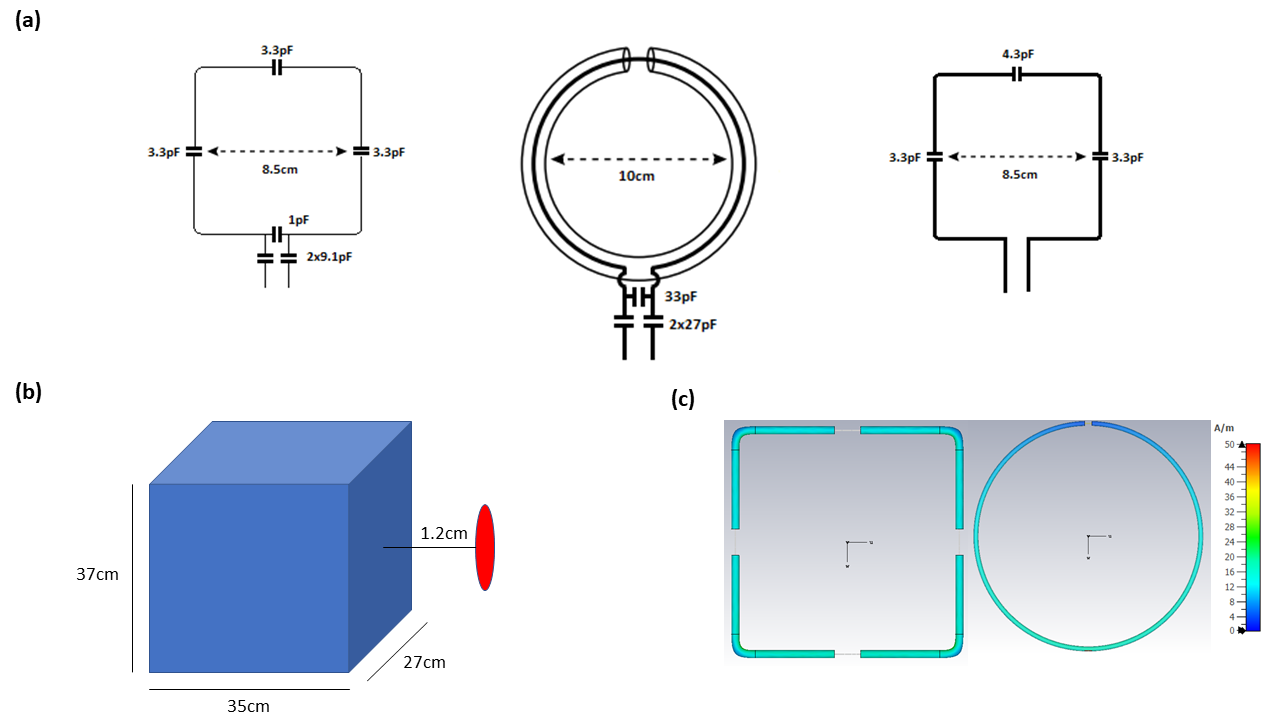
Square CC (arm length D=85mm) were fabricated using wires with two different diameters, 1 mm and 3 mm (Figure 1). The coils were tuned and matched at 12mm distance from a rectangular phantom using distributed capacitors and pi-matching networks. The phantom dimensions were 270x350x370mm, and the phantom was filled with a water-salt solution (2.5g/l of NaCl).1mm and 3mm CC were placed into 2-coil array configurations, and a VNA (Agilent Fieldfox) was used to measure the S-parameters of the arrays for different separation distances between elements (0.5cm to 5cm with 5mm step) and for different amount of overlap (0% to 100% with 10% step). The normalized S21 parameter (nS21) [4] was used to evaluate the total coupling between the array elements. Simulations have been performed in CST Microwave Studio software (Darmstadt, Germany), using a frequency domain solver with tetrahedral mesh. The simulation setup was the same as the measurement setup, with phantom properties εr=78 and σ=0.6 S/m.
The maximum (max) and minimum (min) values of SCD have been exported from simulations. The parameter max/min was used to evaluate the uniformity of SCD along the two loops, while port currents were used to evaluate the TLC. The correlation between nS21 and max/min, and the correlation between nS21 and TLC has been examined using scatter plots. Fabricated SCC coils (as in [2]) have been used for comparison. The nS21 and TLC of SCC were simulated and measured, then compared with the 1mm and 3mm case. max/min data of SCC were not included, as max/min data of SCC also included the contribution from the inner conductor. Anyway, Figure 1c) shows good agreement between the SCD on the shield of an isolated 3mm SCC and the SCD on a 3mm wire.
Results
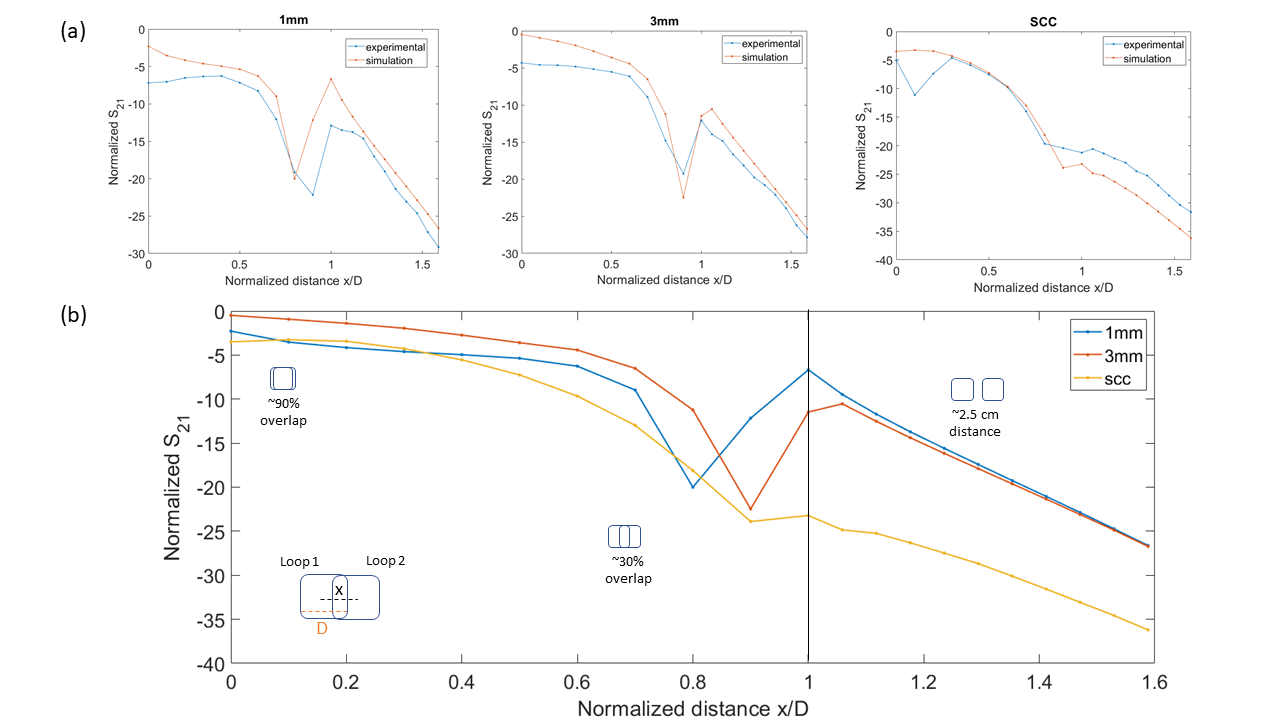
Figure 2 shows the results for the normalized S21 parameter.In Figure 2a) agreement between simulations and experiments is shown. In Figure 2b) the simulation results for the nS21 in the 1mm, 3mm, and SCC case are compared. SCC were always better decoupled than 3mm CC, while 1mm CC were sometimes better decoupled than SCC in the overlapping region. Figure 3 shows the results for the TLC and for the maximum and the minimum value of max/min plots.
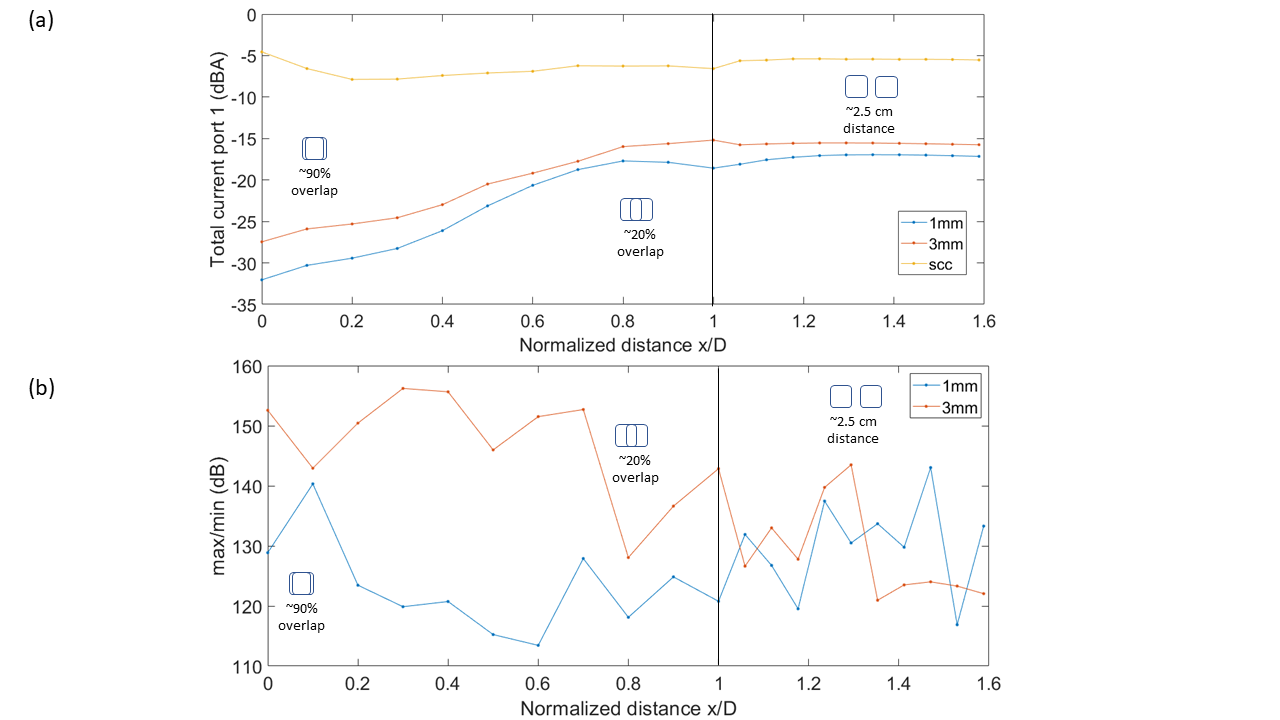
As of TLC, Figure 3a) shows a comparison between the TLC on port1 (port1 and port2 signals showed good agreement) in the 1mm, 3mm, and SCC case. For every value of the distance between the coils, TLCSCC > TLC3mm > TLC1mm.
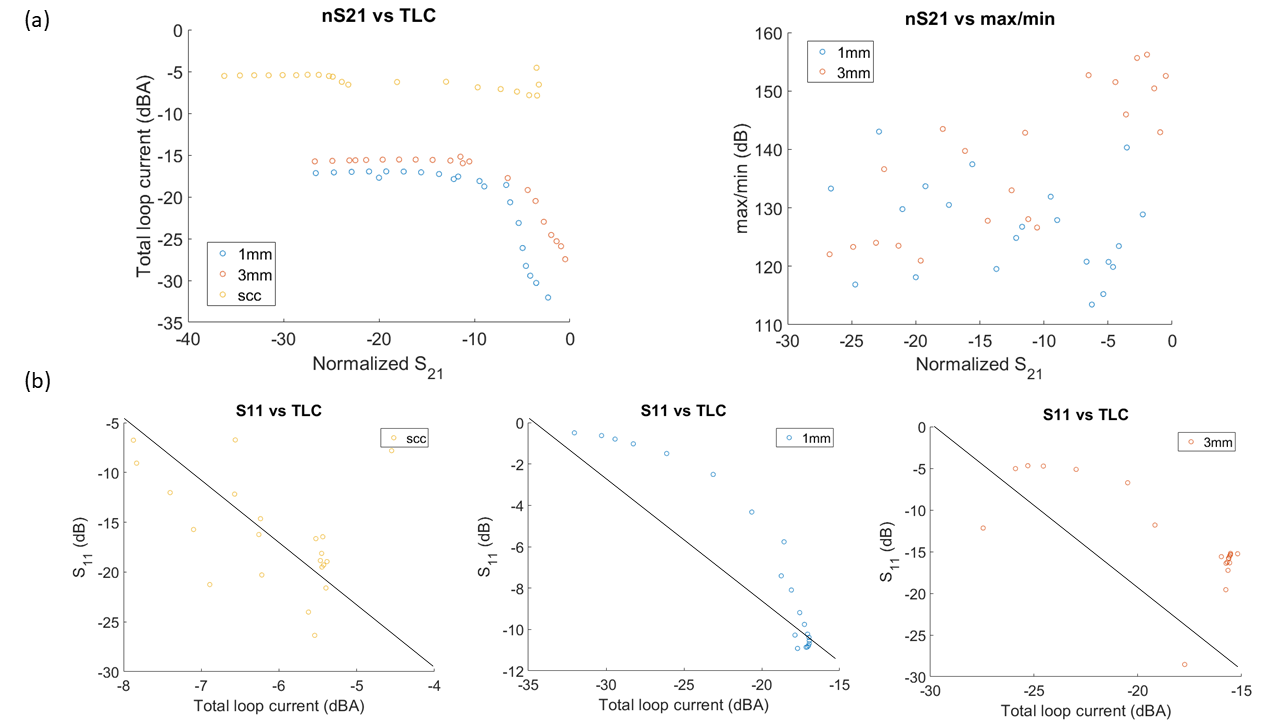
Figure 3b) shows a comparison between the max/min parameter in the 1mm and 3mm case. The behavior of the max/min parameter was noisy in both cases. Figure 4 shows the scatter plots relating nS21 to the TLC, and nS21 to the max/min parameter.
While there was no evidence of correlation between max/min and nS21 (Figure 4b), a negative correlation between nS21 and the TLC was found (Figure 4a). The relationship between the TLC and nS21 was very different in the 3 examined cases, and was therefore non-generalizable. Suspecting that the negative correlation between nS21 and the TLC derived from mismatching, scatter plots of S11 versus the TLC were made, and are shown in Figure 4c).
Discussion
The correlation between the coupling and the current on coil conductor was investigated. To quantify coupling, the nS21 parameter was used. To characterize the loop current, two synthetic parameters were extracted from the simulated design: port currents, and the max/min parameter. Port currents were used to quantify TLC, while the max/min parameter was used to evaluate SCD uniformity. While TLC was the highest for SCC coils, the coupling was the lowest: therefore, there was no positive correlation between the TLC and coupling. The noisy behavior of the max/min parameter suggested no correlation between the max/min and nS21 instead. A more accurate evaluation was carried using the scatter plots. Results from the scatter plots confirmed the hypothesis of no correlation between the nS21 and max/min in all the examined cases, while a negative relationship between the total loop current and the normalized S21 was found. We showed that negative correlation between nS21 and TLC could be partially attributed to coil mismatch.Conclusions
No correlation existed between the SCD uniformity (measured through max/min) and nS21, while a negative correlation existed between the coupling and TLC. The negative correlation could be partially attributed to mismatch. Further investigations are needed to understand the coupling mechanism of SCC.Acknowledgements
No acknowledgement found.References
[1] Zivkovic I., “Interelement decoupling strategies at UHF MRI” , in Frontiers in Physics, October 2021, doi: 10.3389/fphy.2021.717369
[2] Ruytenberg T. et al, “Shielded‐coaxial‐cable coils as receive and transceive array elements for 7T human MRI”, in Magnetic Resonance in Medicine, 2020; 83(3) : pp. 1135–1146, doi: 10.1002/mrm.27964
[3] Ruytenberg T. et al, “A flexible five-channel shielded-coaxial-cable (SCC) transceive neck coil for high-resolution carotid imaging at 7T”, in Magnetic Resonance in Medicine, 2020;84: pp 1672–1677, doi: 10.1002/mrm.28215
[4] Xinqiang Yan et al, “Self-decoupled radiofrequency coils for magnetic resonance imaging”, in Nature Communications, (2018) 9:3481 | DOI: 10.1038/s41467-018-05585-8
Figures