1535
SNR and Field Strength with Small Surface Coils1Magnetic Resonance Center, Max Planck Institute for Biological Cybernetics, Tübingen, Germany, 2Biomedical Magnetic Resonance, University of Tübingen, Tübingen, Germany
Synopsis
The increase in SNR with higher field strength is one of the main drivers for ultra high field MRI. Here, the sensitivity gain is determined for phantoms in five different fields between 3 T and 14.1 T, using identical small surface coils and correcting for all scanner specific influences. A strong, more than quadratic SNR gain with increasing field strength was found, which applies to many animal studies and to measurements with weakly loading samples.
Introduction
The increase in SNR with higher field strength is one of the main drivers for ultra high field MRI. A previous paper has investigated the sensitivity dependence on field strength for human brain imaging, using some of the current array head coils1. While that study can give valuable insights into the practical effect of UHF in the most common brain imaging applications, the use of different coil designs and different instruments, the measurement on living subjects contributing physiological noise, and the limited range of examined field strengths limit its insights into the underlying physical background. This study thus investigates the growth of SNR with increasing field strength in phantoms, using surface coils with identical geometry and coil design and taking into account all instrument-specific influences.Methods
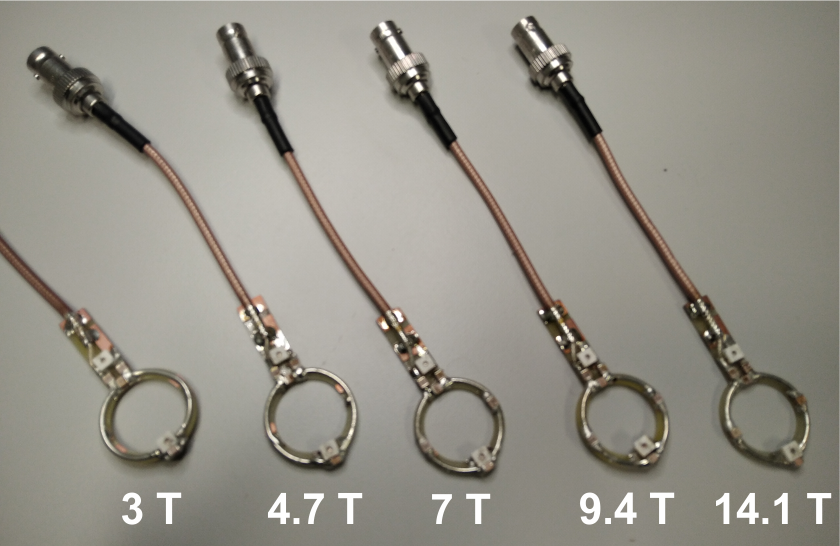
Experiments were performed on five different MR scanners with field strengths of 3 T, 4.7 T, 7 T, 9.4 T and 14.1 T, from different vendors (Siemens and Bruker) and in different sizes (human and animal scanners). Surface coils with a diameter of 2.2 cm were built for each of the field strengths (Fig. 1), and two different phantoms were used, consisting of 4-cm glass spheres filled with water, slightly doped with a Gd-based contrast agent. One of the phantoms also contained 0.6 % salt to mimic realistic loading, while the other one was used to investigate pure coil-dominated noise.The SNR in a simple spoiled gradient echo image is given by:
$$SNR\left(\overrightarrow{x}\right)=SNR_{0}\left(\overrightarrow{x}\right)\cdot 10^{-NF/10}\cdot R_C\left(\overrightarrow{x}\right)\cdot\frac{1-e^{-T_R/T_1}}{1-\cos\left(\alpha\left(\overrightarrow{x}\right)\right)e^{-T_R/T_1}}\cdot e^{-T_E/T_2^*},$$
where the right half of this equation is the well-known signal term for gradient echo imaging, RC(x) is the receive coil sensitivity, NF is the noise figure of the instrument and SNR0 is the required basic SNR, which is determined by measuring all unknowns in this equation. T1 was found by a series of inversion recovery experiments in different volume coils available at the scanners. All other measurements were performed with the surface coils in a single session for each scanner and sample.
The flip angle α was determined with a 3D AFI sequence2. Due to the relatively small range in which the flip angle can be determined with high accuracy3, the highly inhomogeneous field of the surface coil was measured ten times with varying pulse power and the final flip angle map was put together from the most accurate regions of each of the ten maps. The SNR was measured with a 3D spoiled gradient echo sequence with an isotropic spatial resolution of 250 μm, a matrix size of 1603, a TR of 20 ms, and a TE of 5 ms, keeping all other imaging parameters (like bandwidth) identical. To minimize the sensitivity to inaccuracies in the flip angle measurement, using the Ernst-angle for excitation is optimal, since here the SNR will vary least with changing flip angle. For this reason, the experiment was again repeated up to 12 times with different pulse power, and the final image, after correction for T1 and flip angle, was put together from those 12 images. An additional measurement with equal parameters, but with an excitation pulse of 0°, was used to obtain the noise amplitude.
The coil sensitivity was determined from the AFI-maps using the principle of reciprocity: The pulse voltage at the coil entrance was measured with an oscilloscope and used to calculate highly accurate maps of B1/voltage, which are used as coil sensitivity maps. Finally, the noise figure NF was measured for every scanner using the Y-method and a calibrated noise source4.
Results
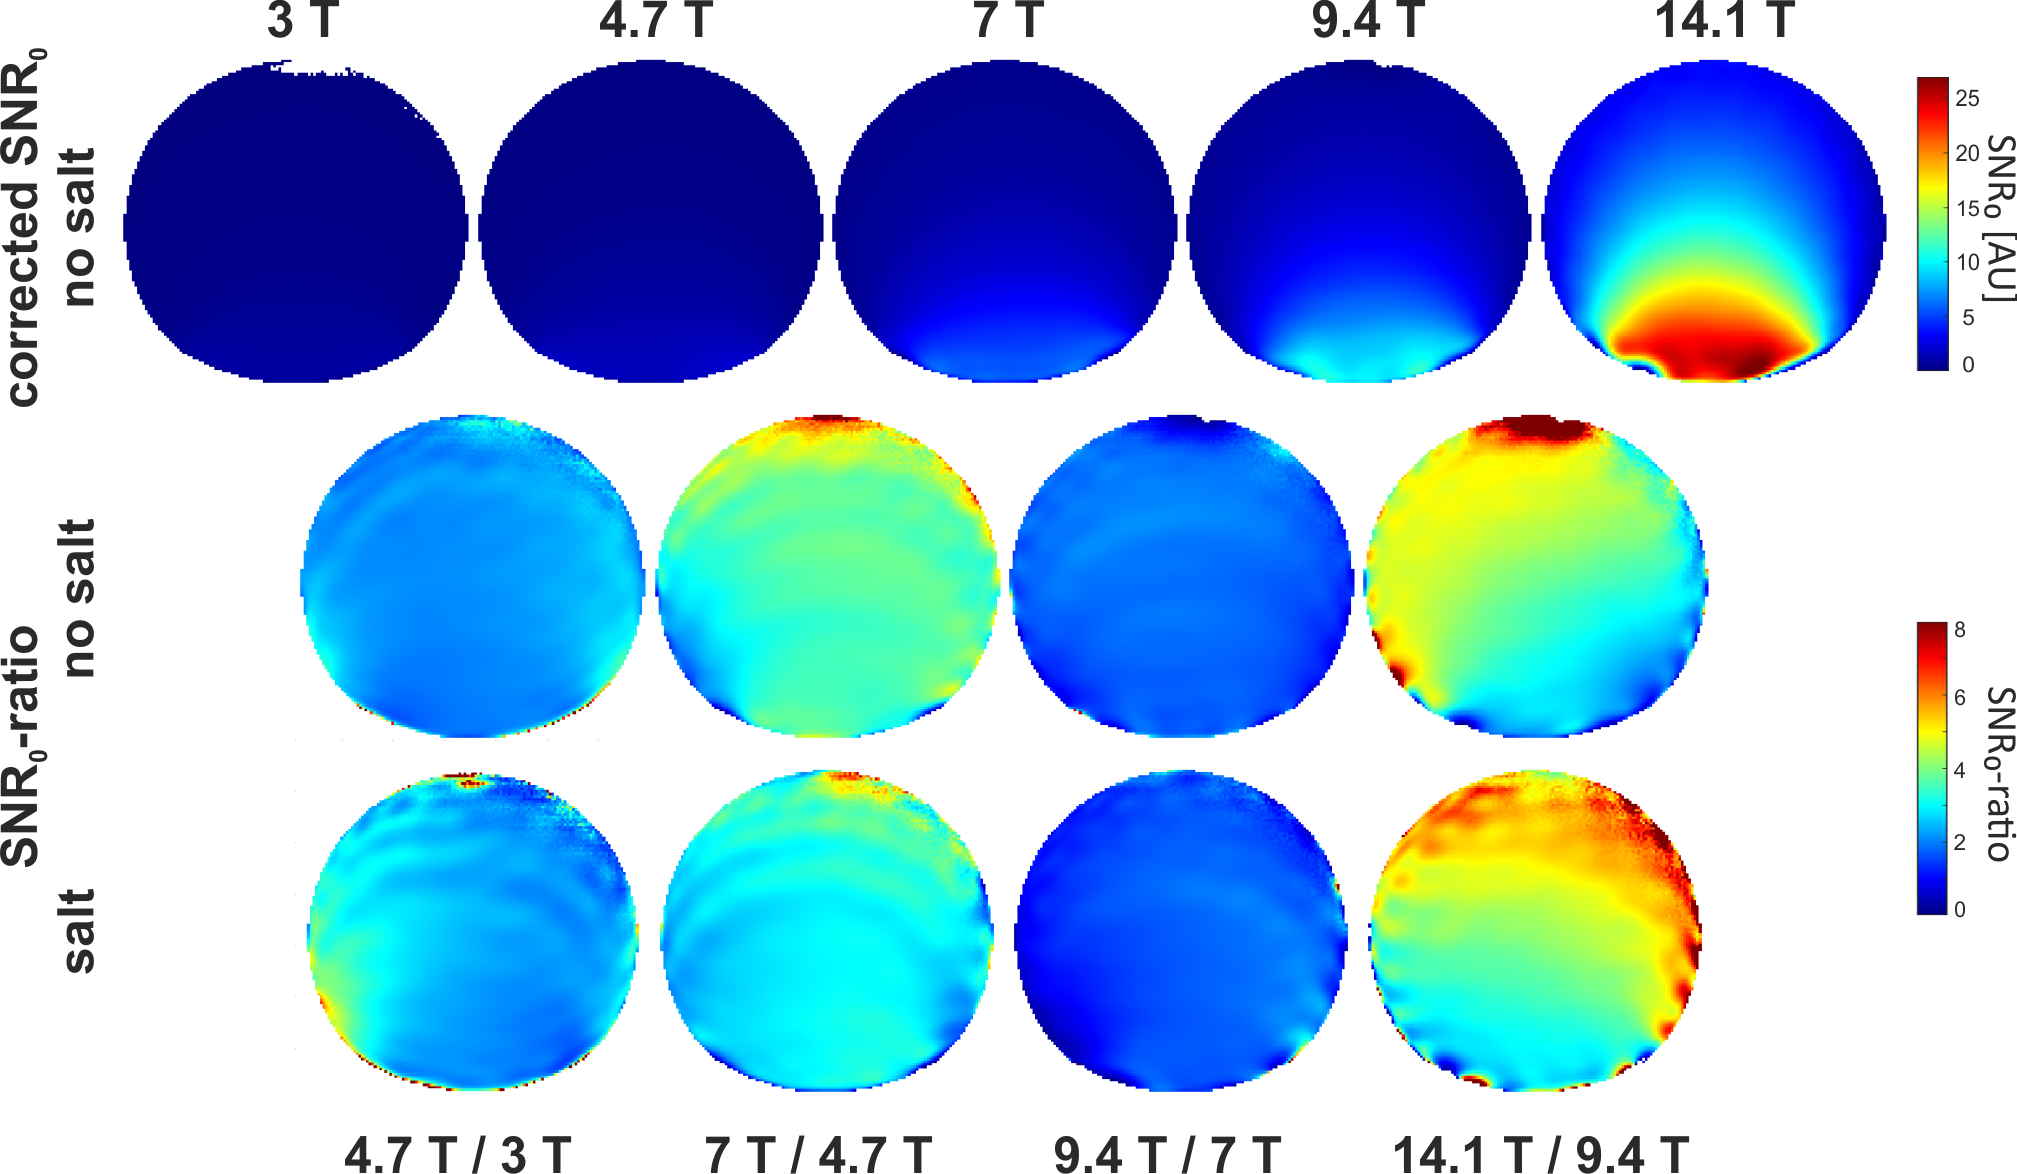
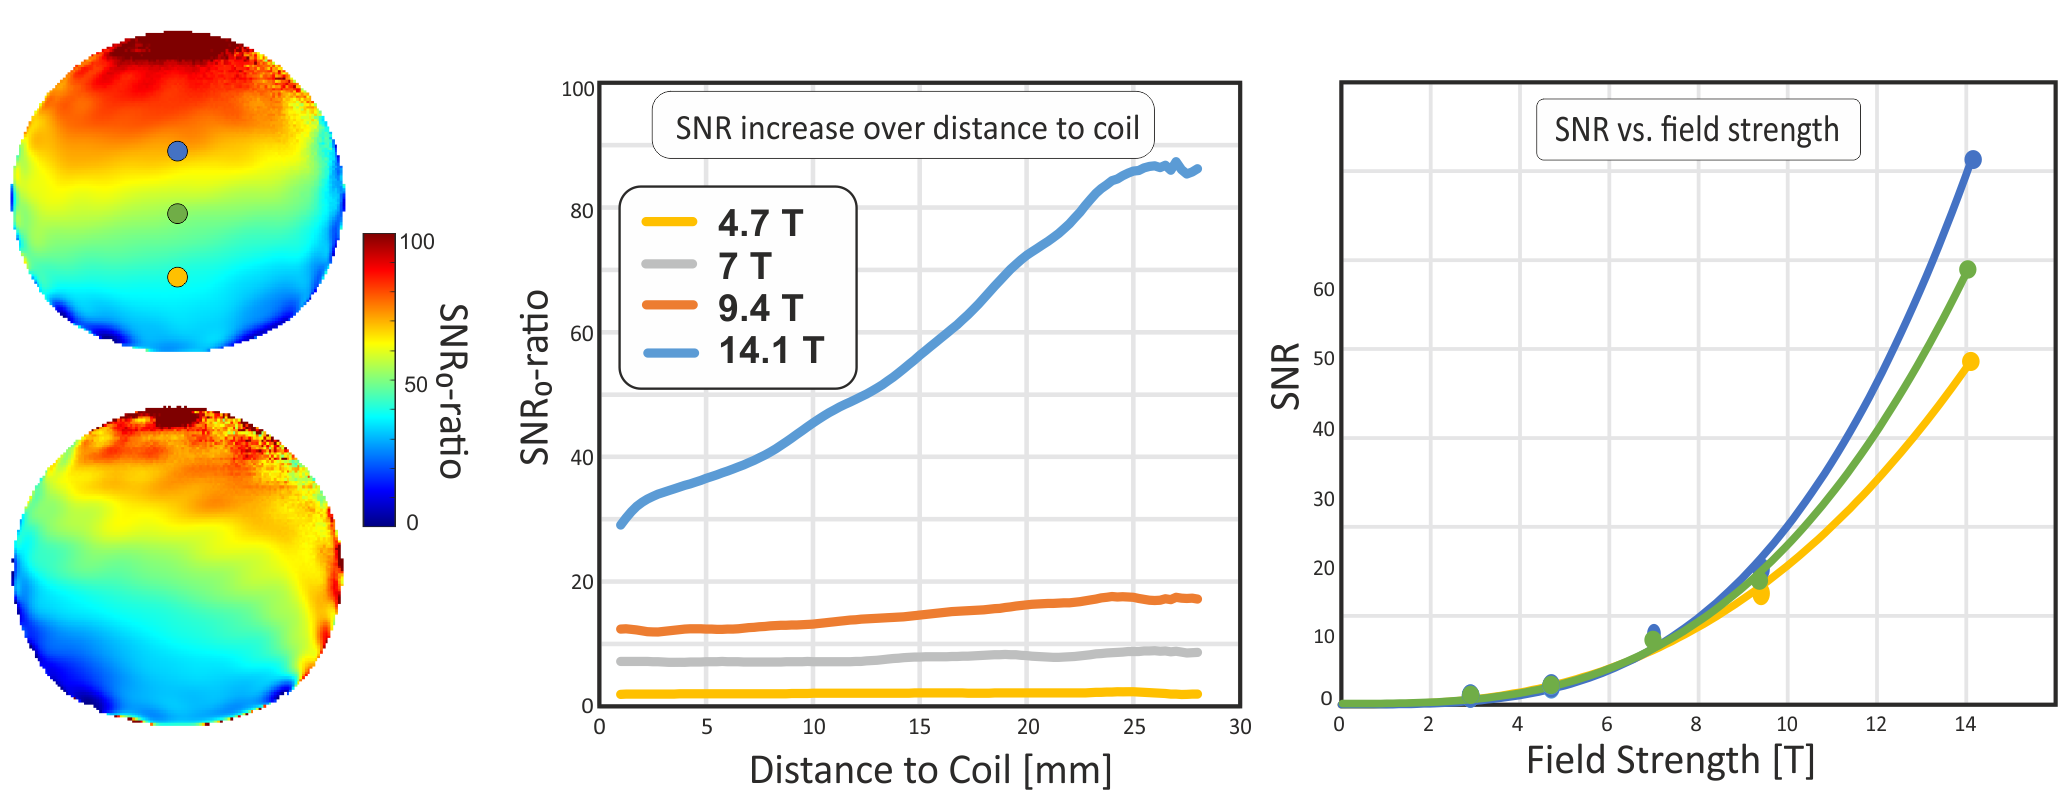
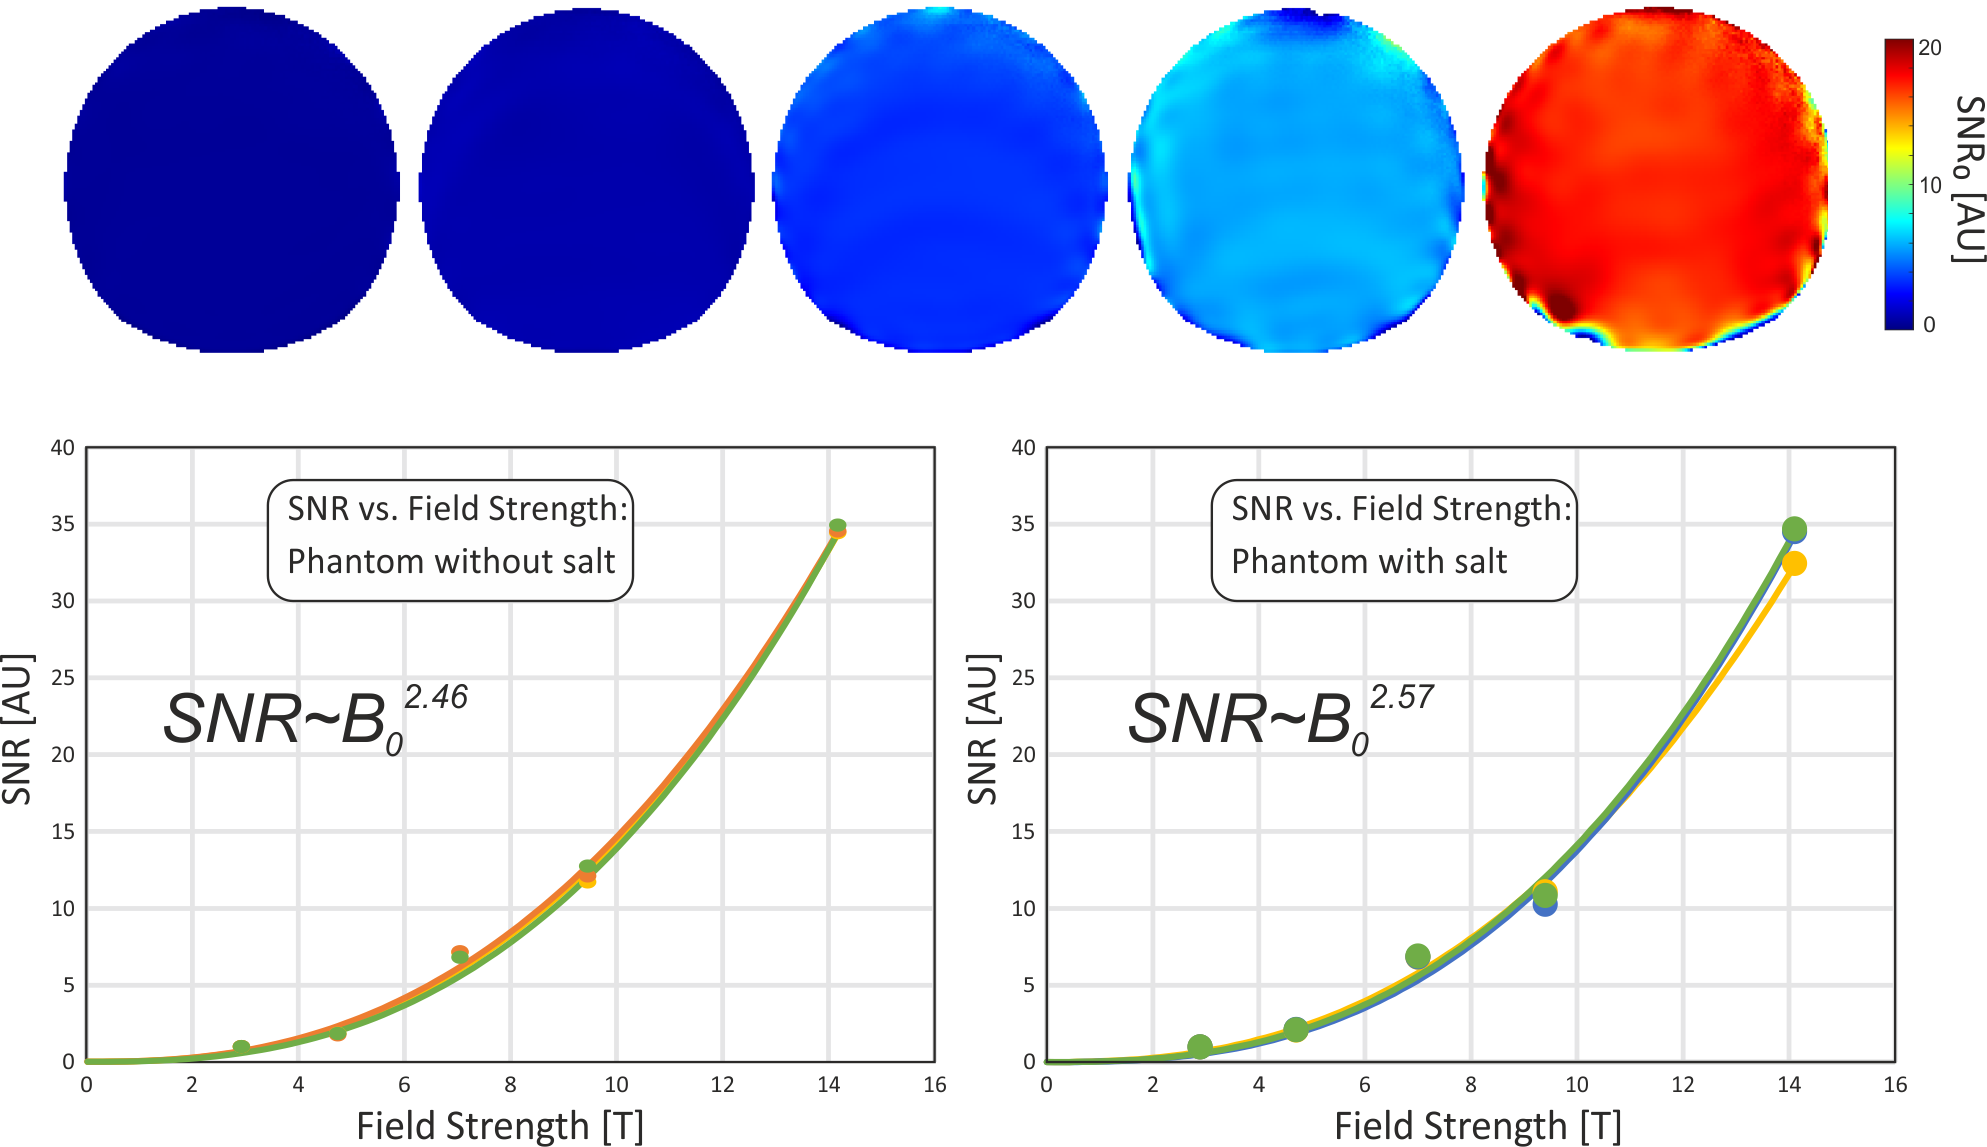
SNR maps from all five magnetic fields are shown in Fig. 2. In these images, only the coil sensitivity at one specified point of the image was used for correction, while the spatial distribution of the corrected SNR is still visible. Not surprisingly, the SNR is growing rapidly with increasing field strength, where the SNR gain is highest at larger distances from the coil. This is confirmed in Fig. 3, which shows the SNR dependence on space for three exemplary ROIs. In Fig. 4, the SNR maps are further corrected by the full coil sensitivity map, which removes the dependence of the SNR on space. An SNR increase with field strength of around B02.5 is found, with a slightly higher gain for the phantom that also contained salt.Discussion
The data acquired here shows an even higher increase in SNR than in a previous study in humans1. This is in part due to the lack of physiological noise, but also to the size of the coils and the nature of the phantoms. For fully coil noise dominated samples, like the salt-free phantom measured here, a higher increase of SNR with field strength is expected5. While sample noise will contribute in the measurements of the salted sample, coil noise will still be an important factor due to the small coil size, at least for the lower field strengths, which is illustrated by the Qunloaded/Qloaded ratio, which ranges between 1.3 (3 T) and 4.6 (14.1 T). The results shown here can thus not be generalized to human experiments, but apply to all measurements on weakly loading samples and to many animal experiments with similarly small surface coils.Acknowledgements
No acknowledgement found.References
1. Pohmann R, Speck O, Scheffler K. Signal-to-noise ratio and MR tissue parameters in human brain imaging at 3, 7, and 9.4 tesla using current receive coil arrays. Magn Reson Med 2016; 75(2): 801-9.
2. Yarnykh VL. Actual flip-angle imaging in the pulsed steady state: a method for rapid three-dimensional mapping of the transmitted radiofrequency field. Magn Reson Med 2007; 57(1): 192-200.
3. Pohmann R, Scheffler K. A theoretical and experimental comparison of different techniques for B1 mapping at very high fields. NMR Biomed 2013; 26(3): 265-75.
4. Noise Figure Measurement Accuracy - The Y-Factor Method. Agilent Application Note 57-2. 2014.
5. Edelstein WA, Glover GH, Hardy CJ, Redington RW. The intrinsic signal-to-noise ratio in NMR imaging. Magn Reson Med 1986; 3(4): 604-18.
Figures