1534
Iron Imaging with 3D Multi-Gradient Recalled Echo (3D-mGRE) and 3D Ultra-short Echo (3D-UTE) Sequences: A Phantom Comparison Study1School of Health Sciences, Purdue University, West Lafayette, IN, United States, 2Weldon School of Biomedical Engineering, Purdue University, West Lafayette, IN, United States, 3Department of Radiology, Medical Physics, University of Freiburg, Freiburg, Germany, 4Wellcome Centre for Integrative Neuroimaging, University of Oxford, England, United Kingdom, 5Elmore Family School of Electrical and Computer Engineering, Purdue University, West Lafayette, IN, United States, 6Department of Radiology and Imaging Sciences, Indiana University School of Medicine, Indianapolis, IN, United States
Synopsis
This phantom study aimed to compare a conventional multi-gradient recalled echo (mGRE) sequence and an ultra-short echo (UTE) with a novel 3D rosette k-space trajectory for iron (Fe) detection and quantification. Conventional mGRE imaging may underestimate massive Fe load due to the long echo times (TEs). Advanced UTE techniques with TEs 10-200 times shorter than conventional mGRE sequences can capture fast signal decay caused by high Fe content. Our preliminary results show that both sequences yield a strong linear relationship between R2* values and Fe concentrations, with the 3D-UTE results aligning more with expected R2* values for high Fe concentrations.
Introduction
In MRI, the paramagnetic properties of iron (Fe) shorten the apparent relaxation time T2*, thus the relaxation rate R2* (R2* = 1/T2*) is commonly used as a proxy for Fe burden in the human body. Quantitative R2* relaxometry methods are used for the assessment of iron overload associated with Parkinson’s disease, Alzheimer’s Disease, and hepatic iron content1-3. However, in cases with “massive iron overload” (HIC levels > 25 mg Fe/g dry wt, for example), conventional multi-gradient echo (mGRE) imaging suffers a lack of precision and might eventually fail due to the long echo times (order of ms) and the rapidly decaying MR signals3. Advanced techniques with echo times (TEs) 10-200 times shorter than conventional mGRE sequences can detect signals with ultrashort T2 in order of microseconds. This phantom study compared a conventional 3D-mGRE sequence with an ultra-short echo time (UTE) sequence using a novel 3D rosette k-space trajectory to investigate the contrast mechanisms for iron detection and quantification. We hypothesize that the 3D-UTE sequence can surpass the limitations of conventional iron imaging sequences for detecting and quantifying iron.Methods
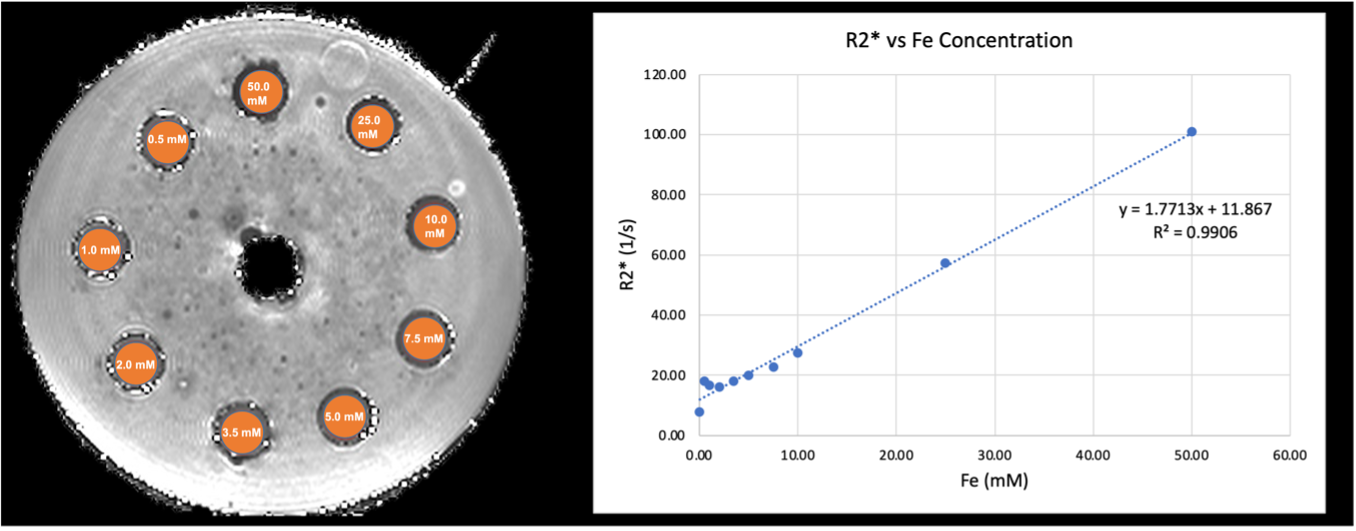
Phantom preparationA cylindrical phantom containing nine 15 mL vials of different concentrations of iron chloride (FeCl2) was constructed. A stock solution of FeCl2 dissolved in distilled water was diluted with a 1% agar solution make vials with Fe concentrations of 0.5, 1.0, 2.0, 3.5, 5.0, 7.5, 10.0, 25.0 and 50.0 mM. The vials were then fixed in a custom-made acrylic insert and submerged in the same agar solution used to dilute the phantom to provide a homogenous medium for shimming and imaging.
MRI measurements
The iron phantom was imaged using a 3T Siemens Prisma scanner with a 20-channel head coil. Quantitative T2* relaxation maps (MapIt, Siemens Healthcare) were obtained using the following imaging parameters: TR/dTE/TEs: 48/4.06/6.28-42.82 ms, flip angle: 15°, resolution: 0.8x0.8x3.0mm3, GRAPPA factor of 2, flow compensation, BW: 260 Hz/Px, 60 slices, total scan time 4.2 minutes.
The 3D dual-echo UTE sequence used in this study samples data with a rosette k-space trajectory4. The parameters for the UTE acquisition were Kmax: 250/m, samples/petal: 210, field of view (FOV): 240 mm isotropic, matrix: 120x120x120, readout dwell time: 10 μs, flip angle: 7°, TR: 7 ms, readout duration: 2.1 ms. Six dual-echo scans were acquired with first TEs of 20, 40, 80, 150, 600, and 1000 μs, and with second TEs of 2.12, 2.14, 2.18, 2.25, 2.7, and 3.1 ms. For one dual-echo UTE acquisition, 36100 petals were acquired (full k-space acquisition without acceleration); scan duration of 4.2 minutes. The total scan time was 25.2 minutes.
Assessment of Linearity
The T2* map DICOM images were loaded into HOROS to draw circular volumes of interests (VOIs) for each of the 15 mL vials and the mean T2* values were recorded. We then calculated R2* values (R2* = 1/T2*) to assess the linearity of the imaging sequence with respect to iron concentration (see Fig. 1). Raw TWIX files were exported to a server to be reconstructed with an in-house MATLAB (MathWorks, USA) script for the UTE sequence. Image reconstruction and post-processing steps were performed in MATLAB. Non-uniform fast Fourier transform (NUFFT) was used to calculate the forward encoding transform of the acquired k-space data5. A compressed sensing approach was used for image reconstruction, using total generalized variation (TGV) as the sparsifying penalty6. After reconstruction, ultrashort T2* relaxation times were calculated from the 6 ultra-short echoes images. For each VOI a single value of T2* was calculated as follows. The mean intensity within the VOI was evaluated for each image in the series and plotted as a function of TE. T2* was then calculated by fitting the intensity data to a monoexponential decay function using the Levenberg-Marquardt algorithm in MATLAB.
Results
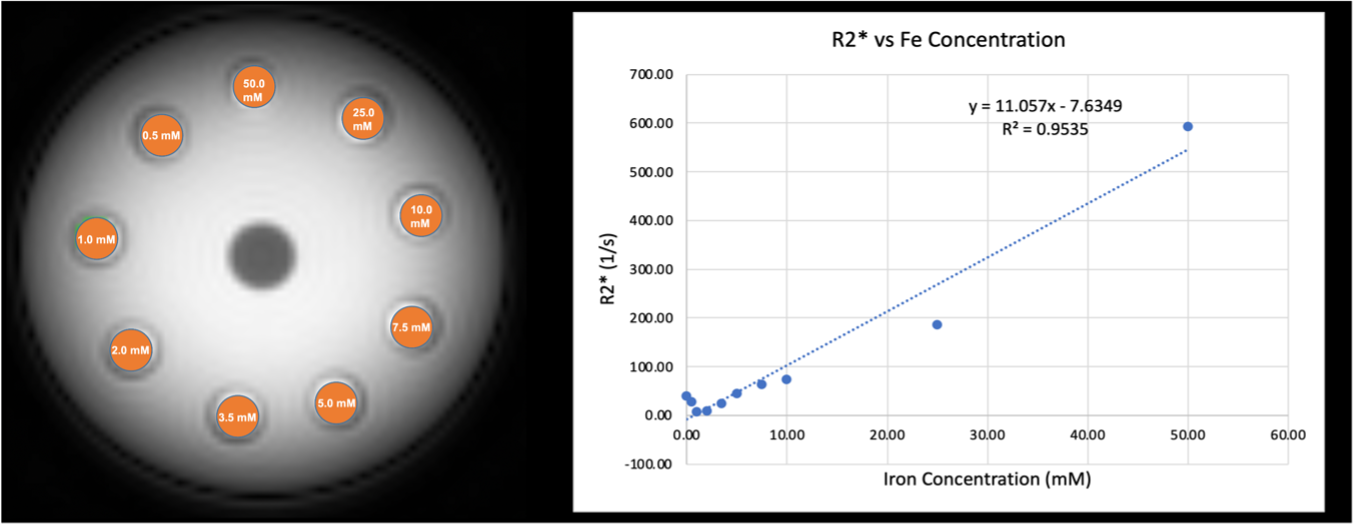
As expected, both the 3D-mGRE and 3D-UTE sequences show a strong linear relationship of R2* and iron concentration (Fig. 2 and Fig. 3). Linear regression of the 3D-mGRE data gave the following relationship: R2*(1/s) = 1.7713x[mM FeCl2] + 11.867; R2 = 0.9906. Linear regression of the 3D-UTE data gave the following relationship: R2*(1/s) = 11.057x[mM FeCl2] – 7.6349; R2 = 0.9535. The calculated R2* values from 3D-mGRE and 3D-UTE sequences differ by approximately a factor of 6, with the highest concentration (50 mM) reporting an R2* value of 100.7 (1/s) and 593.7 (1/s), respectively. This may be caused by some unique features of the 3D-UTE sequence with a rosette k-space pattern. This disparity will be investigated in the future.Discussion and Conclusion
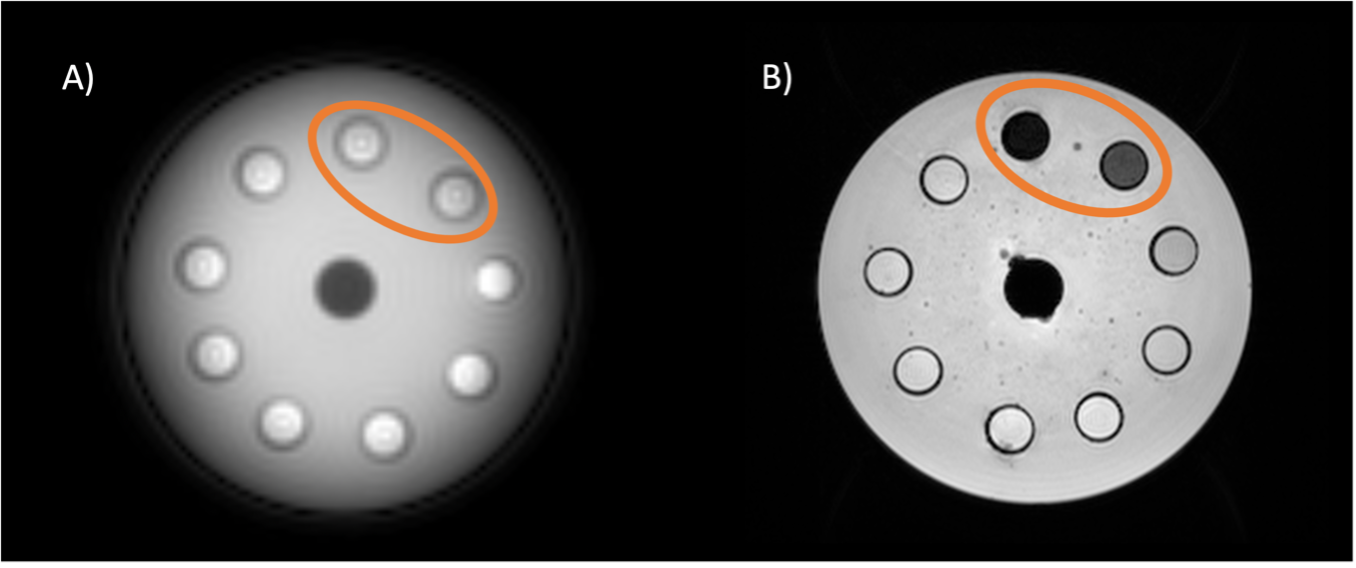
Overall, both imaging sequences show a strong linear relationship between R2* and iron concentrations, with the 3D-UTE sequence showing results closer to expected values for high iron concentrations7 (~5000 [1/s] for 50 mM). The image intensity decays with longer echo times for both sequences (Fig. 3), showing promising results that the 3D-UTE sequence behaves similarly to the conventional 3D-mGRE for iron imaging and quantification. We recognize that the 3D-UTE sequence has a much longer scan time than the conventional 3D-mGRE sequence; however, an acceleration factor of 2-4 can reduce the single dual-echo acquisition to 2.1-1 minutes. Another improvement to be explored is increasing the spatial resolution of the 3D-UTE sequence.Acknowledgements
This study was supported by NIH/NIEHS R01 ES032478.
Data acquisition was supported in part by NIH grant S10 OD012336.
References
1. Damulina A, Pirpamer L, Soellradl M, et al. Cross-sectional and Longitudinal Assessment of Brain Iron Level in Alzheimer Disease Using 3-T MRI. Radiology. 2020;296(3):619-626. doi:10.1148/radiol.2020192541
2. Cheng Q, Huang J, Liang J, et al. Evaluation of abnormal iron distribution in specific regions in the brains of patients with Parkinson’s disease using quantitative susceptibility mapping and R2* mapping. Experimental and Therapeutic Medicine. 2020;19(6):3778-3786. doi:10.3892/etm.2020.8645
3. Krafft AJ, Loeffler RB, Song R, et al. Quantitative ultrashort echo time imaging for assessment of massive iron overload at 1.5 and 3 Tesla. Magn Reson Med. 2017;78(5):1839-1851. doi:10.1002/mrm.26592.
4. Zahneisen B, Grotz T, Lee KJ, Ohlendorf S, Reisert M, Zaitsev M, Hennig J. Three-dimensional MR-encephalography: fast volumetric brain imaging using rosette trajectories. Magn Reson Med 2011;65(5):1260-1268.
5. Fessler JA, Sutton BP. Nonuniform fast Fourier transforms using min-max interpolation. IEEE T Signal Proces 2003;51(2):560-574.
6. Knoll F, Bredies K, Pock T, Stollberger R. Second order total generalized variation (TGV) for MRI. Magn Reson Med 2011;65(2):480-491.
7. Özen, A.C., Atalar, E., Korvink, J.G. et al. In vivo MRI with Concurrent Excitation and Acquisition using Automated Active Analog Cancellation. Sci Rep 8, 10631 (2018). https://doi.org/10.1038/s41598-018-28894-w
Figures