1531
GESSE Measurements at varying spin echo times in human brain at 7T1Physics, University of Nottingham, Nottingham, United Kingdom, 2University of Nottingham, Nottingham, United Kingdom, 3SPMIC, University of Nottingham, Nottingham, United Kingdom
Synopsis
Simultaneous measurements of R2 and R2’ using the Gradient Echo Sampling of a Spin Echo (GESSE) sequence were made at multiple spin echo times in four volunteers. Secondary measurements of R2 and R2* were made using classical Spin Echo and Gradient Echo approaches. The variation in measured relaxation rates are explored and show a general overestimation of transverse relaxation in white and grey matter when measured with GESSE suggesting a lack of complexity in the model used to describe the GESSE signal.
Introduction
The Gradient Echo Sampling of a Spin Echo (GESSE) sequence1-3 allows simultaneous measurement of reversible and irreversible transverse relaxation rates, R2’ and R2. These relaxation rates have different and complex dependences on local tissue microstructure, and in the brain are particularly sensitive to the microstructural distribution of iron and myelin2, which are the main sources of magnetic susceptibility variation. Here, we acquired GESSE measurements at 7T in the brain over a range a spin echo times and explored the variation of the measured R2 and R2’ in different tissue compartments, comparing the results to gradient echo measurements of R2* and spin echo measurements of R2.Method
Figure 1 shows a schematic diagram of the GESSE sequence which produces a series of N gradient echoes and associated images, with the signal at the nth echo given by$$S_n = S_0 \exp(-(TE - (n-N_e)\tau) R_2) \exp(-|n-N_e|\tau R_2^{'})$$
where TE is the spin echo time, Ne is the gradient echo number of the spin echo, τ is the echo spacing.
Multi-slice, GESSE was implemented on a 7T Philips Achieva scanner using the standard Nova Medical 32 channel receiver coil for signal reception. 10 slices with 1.5 mm in-plane resolution, 3 mm slice thickness, 10 mm slice gap, and echo spacing, t = 475 ms, TR = 2s and acquisition time, TAQ = 256s. Sagittal data sets were acquired from four volunteers using six different values of TE (12, 18, 25, 32, 40 and 50 ms), and the maximum number of gradient echoes that could be accommodated with symmetrical sampling of the spin echo (5, 13, 21, 29, 39, 51). Sagittal 3D multi-echo gradient echo data was also acquired with 1.5 mm isotropic resolution, TR = 41 ms, 30 echoes, TE1 = 2.72 ms, DTE=1.27 ms, TAQ = 266s.
Each GESSE data-set was used to form maps of R2 and R2’. This was done by non-linear fitting to Eq. 1 with fit initiation using parameters estimated from linear fits of the logarithmic signal on either side of the spin echo2. The maps of R2 and R2’ where then summed to form maps of R2* for each participant at each TE. A second map of R2* was also generated from voxel wise linear fits of the logarithm of the signal from the GE image to echo time. Similarly, a second map of R2 was formed for each participant by fitting to variation of the log of the amplitude of the spin echo at the centre of each GESSE echo train against TE.
Regions of interest (ROI) in the corpus callosum, cortical grey matter and cerebrospinal fluid (CSF) in each participant were used to investigate the variation in the estimated relaxation rates from the different echo times and methods in different brain tissues/structures.
Results
Figure 2 shows example GESSE image data-sets from one central slice from Subject 2 for the acquisitions with 5, 13 and 21 echoes and TE values of 12, 18 and 25 ms. The reduction in signal with increasing TE across datasets and the refocusing of signal at the central image (corresponding to the spin echo) is evident.Figure 3 shows single slice R2 and R2’ maps which were generated from the GESSE data acquired from Subject 3 with TE = 18, 32 and 50 ms. Figure 4 shows the corresponding R2 map calculated from the six spin echo images and the R2* map generated from the gradient echo data.
Figure 5 shows the variation in the calculated values of R2, R2’ and R2* from the GESSE fits for each TE in the different ROIs. Averages across the 4 participants are plotted, with the standard deviation between participants shown in the error bars. The continuous horizontal lines show the average values of R2 and R2* calculated from the six, SE amplitudes and the GE sequence, respectively. Dashed horizontal lines are plotted at one standard deviation from the average.
Discussion
GESSE data with 1.5 x 1.5 x 3 mm3 voxel size can be generated with good signal to noise ratio in a 4.25 minute acquisition (Figure 2). The R2 maps generated by fitting to the GESSE data appear visually comparable at different echo times (Figure 3) and similar to the maps generated from the six spin echo images (Figure 4). The contrast in R2’ maps is dominated by the effect of veins (Figure 3), which also affect the appearance of the R2* maps (Figure 4). The plots of the average relaxation rates in the CSF calculated from the GESSE data, show large errors indicating the range of gradient echo times is not large enough to characterise the long transverse relaxation times in this compartment for most of the TE values. For the grey matter and white matter ROIs, the R2 values estimated from the GESSE data exceed those calculated from the spin echo data, leading to overestimates of R2* from the combination of R2 and R2’ compared to the values measured using the GE sequence. This may reflect limitations in the simple model of signal behaviour described by Eq. [1]3.Acknowledgements
No acknowledgement found.References
1) 1) Yablonskiy, DA and Haacke, EM. An MRI method for measuring T-2 in the presence of static and RF magnetic field inhomogeneities. June 1997 | MAGNETIC RESONANCE IN MEDICINE 37 (6) , pp.872-876
2) Cox EF, Gowland PA. Simultaneous Quantification of T-2 and T-2 ' Using a Combined Gradient Echo-Spin Echo Sequence at Ultrahigh Field. Magnetic Resonance in Medicine. 2010;64(5):1441-6.
3) Balasubramanian M, Polimeni JR, Mulkern RV. In vivo measurements of irreversible and reversible transverse relaxation rates in human basal ganglia at 7 T: making inferences about the microscopic and mesoscopic structure of iron and calcification deposits. Nmr in Biomedicine. 2019;32(11).
Figures
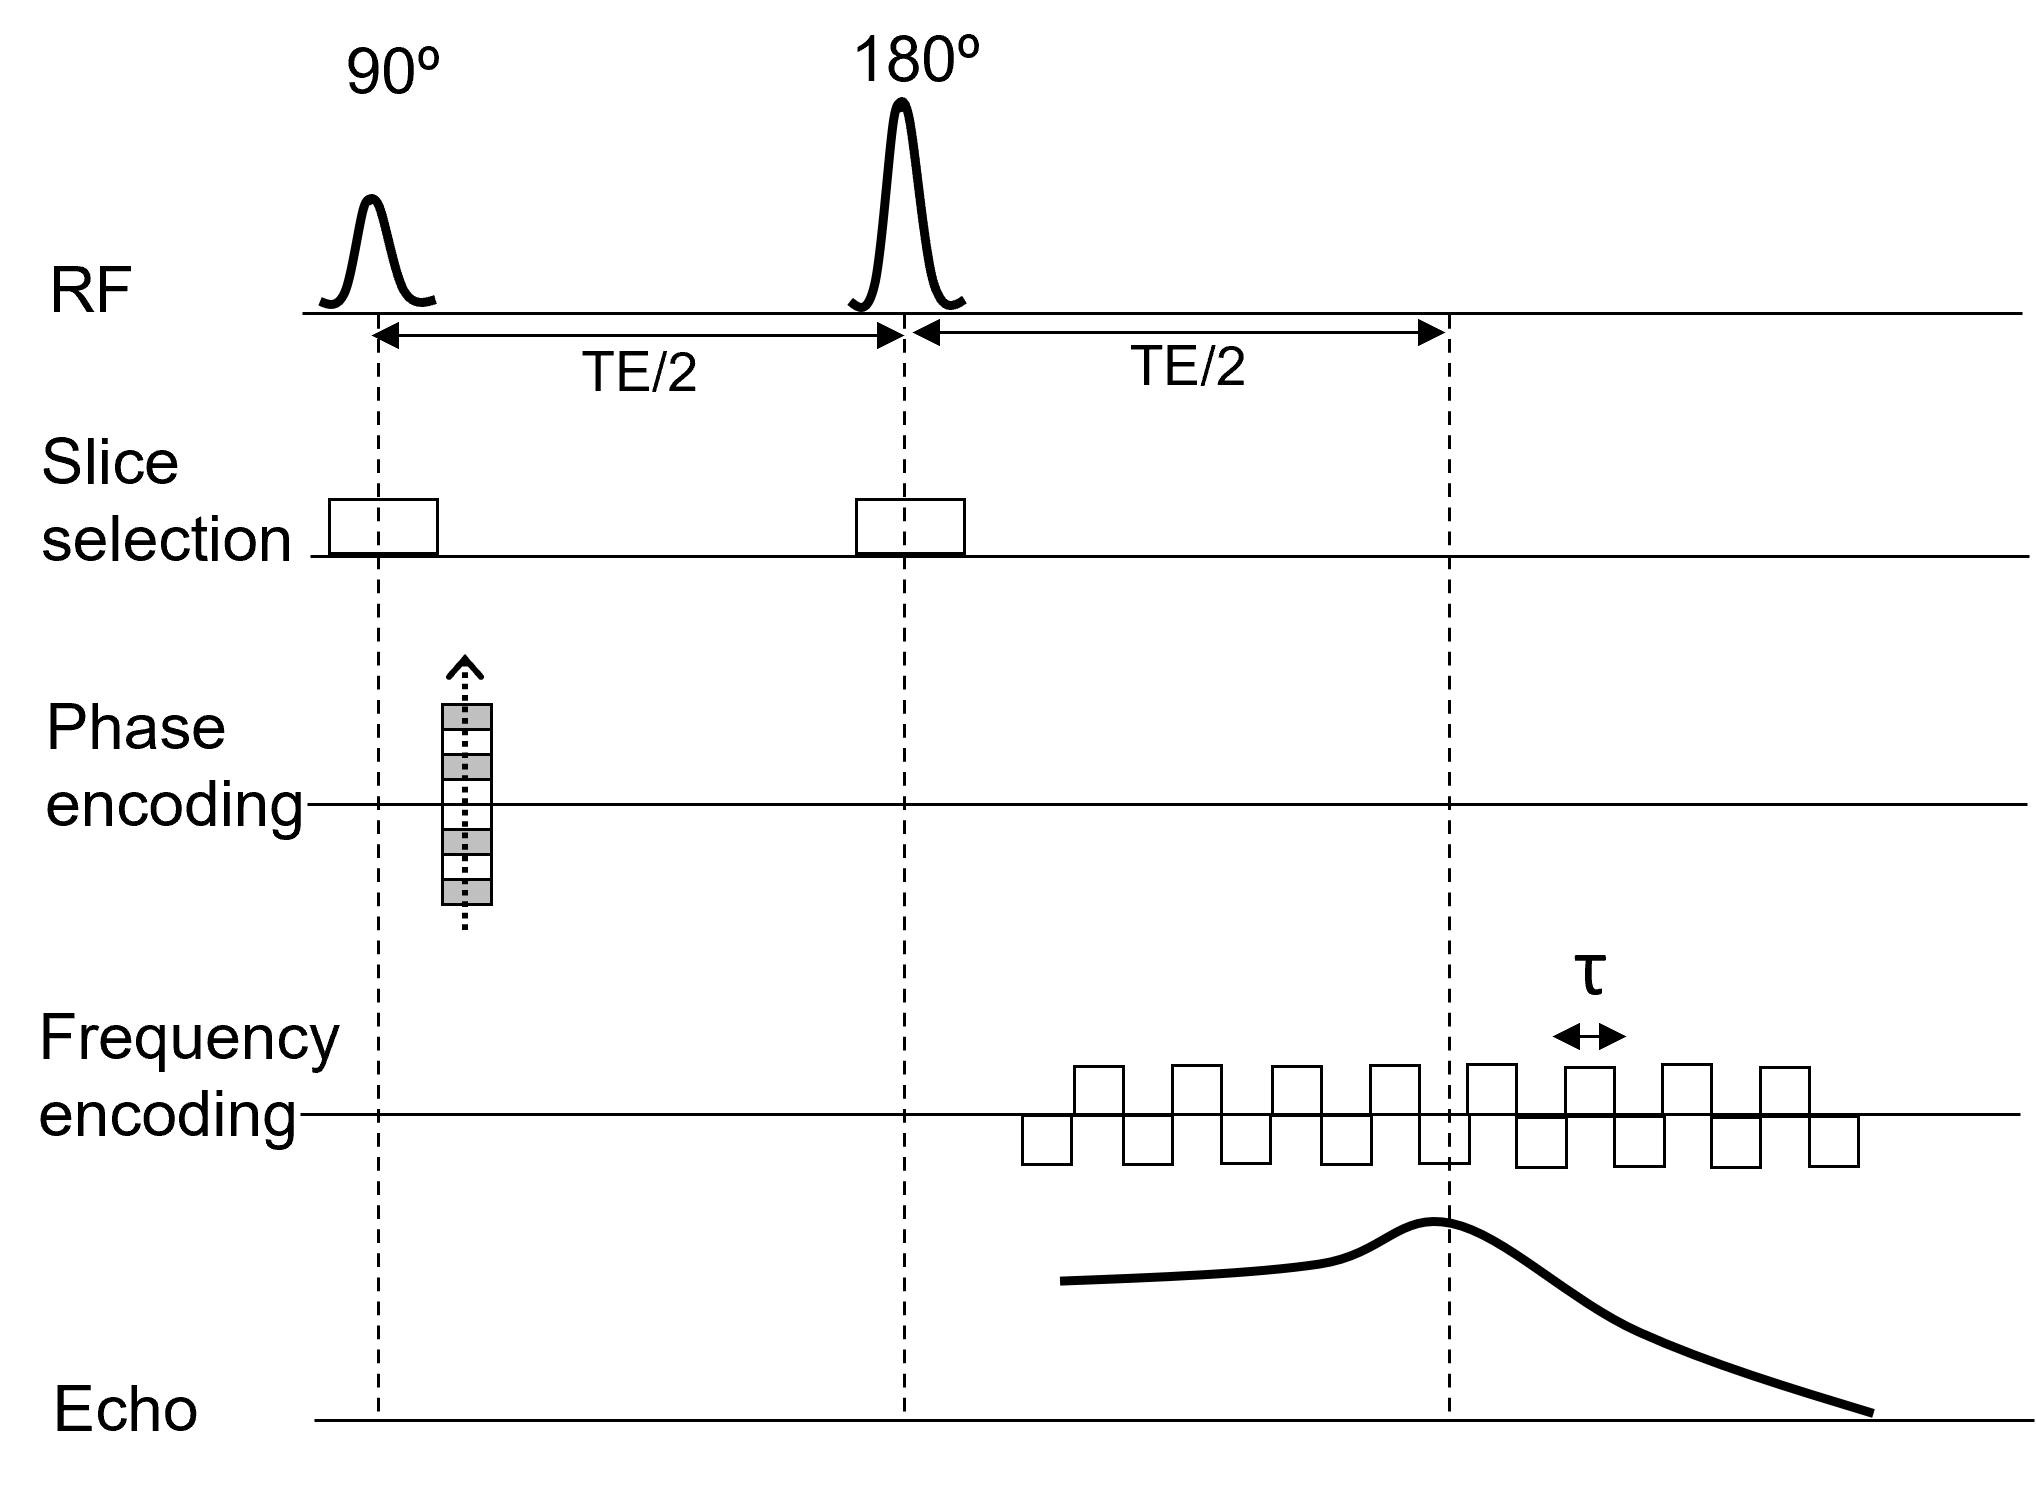
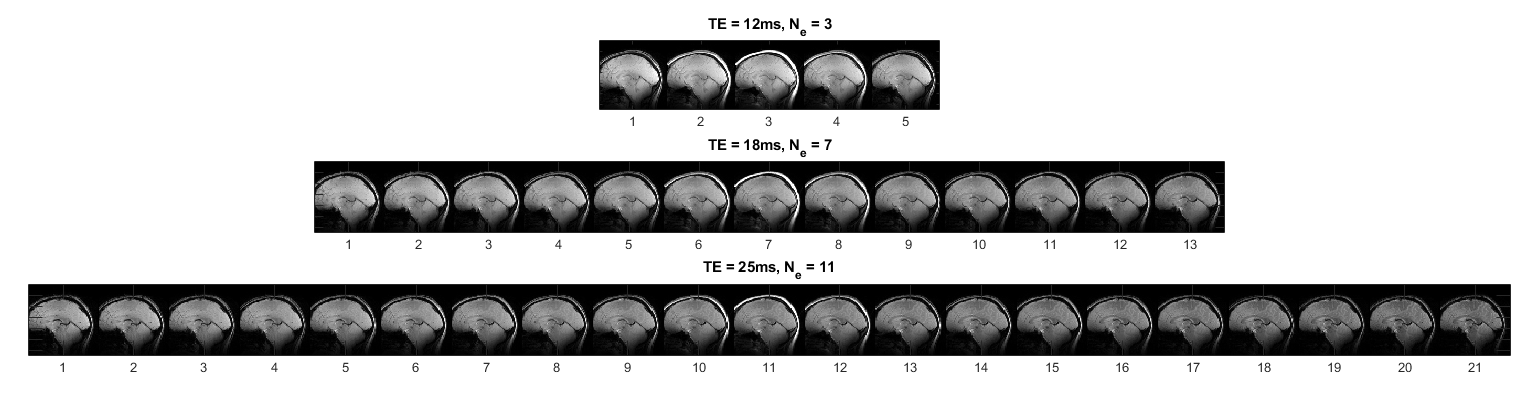
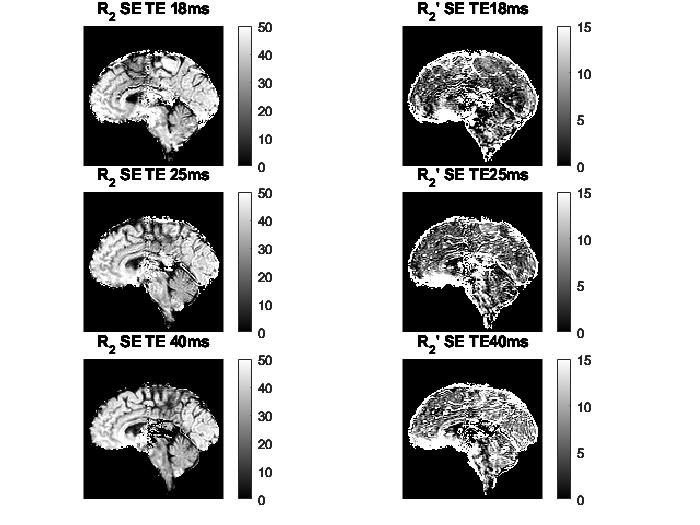
Figure 3: R2 and R2’ maps of the 6th slice for participant 3 evaluated from the GESSE sequences for three acquisitions with the given spin echo TE. All values shown in ms-1.
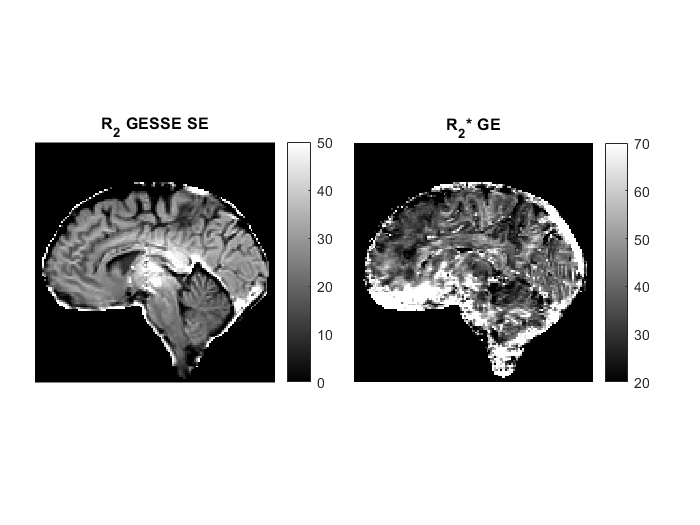
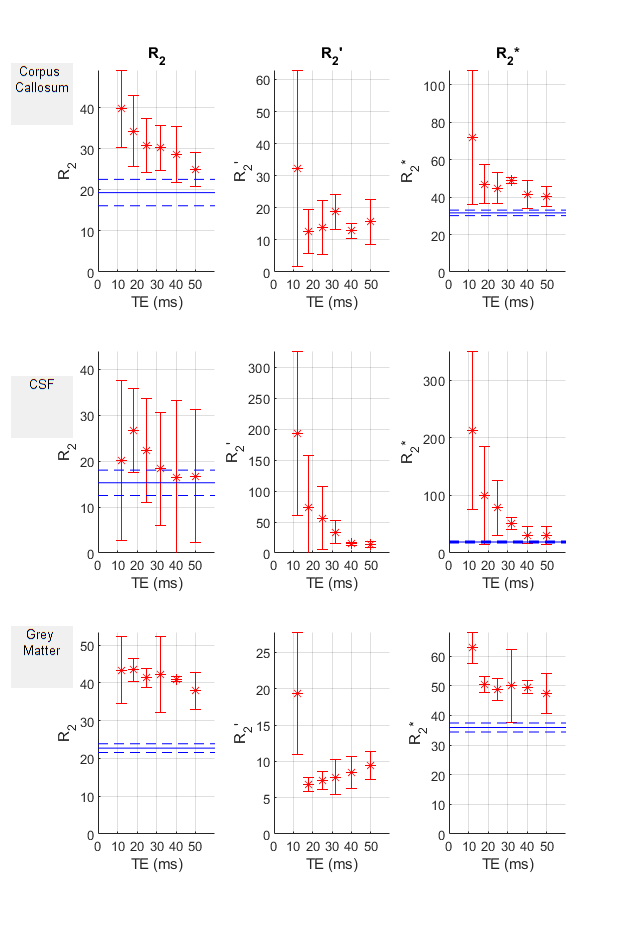
Figure 5: Plots of the fitted GESSE R2, R2’ and R2* at each TE averaged across participants in three regions of the brain with the standard deviation across participants shown in the error bars (red *). The solid lines show the MESE R2 fit to the GESE and GE R2* fits in their respective plots in the given region averaged across participants (blue -). The dashed lines show ± half of the standard deviation across participants (blue --). All values shown in ms-1.