1529
Simplified fast multislice T1app mapping for improved cerebral blood flow arterial spin labeling MRI1Athinoula A. Martinos Center for Biomedical Imaging, Massachusetts General Hospital, Harvard Medical School, Boston, MA, United States, 2Department of Radiology and Imaging Sciences, Emory University School of Medicine, Atlanta, GA, United States
Synopsis
Given the association between MT and longitudinal relaxation rate (1/T1), we hypothesized that T1app, under RF saturation, can be estimated from T1 to improve CBF quantification. Using Wistar rats, we showed that the T1app over T1 ratiometric map (i.e., T1app/T1) is homogeneous despite large regional variation in T1 and T1app maps. Therefore, we postulated that T1app map could be estimated from the routine T1 map instead of T1app, which is cumbersome and not straightforward. A fast T1app estimation provides satisfactory Cerebral blood flow (CBF) measurement across the brain, not affected by the concomitant MT effect.
Introduction
CBF is an informative tissue hemodynamic index and has been increasingly used in imaging neurological disorders such as acute stroke and tumor1, 2. However, ASL CBF imaging is not straightforward3. Specifically, accurate CBF mapping requires the measurement of corresponding T1app (the apparent T1 under the saturation of the ASL tagging pulse), which varies with both amplitude and offset of the RF tagging pulse4. Recently, we introduced a fast multi-slice T1app mapping for improved ASL measurement5. We further discovered that the routine T1 (without tagging pulse) and T1app (with tagging pulse) are highly associated. Building on this observation, we proposed to estimate T1app based on T1 measurement, corrected for the amplitude and offset of RF tagging pulse. Our in vivo results showed that the proposed method provides fast and accurate CBF measurement, consistent with that obtained with T1app measurement, and advantageous over that using a single T1app approximation.Methods
In vivo data acquisition:All experiments were conducted on a 4.7T Bruker MRI scanner. We used multi-slice single-shot echo-planar imaging (EPI, 2 mm/slice for five slices) with a field of view (FOV) of 20 x 20 mm2 (matrix = 48 x 48). T1 images were acquired using inversion recovery MRI, with seven inversion delays ranging from 250 ms to 2750 ms. T1app-weighted images were acquired with 5 s RF irradiation before the excitation pulse, using the same recovery time as T1 MRI. Single-slice T1app and T1 images were acquired to assess the B1 dependence of T1app (slice thickness = 3mm). We varied the B1 amplitude from 2.35, 3.53, 4.7, 5.88 to 7.05 μT; for each amplitude, we varied the offset from 6, 8, 10, 12 to 14 kHz in five rats (n=5). We measured AM-ASL MRI (repetition time (TR)/TE=6500ms/28ms, NA=32, time of saturation (TS)=3000 ms, n=5)6. We used B1=4.7 μT, a labeling distance of 15 mm (Δω=10,000 Hz), the modulation frequency of 250 Hz, and post-labeling duration of 300 ms, as suggested by Utting et al.7.
Data processing and analysis:
Images were analyzed in Matlab (Mathworks, Natick, MA). T1 and T1app maps were calculated by the least-squares fitting of the signal intensities as functions of the inversion time ($$$I=I_{0}[1-\beta e^{-\tau_{inv}/T_{1}}]$$$and$$$I=I_{ss}[1-\beta e^{-\tau_{inv}/T_{1app}}]$$$) per pixel, in which $$$\tau_{inv}$$$ is the inversion time. CBF was calculated as5,8
$$CBF=\frac{\lambda \cdot (I_{ref}-I_{tag})\cdot \exp(\delta /T_{1b})}{2\cdot \alpha\cdot T_{1app}\cdot I_{0}\cdot [1-\exp(-\tau/T_{1app})]} (1)$$ where λ is the brain/blood partition coefficient, α is the degree of inversion, Iref and Itag are image intensities when RF labeling and reference pulses are applied, respectively, and I0 is the control image without RF irradiation.
We further postulated that T1app could be estimated from routine T1 map without tagging RF pulse (i.e., T1app= η·T1, where η is the scaling factor), and that CBF can be calculated as$$CBF'=\frac{\lambda \cdot (I_{ref}-I_{tag})\cdot \exp(\delta /T_{1b})}{2\cdot \alpha\cdot (\eta \cdot T_{1})\cdot I_{0}\cdot [1-\exp(-\tau/T_{1app})]} (2)$$
Results
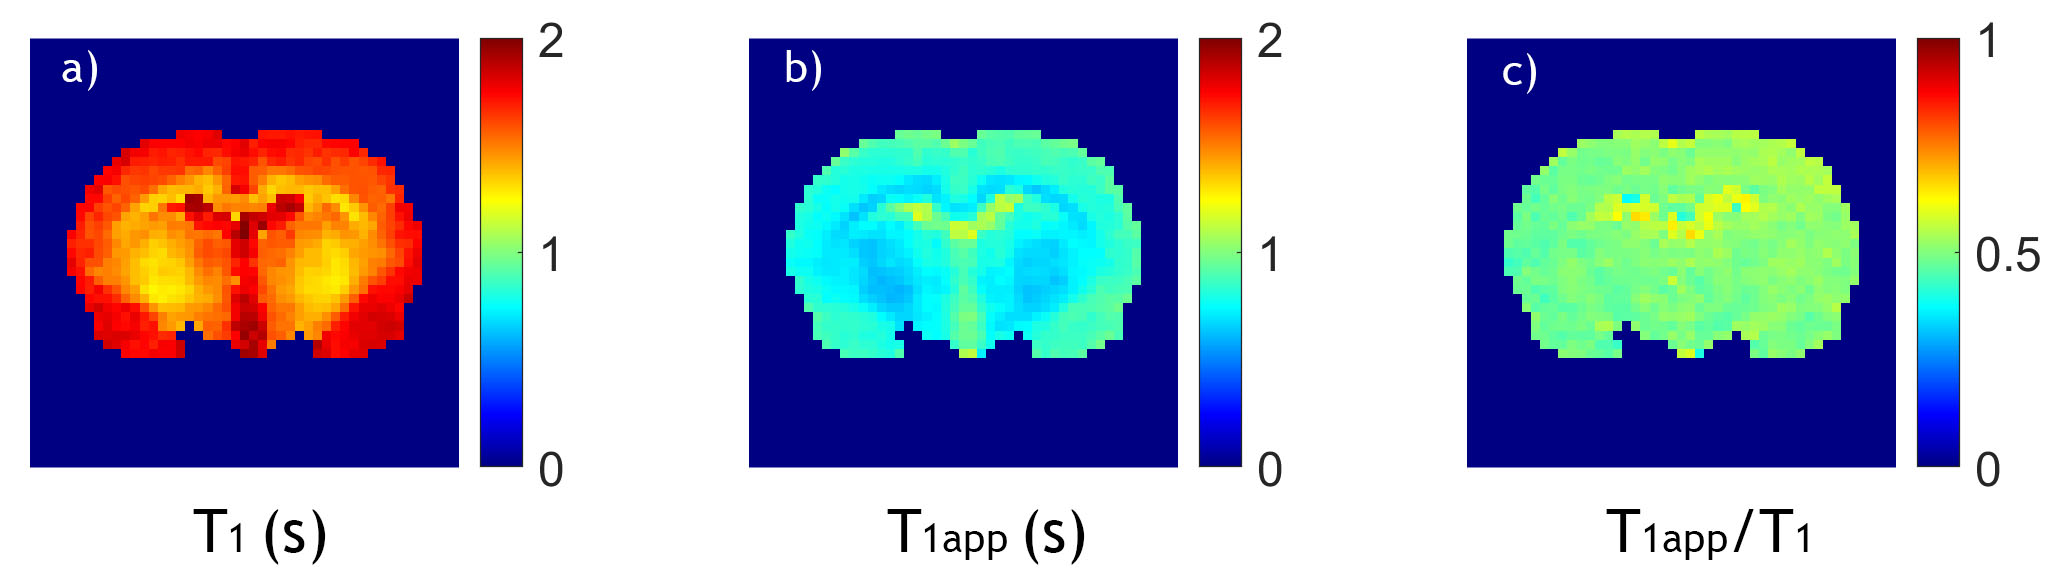
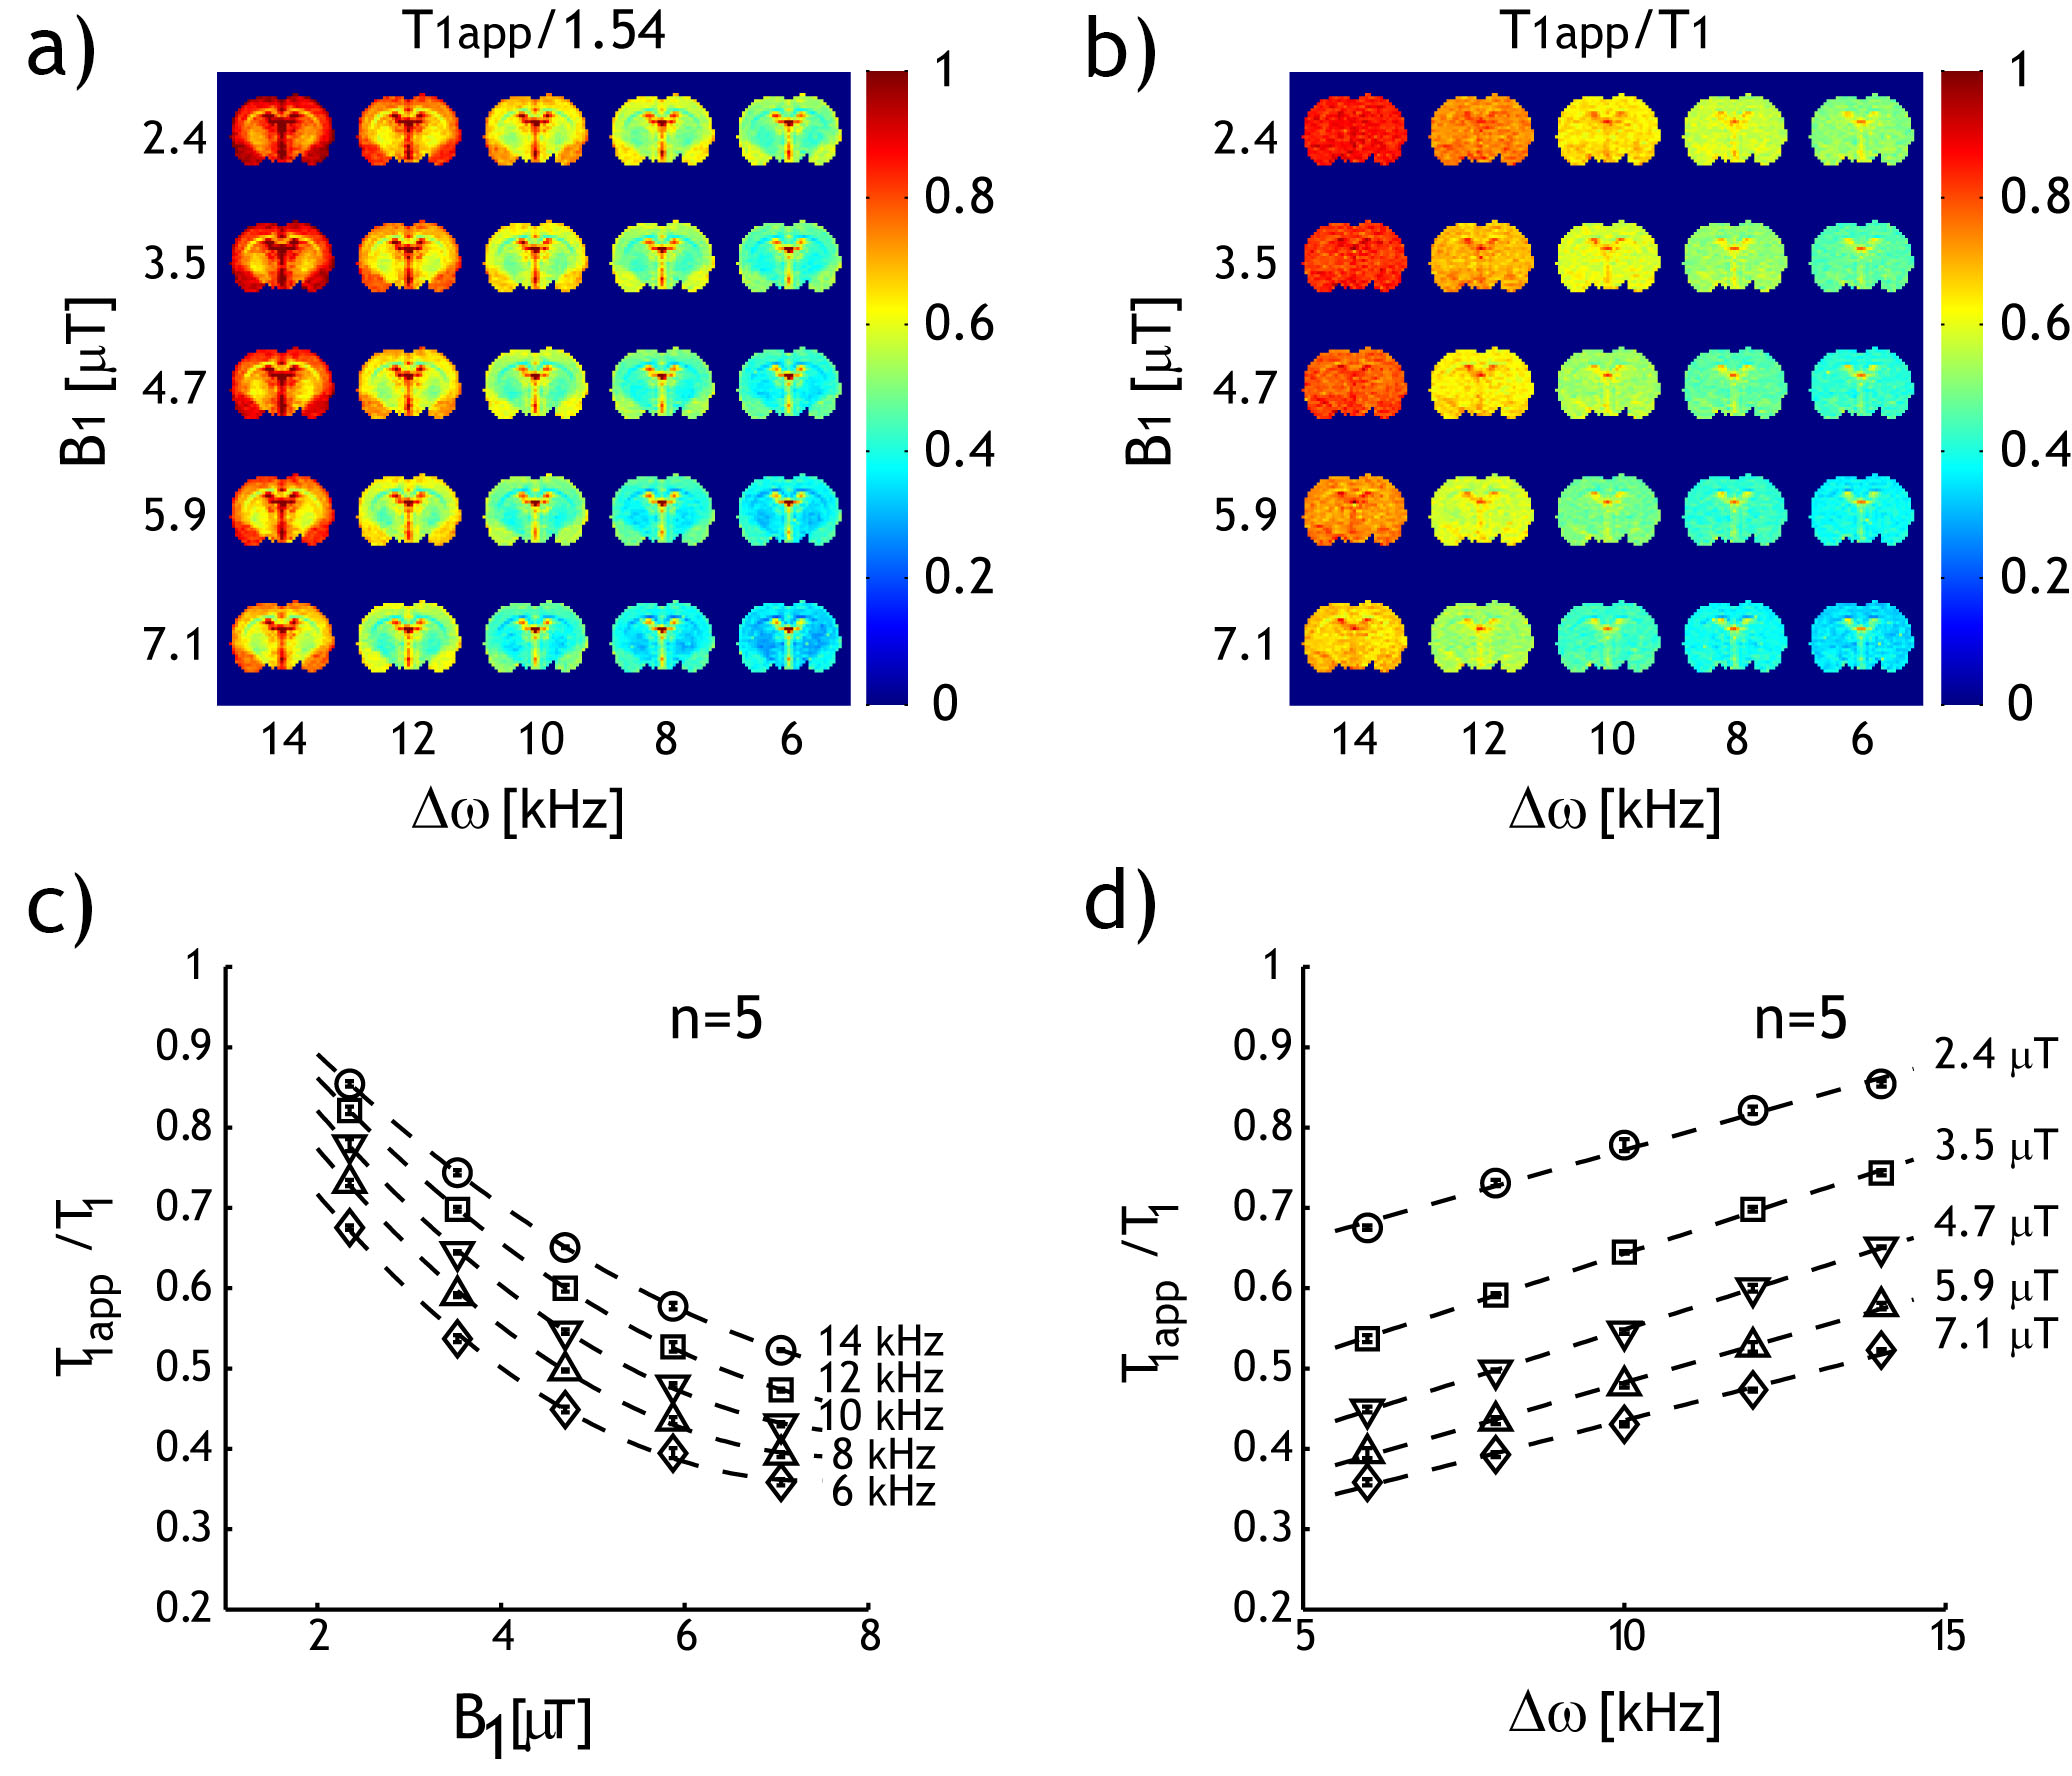
Fig. 1 shows single-slice T1, T1app, and the ratiometric T1app/T1 maps of a representative rat. The slice was positioned 2 mm posterior from Bregma. Both T1 (Fig. 1a) and T1app (Fig. 1 b) maps were heterogeneous.Fig. 2a shows a T1app map normalized by 1.54 s (the mean T1 value for all brain regions except the CSF); the regional variation significantly decreased due to T1 normalization (Fig. 2b). The dependence of the ratiometric correction factor (i.e., η=T1app /T1) on RF amplitude and offset can be reasonably described by linear regression. Fig. 2c shows that T1app /T1 decreased with B1 amplitude and increased with RF offset (Fig. 2d). Such dependencies show that T1app strongly depends on experimental parameters.
Fig. 3 compares the single-slice CBF maps calculated from the T1app map, single T1app value (0.83 s), and the approximate T1app estimated from T1 map (η=0.54), respectively, with an overlaid scatter plot. CBF was 1.60 ± 0.80 ml/g.min as calculated with Eq. 1, using an experimentally measured single-slice T1app map (Fig. 3a). In comparison, CBF', calculated from a single T1app value, and approximated T1app from T1 map, were 1.39 ± 0.73 and 1.58 ± 0.81 ml/g∙min, respectively.
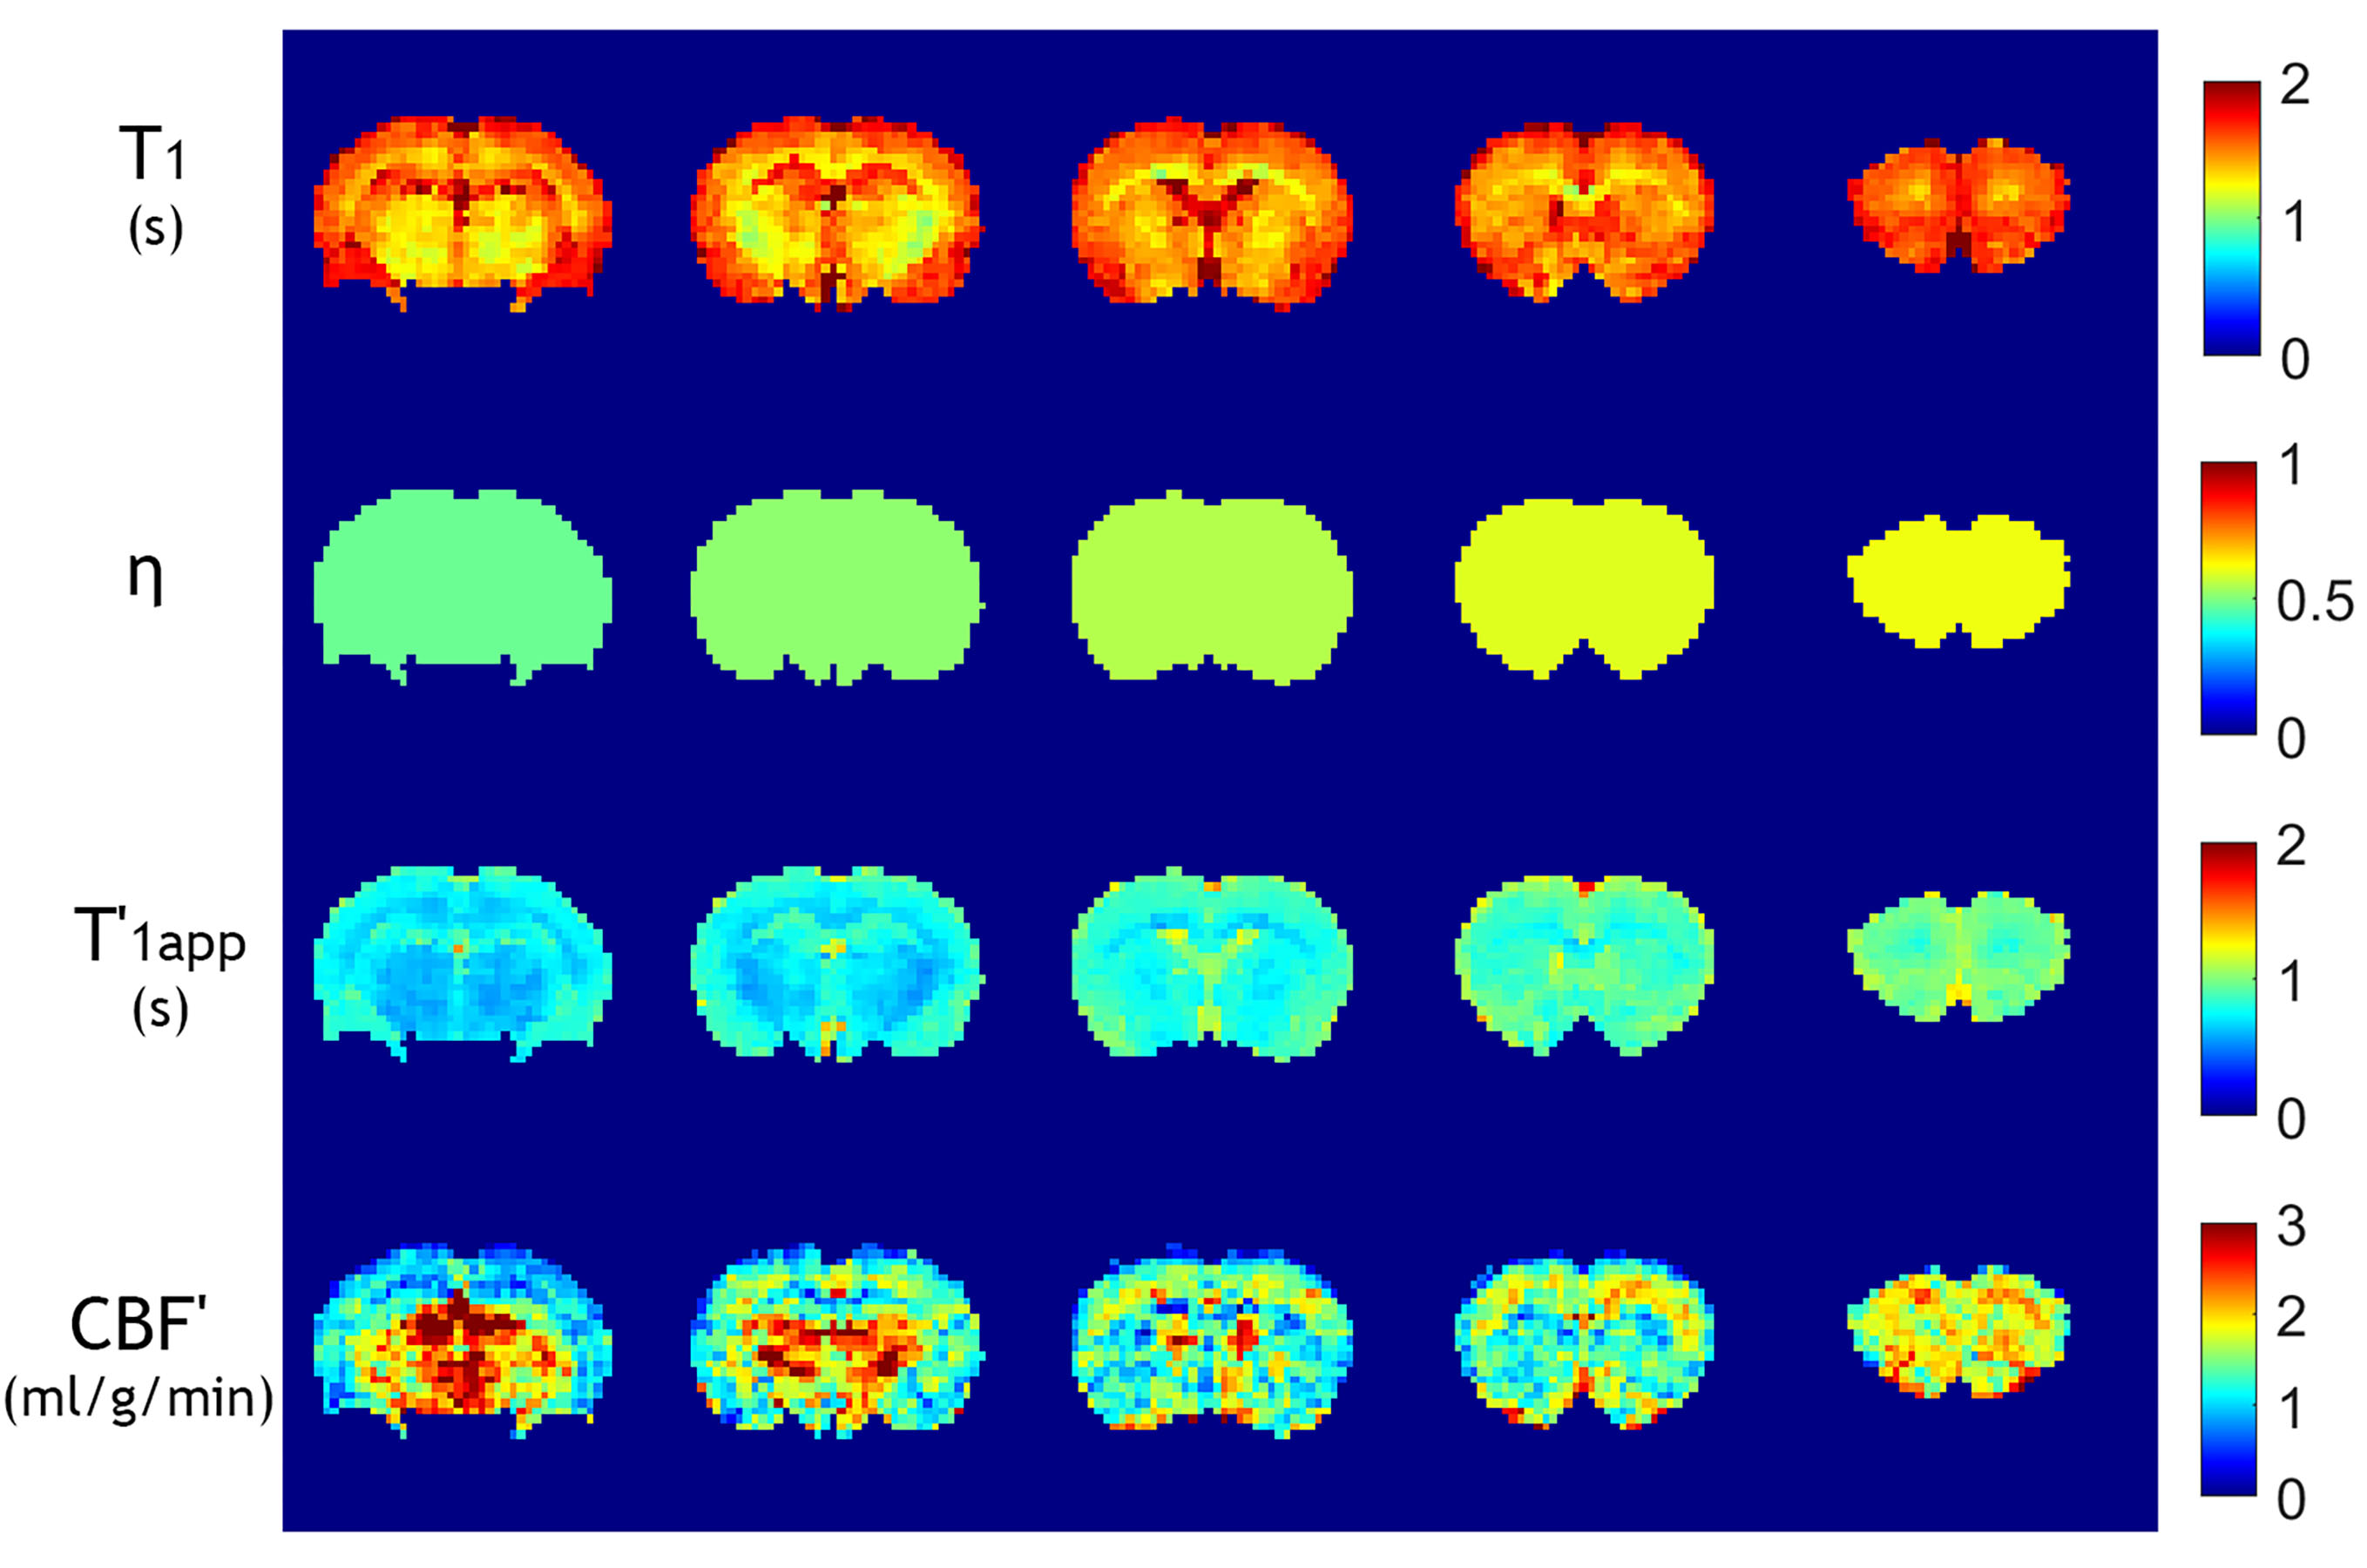
Fig. 4 shows the multi-slice parametric T1 map and correction coefficient (η) map calculated from Fig. 2d, the estimated multi-slice T'1app map and CBF' map of a representative rat. Multi-slice T1 maps were derived by considering the echo time and EPI acquisition time to calculate the effective inversion time. For multi-slice AM-ASL MRI, the T1app/T1 map must be calculated per slice due to different effective offsets during RF tagging, based on B1 amplitude, gradient strength, and slice position.
Discussion and Conclusion
Our study showed that the ratiometric T1app/T1 map was reasonably homogeneous within the slice, and the parametric T1app maps can be derived from experimentally measured T1 maps. We further demonstrated that estimated T1app normalized AM-ASL MRI provides improved CBF quantification than those using a single global T1app value, promising for studying neurological disorders including stroke and tumor.Acknowledgements
This study was supported in part by NIH 2R01NS083654.References
1. Wintermark M, Sesay M, Barbier E, Borbely K, Dillon WP, Eastwood JD, Glenn TC, Grandin CB, Pedraza S, Soustiel J-F, Nariai T, Zaharchuk G, Caille J-M, Dousset V, Yonas H. Comparative Overview of Brain Perfusion Imaging Techniques. Stroke 2005;36(9):e83-99.
2. Parsons MW, Christensen S, McElduff P, Levi CR, Butcher KS, De Silva DA, Ebinger M, Barber PA, Bladin C, Donnan GA, Davis SM. Pretreatment diffusion- and perfusion-MR lesion volumes have a crucial influence on clinical response to stroke thrombolysis. J Cereb Blood Flow Metab 2010;30(6):1214-1225. 3. Ewing JR, Cao Y, Knight RA, Fenstermacher JD. Arterial spin labeling: Validity testing and comparison studies. J Magn Reson Imag 2005;22(6):737-740.
4. Measurement of brain perfusion by volume-localized NMR spectroscopy using inversion of arterial water spins: Accounting for transit time and cross-relaxation. Magn Reson Med. 1992;25:362-371.
5. Ji Y, Lu D, Jiang Y, Wang X, Meng Y, Sun PZ. Development of fast multi- slice apparent T(1) mapping for improved arterial spin labeling MRI measurement of cerebral blood flow. Magn Reson Med. 2021;85:1571- 1580.
6. Alsop DC, Detre JA. Multisection cerebral blood flow MR imaging with continuous arterial spin labeling. Radiology. 1998;208:410-416.
7. Utting JF, Thomas DL, Gadian DG, Helliar RW, Lythgoe MF, Ordidge RJ. Understanding and optimizing the amplitude modulated control for multiple-slice continuous arterial spin labeling. Magn Reson Med. 2005;54:594-604. 8. Alsop DC, Detre JA. Reduced Transit-Time Sensitivity in Noninvasive Magnetic Resonance Imaging of Human Cerebral Blood Flow. J Cereb Blood Flow Metab 1996;16(6):1236-1249.
Figures