1527
MRI-based liver vascular morphology and surface nodularity quantification for assessment of portal hypertension1Ruijin Hospital, Shanghai Jiaotong University School of Medicine, Shanghai, China, 2Human Phenome Institute, Fudan University, Shanghai, China
Synopsis
Hepatic venous pressure gradient (HVPG) measurement is the standard technique of assessing portal pressure. Portal hypertension is mainly caused by increased intrahepatic resistance to portal blood flow related to structural changes, including fibrosis and vascular distortion. Here, we used dynamic contrast-enhancement (DCE) MRI to quantify segmented liver contours and vascular morphology in evaluating portal pressure. Our study showed the MRI measurements correlated well with HVPG measurement. A non-invasive prediction model combining liver vascular morphology and liver surface nodularity (LSN) can potentially be used to assess clinically significant portal hypertension (CSPH).
Introduction
The increase of portal pressure above the threshold of clinically significant portal hypertension (CSPH, hepatic venous pressure gradient [HVPG] ≥10 mmHg) is a landmark in the natural history of cirrhosis. Patients with CSPH are at risk of developing esophageal varices and clinical decompensation (variceal bleeding, ascites, jaundice, encephalopathy), and higher mortality1. The development of non-invasive markers of portal pressure is highly desirable2.Portal hypertension is mainly caused by increased intrahepatic resistance to portal blood flow related to structural changes, including liver fibrosis and vascular distortion. MRI may provide detailed liver vascular anatomy associated with portal hypertension, including portal vein, hepatic vein and inferior venous vein. Based on these results, we propose that by combing liver margin irregularities and vascular morphology quantification may further improve ability of noninvasive diagnosis of portal hypertension.Thus, the goal of our study was to evaluate the diagnostic performance of the quantification of liver vascular morphology and LSN from MRI images for the diagnosis of CSPH, defined by using HVPG measurement, in patients with cirrhosis.Methods
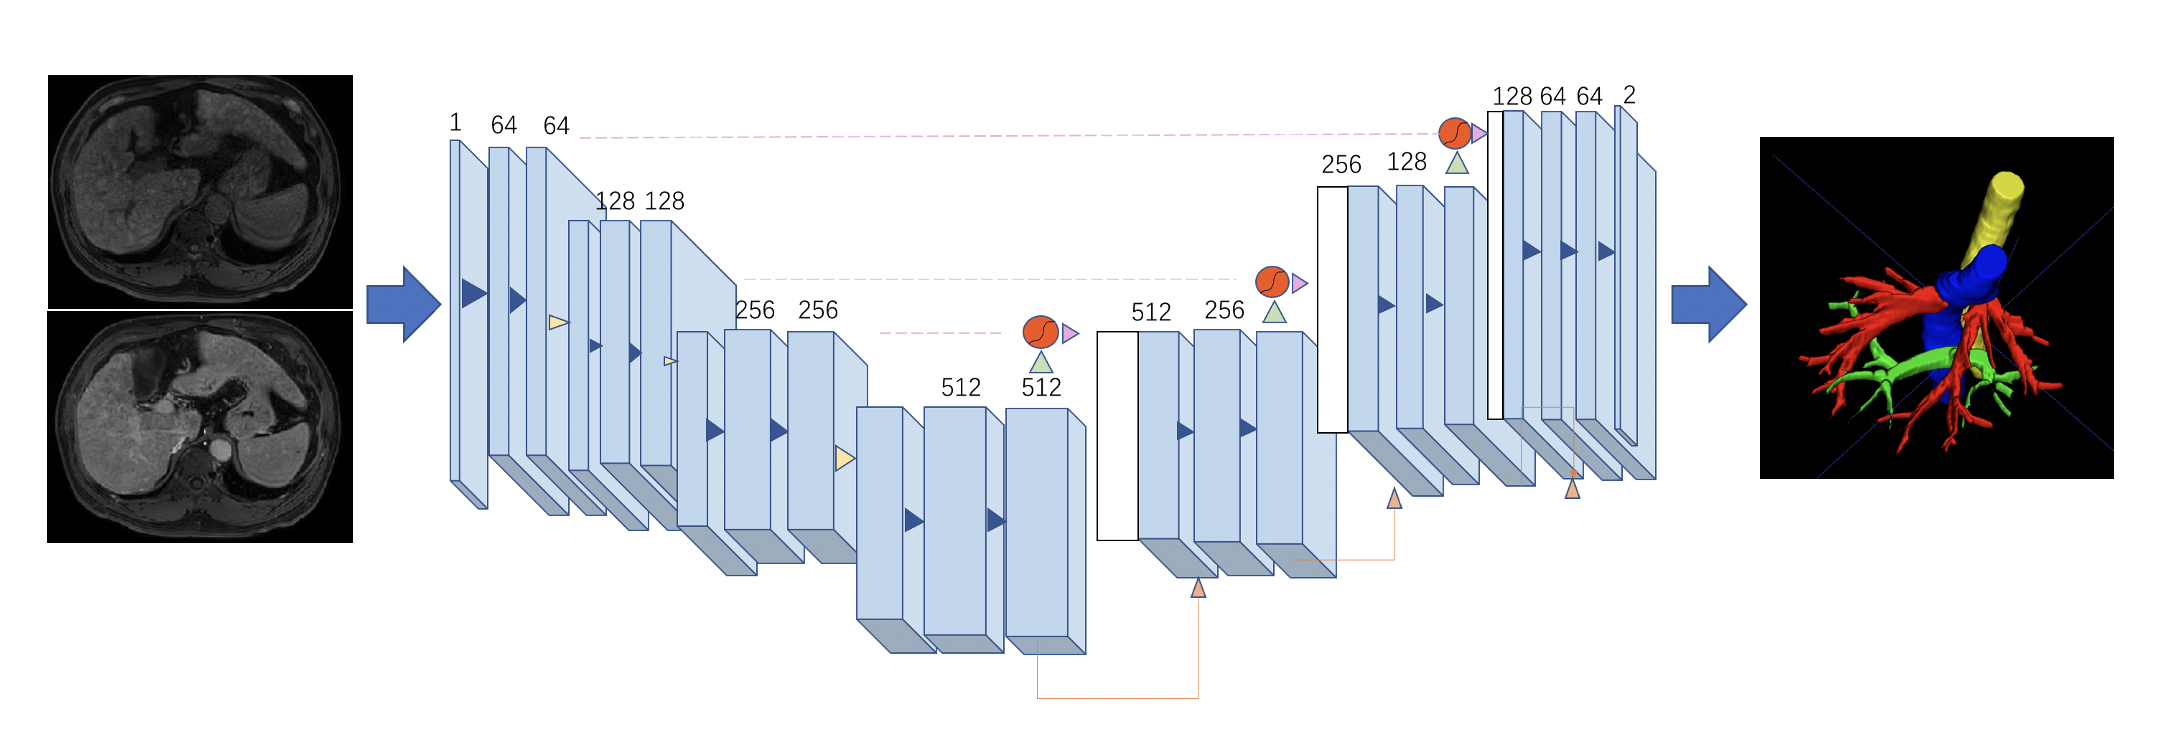
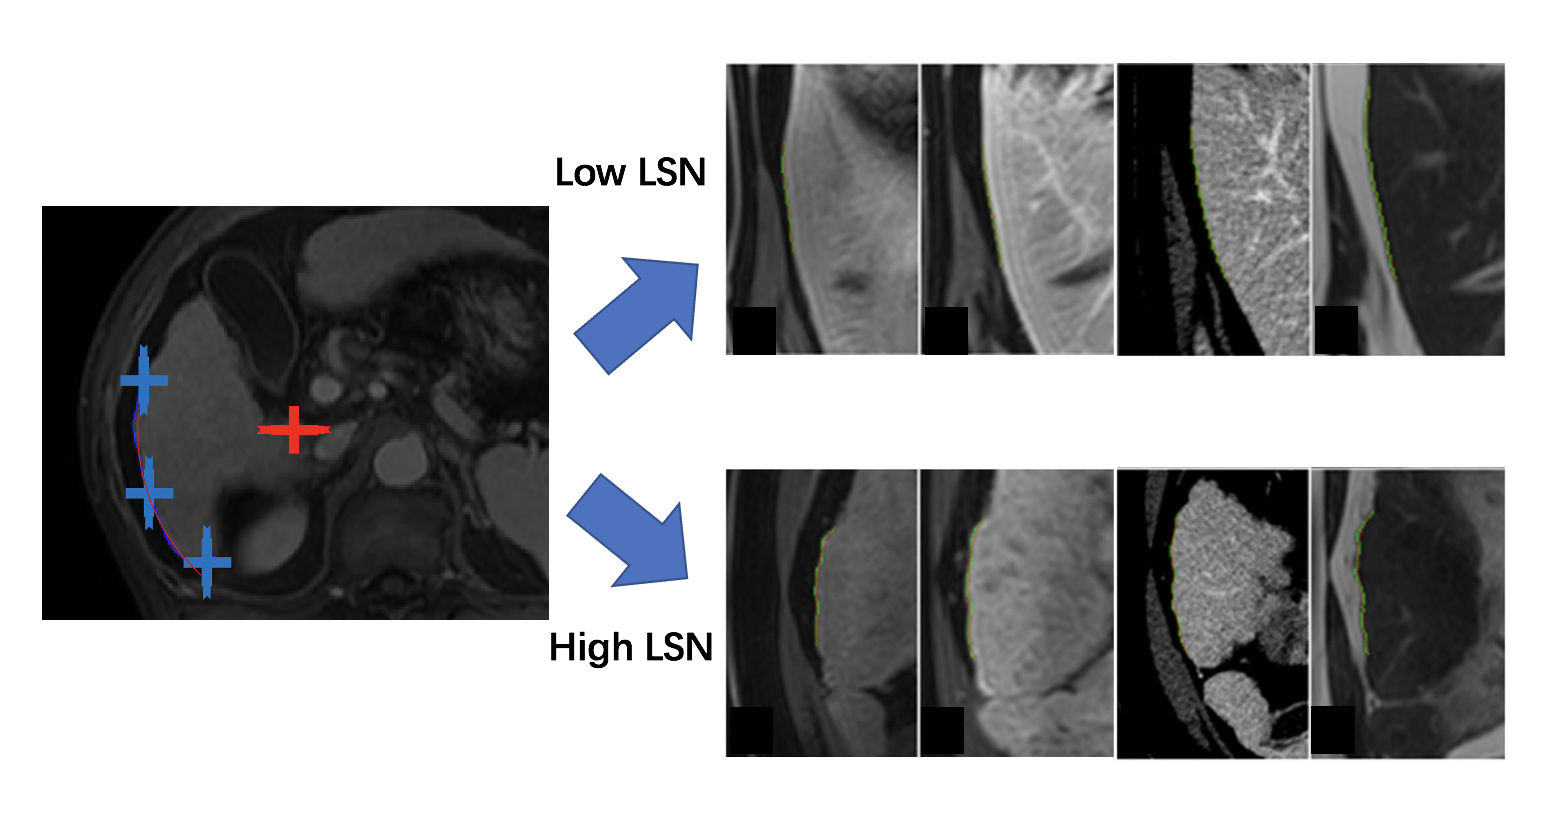
This retrospective study included 31 patients with PH in cirrhosis who underwent DCE-MRI and HVPG measurements, and 16 age-sex-matched healthy controls who underwent DCE-MRI. MRI were obtained with either a 1.5-T or a 3.0-T MR system (Aera, Siemens; Ingenia, Philips Medical Systems; uMR 660, UIH) with the same protocol including T1WI, T2WI, DWI, and DCE with arterial, venous, and delayed phase. Portal veins (PV), hepatic veins (HV), hepatic artery (HA) and inferior vena cava (IVC) were automatically extracted from the delayed phase DCE images by an attention based convolutional neural network (CNN). The vascular tree was further amended by a radiologist with 5 years of experiences. The 3-D centerlines were extracted in each component with a decision tree-based approach without user-defined parameters. The root nodes were automatically selected as the main entrance of PV, HV and HA. A total of 64 vascular morphological parameters, including vascular volume, vascular fraction, average diameter, length, curvature, tortuosity, length of main branch, length of main branches, number of nodes, number of branches, roundness and branch angle were calculated for further analysis. The liver contour was segmented automatically by using a pre-trained convolutional neural network (CNN). The edge was divided into 8 sections according to the Couinaud segmentation definition. An attention based multi-label CNN was used for automatic Couinaud segmentation. The distance between the liver edge and a smoothed polynomial line is defined as the liver surface nodularity (LSN). LSN was quantified in each segments as well as in the whole liver. Vascular morphological parameters of PV, HV, IVC and LSN were quantified and correlated with HVPG using spearman correlation analysis. The performance of logistic regression model was analyzed using receiver operating characteristic (ROC) curve for diagnosis of clinically significant PH (CSPH, HVPG ≥10 mm Hg). The correlation of vascular morphological parameters of PV, HV, IVC and LSN with HVPG was determined using Spearman correlation analysis. Stepwise logistic regression and multiple logistic regression were employed to establish predicative model for diagnosis of CSPH. Area-under-the-curve (AUC) analysis was performed to assess the diagnostic performance of the DCE-MRI parameters for assessment of CSPH.Results
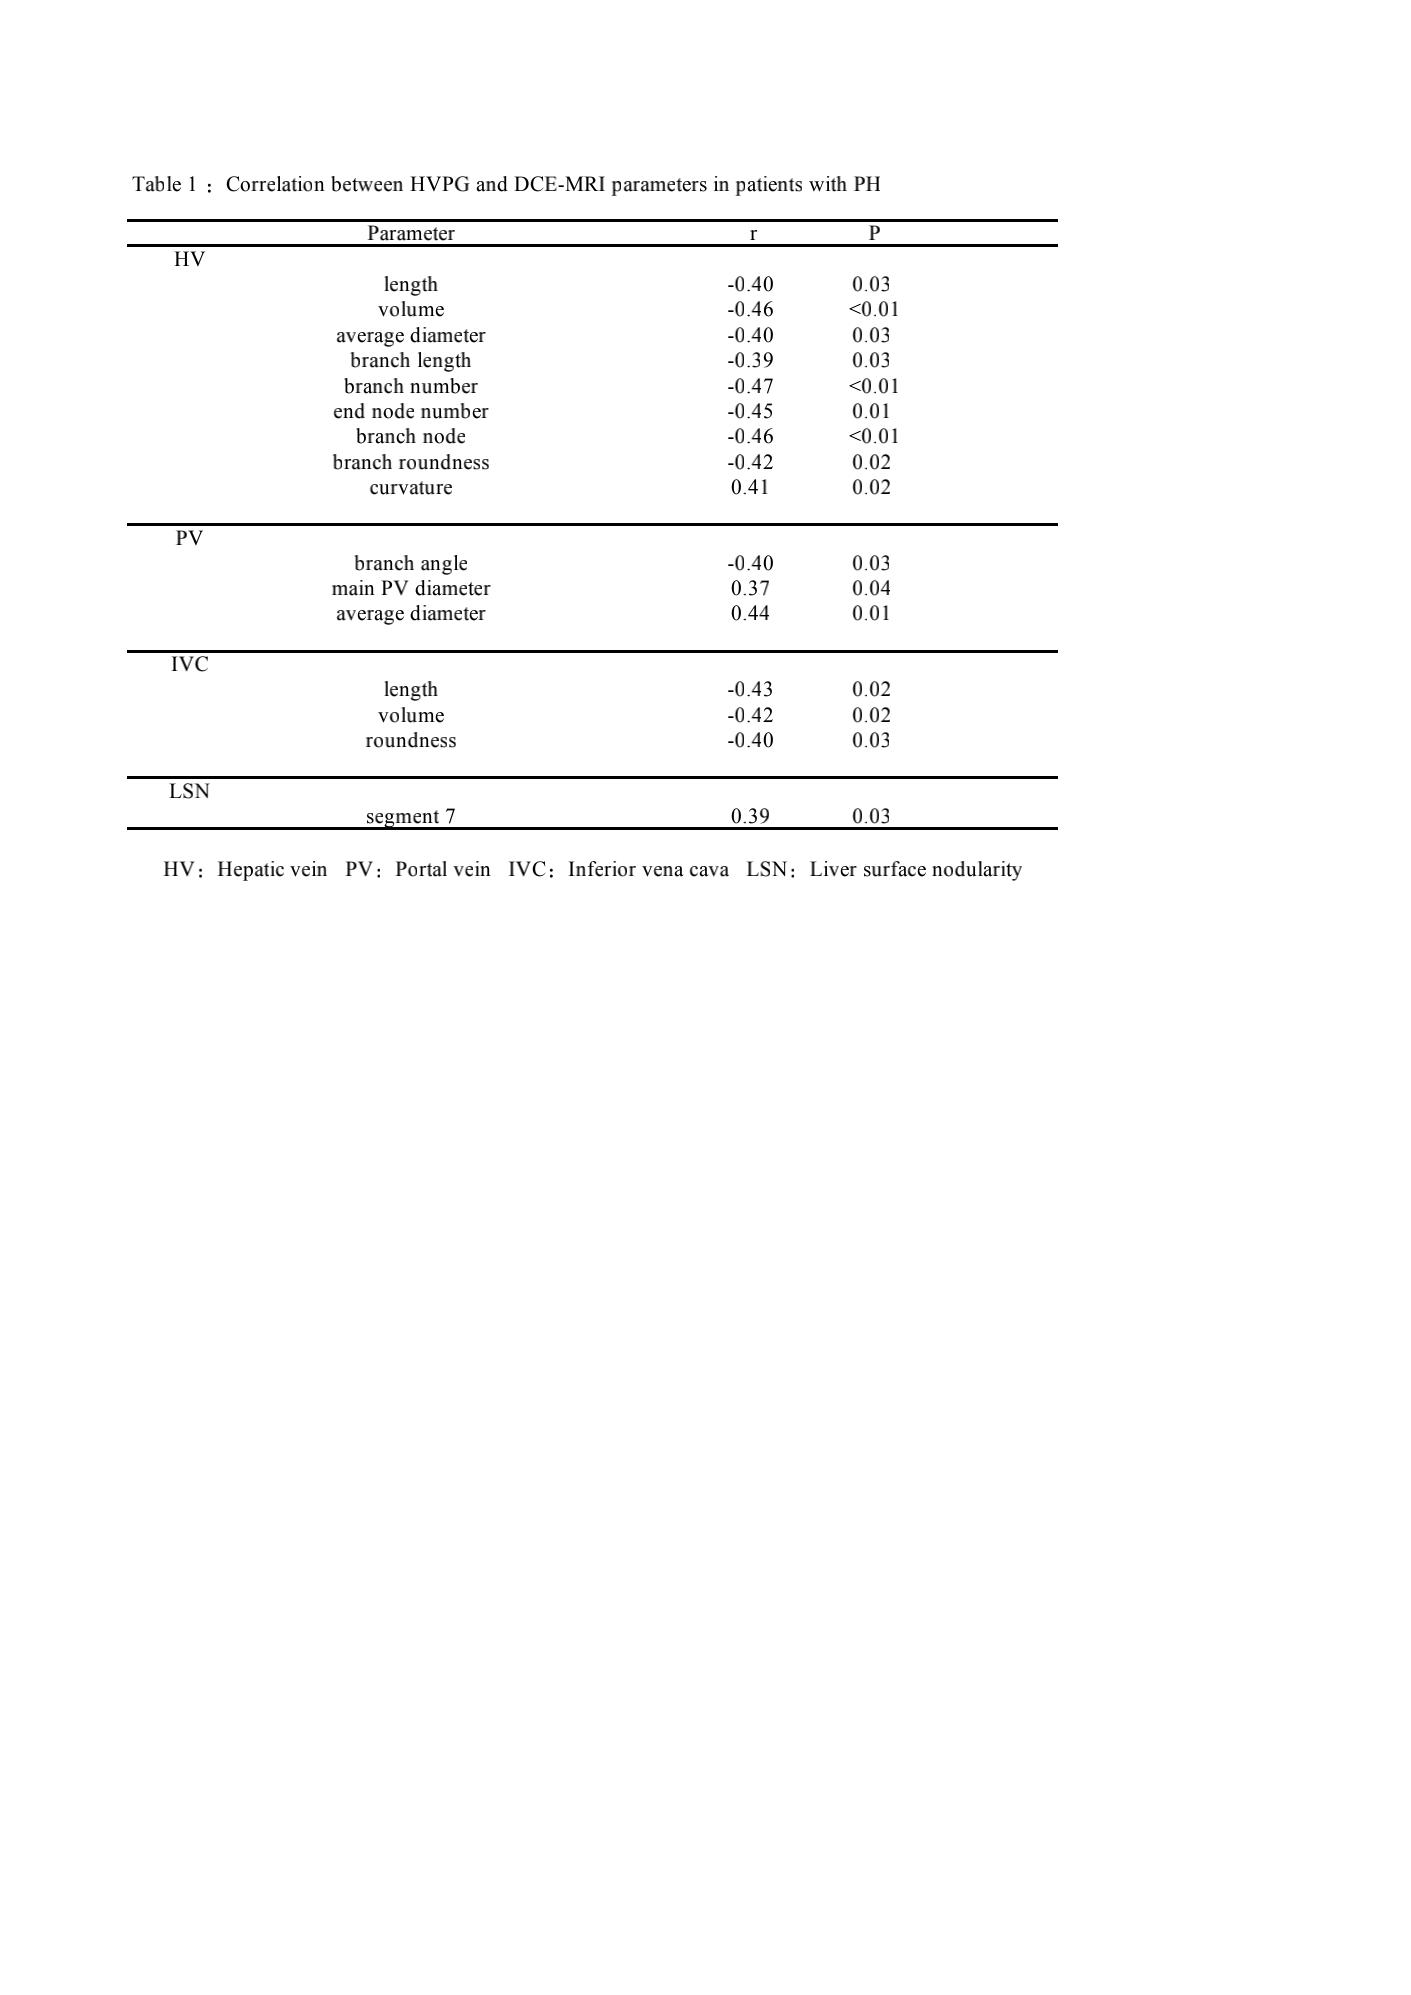
In the hepatic vein, HVPG significantly negatively correlated with HV length(r=-0.40,p=0.03),volume(r=-0.46,p<0.01), average diameter(r=-0.40,p=0.03), branch length(r=-0.39,p=0.03), branch roundness(r=-0.42,p=0.02), branch number(r=-0.47,p<0.01), end node number(r=-0.45,p=0.01), and branch node(r=-0.46,p<0.01). In the portal vein and inferior vena cava, HVPG significantly negatively correlated with the first branch angle of PV (r=-0.40,p=0.03), IVC roundness (r=-0.40,p=0.03), length (r=-0.43,p=0.02), and volume (r=0.42,p=0.02). In addition, HVPG was positively correlated with the diameter of the main portal vein(r=0.37,p=0.04), the average diameter of PV(r=0.44,p=.01), HV curvature (r=0.41,p=0.02), and LSN of segment 7 (r=0.39,p=0.03). At multivariate analysis, HV volume, PV average diameter and LSN of segment 1 were independent factors for CSPH (p <0.05). The combing model demonstrated a sensitivity of 91.3% of, specificity of 83.3%, accuracy of 82.3% of, and AUC of 0.906.Discussion and Conclusion
In this study, we evaluated the parameters extracted by DCE-MRI for the noninvasive assessment of CSPH. We found that HVPG significantly correlated with some of the topological parameters of the liver. Compared with the single-factor diagnosis of CSPH, the topology model combined with hepatic vein volume, portal vein vessel average diameter, and S1 segment liver surface nodularity had better performance in the diagnosis of CSPH.These results were consistent with the anatomical features in the process of liver cirrhosis and portal hypertension.In the process of cirrhosis and portal hypertension, the structure and morphological characteristics of hepatic blood vessels had corresponding changes, and these changes further aggravated the progress of portal hypertension. This finding provides further evidence for the importance of biomechanical properties in imaging-based CSPH detection, diagnosis and early clinical interventions.Our research has several limitations. First, the sample size in this retrospective study is relatively small, and there may be deviations in the results, which need to be further confirmed in future studies. Second, there is a variable time interval difference between HVPG measurement and MRI scan. However, HVPG does not change in a short period of time in clinically stable patients. Finally, we did not assess the presence of gastroesophageal varices with gastroscopy.Acknowledgements
No acknowledgement found.References
1. D’Amico G, Garcia-Tsao G, Pagliaro L. Natural history and prognostic indicators of survival in cirrhosis: A systematic review of 118 studies. J Hepatol 2006;44(1):217–231.
2. Groszmann RJ, Wongcharatrawee S. The hepatic venous pressure gradient: Anything worth doing should be done right. Hepatology 2004;39(2):280–282.
3. Augustin S, Millán L, González A, et al. Detection of early portal hypertension with routine data and liver stiffness in patients with asymptomatic liver disease: a prospective study. J Hepatol. 2014;60(3):561-569.
4. Palaniyappan N, Cox E, Bradley C, et al. Non-invasive assessment of portal hypertension using quantitative magnetic resonance imaging. J Hepatol. 2016;65(6):1131-1139.
5. Sartoris R, Rautou PE, Elkrief L,et al. Quantification of Liver Surface Nodularity at CT: Utility for Detection of Portal Hypertension. Radiology. 2018;289(3):698-707.
6. Smith AD, Zand KA, Florez E, et al. Liver Surface Nodularity Score Allows Prediction of Cirrhosis Decompensation and Death. Radiology. 2017;283(3):711-722.
Figures