1526
Iron, myelin and cortical brain ageing: investigating correlations between QSM, R2, R2* and R2'1Institute of Neuroscience and Medicine INM-4, Research Centre Juelich, Juelich, Germany, 2Department of Neurology, RWTH Aachen University, Aachen, Germany, 3Faculty of Medicine, JARA, RWTH Aachen University, Aachen, Germany, 4Institute of Neuroscience and Medicine 11, INM-11, JARA, Research Centre Juelich, Juelich, Germany
Synopsis
Understanding MR contrast/relaxation in vivo based on myelin and iron content is an on-going endeavour. We study the age dependence and correlation of QSM, R2, R2’ and R2* in vivo with whole brain coverage, investigating whether the interplay between demyelination and iron increases explains changes in these four qMRI parameters. The observations suggest that age-related influences proceed mostly by the intra-cellular iron effect on QSM and demyelination effect on R2.
Introduction
Myelin disruption is an important factor contributing to age-related loss of brain plasticity and repair responses. Ageing also affects iron content in specific brain areas1. Both factors influence transverse relaxation rates and magnetic susceptibility values, but differently. Investigating correlations between iron measured invasively, or inferred from values obtained postmortem1, and MR relaxation rates, has a long history in MRI2. The correlations are high in regions where iron content (ferritin) is high3 and very variable otherwise4,5. Modelling MR contrast based on element concentration appears possible in specific regions in fixed tissue18, but not completely relevant to in vivo contrast, since the relaxation properties of fixed brains are a. very different from those in vivo, in magnitude as well as regional contrast; b. given that myelin and iron do not change with fixation, greatly influenced by other factors which cause these dramatic changes; and c. practically not influenced by diffusion (~5 times reduced in fixed tissue), which is a factor mediating in vivo transverse relaxation. Thus, deriving MR contrast/relaxation in vivo based on myelin and iron content is still an on-going endeavour. Here, we study the age dependence and correlation of QSM, R2, R2’ and R2* in vivo with whole brain coverage, investigating whether the interplay between demyelination and iron increases explains changes in these four qMRI parameters.Materials and Methods
Data on 26 volunteers spanning 7 decades as uniformly as possible (27 to 80 yo, mean age 53±16 years, male/female 19/7) and representing healthy aging were selected for analysis from the 1000BRAINS cohort6. Exclusion criteria were: pathological structure changes visible on MPRAGE or FLAIR (except age-related changes); medication intake; a history of central nervous system diseases; hypertension and diabetes. Details of the acquisition, based on 4 multi-echo GREs are reported in7,8. Here, only QSM and R2* values averaged from two GRE scans (TR=50ms, 7 and 40deg, 18 echoes) are used. A 3-echo TSE acquisition was used for R2 mapping, with acquisition parameters including TR=14000ms, TE1-3=8.2ms, 49ms, 91ms, BW=620Hz/px, turbo factor 9, a=140o, matrix 168x192, 1x1mm2 in plane resolution, 93 slices with 1mm thickness, 50% gap, TA=4min:13s. R2 and R2* were fit by a monoexponential function using arlo17. The R2 values obtained with this sequence can differ considerably from the true values10, and thus were corrected with a simple B1-independent factor11 of 1.6, chosen to match known R2 values measured with multi-echo spin echo at 3T12. Susceptibility mapping was performed using MEDI+013 with default parameters14. The reversible transverse relaxation rate R2' was calculated as R2’=R2*-R2. Brain parcellation was done with Freesurfer using the MPRAGE anatomical scan of the 1000Brains imaging protocol6 and ROI masks were registered to the quantitative maps using ANTs. Mean values, age dependence and correlations between the quantitative parameters were calculated for each ROI using Python (statsmodels and Pingouin packages).Results
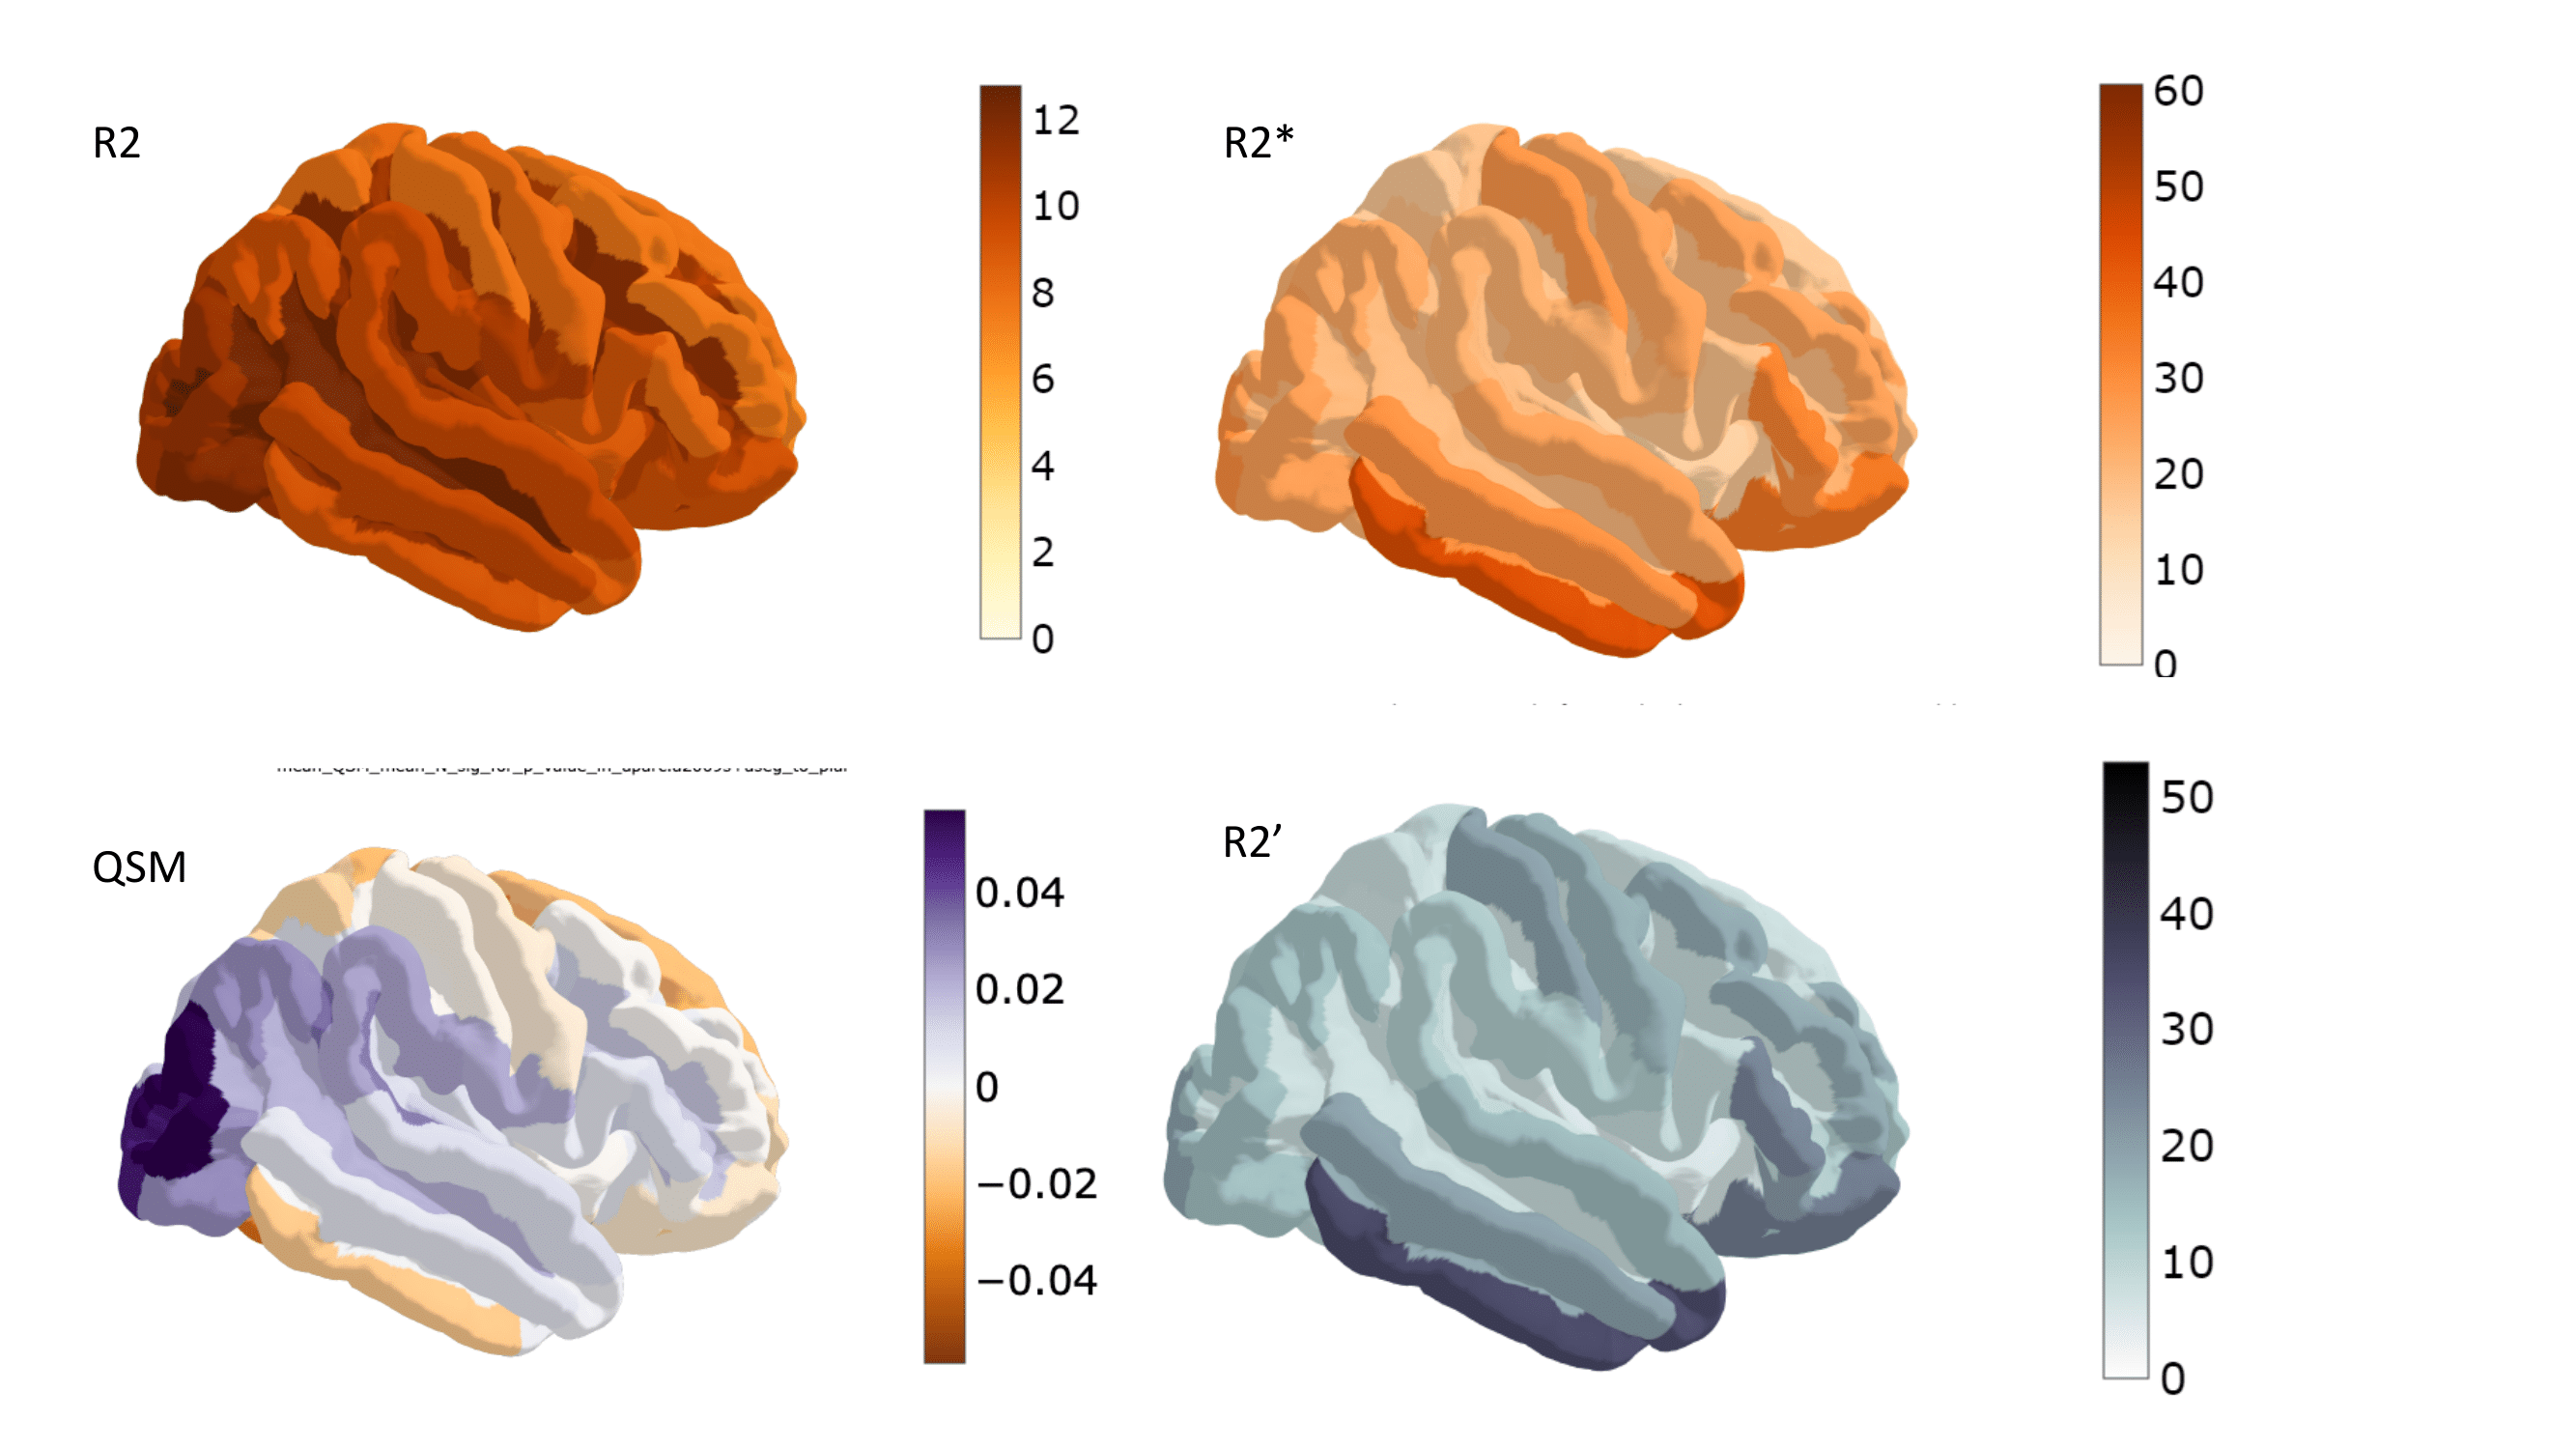
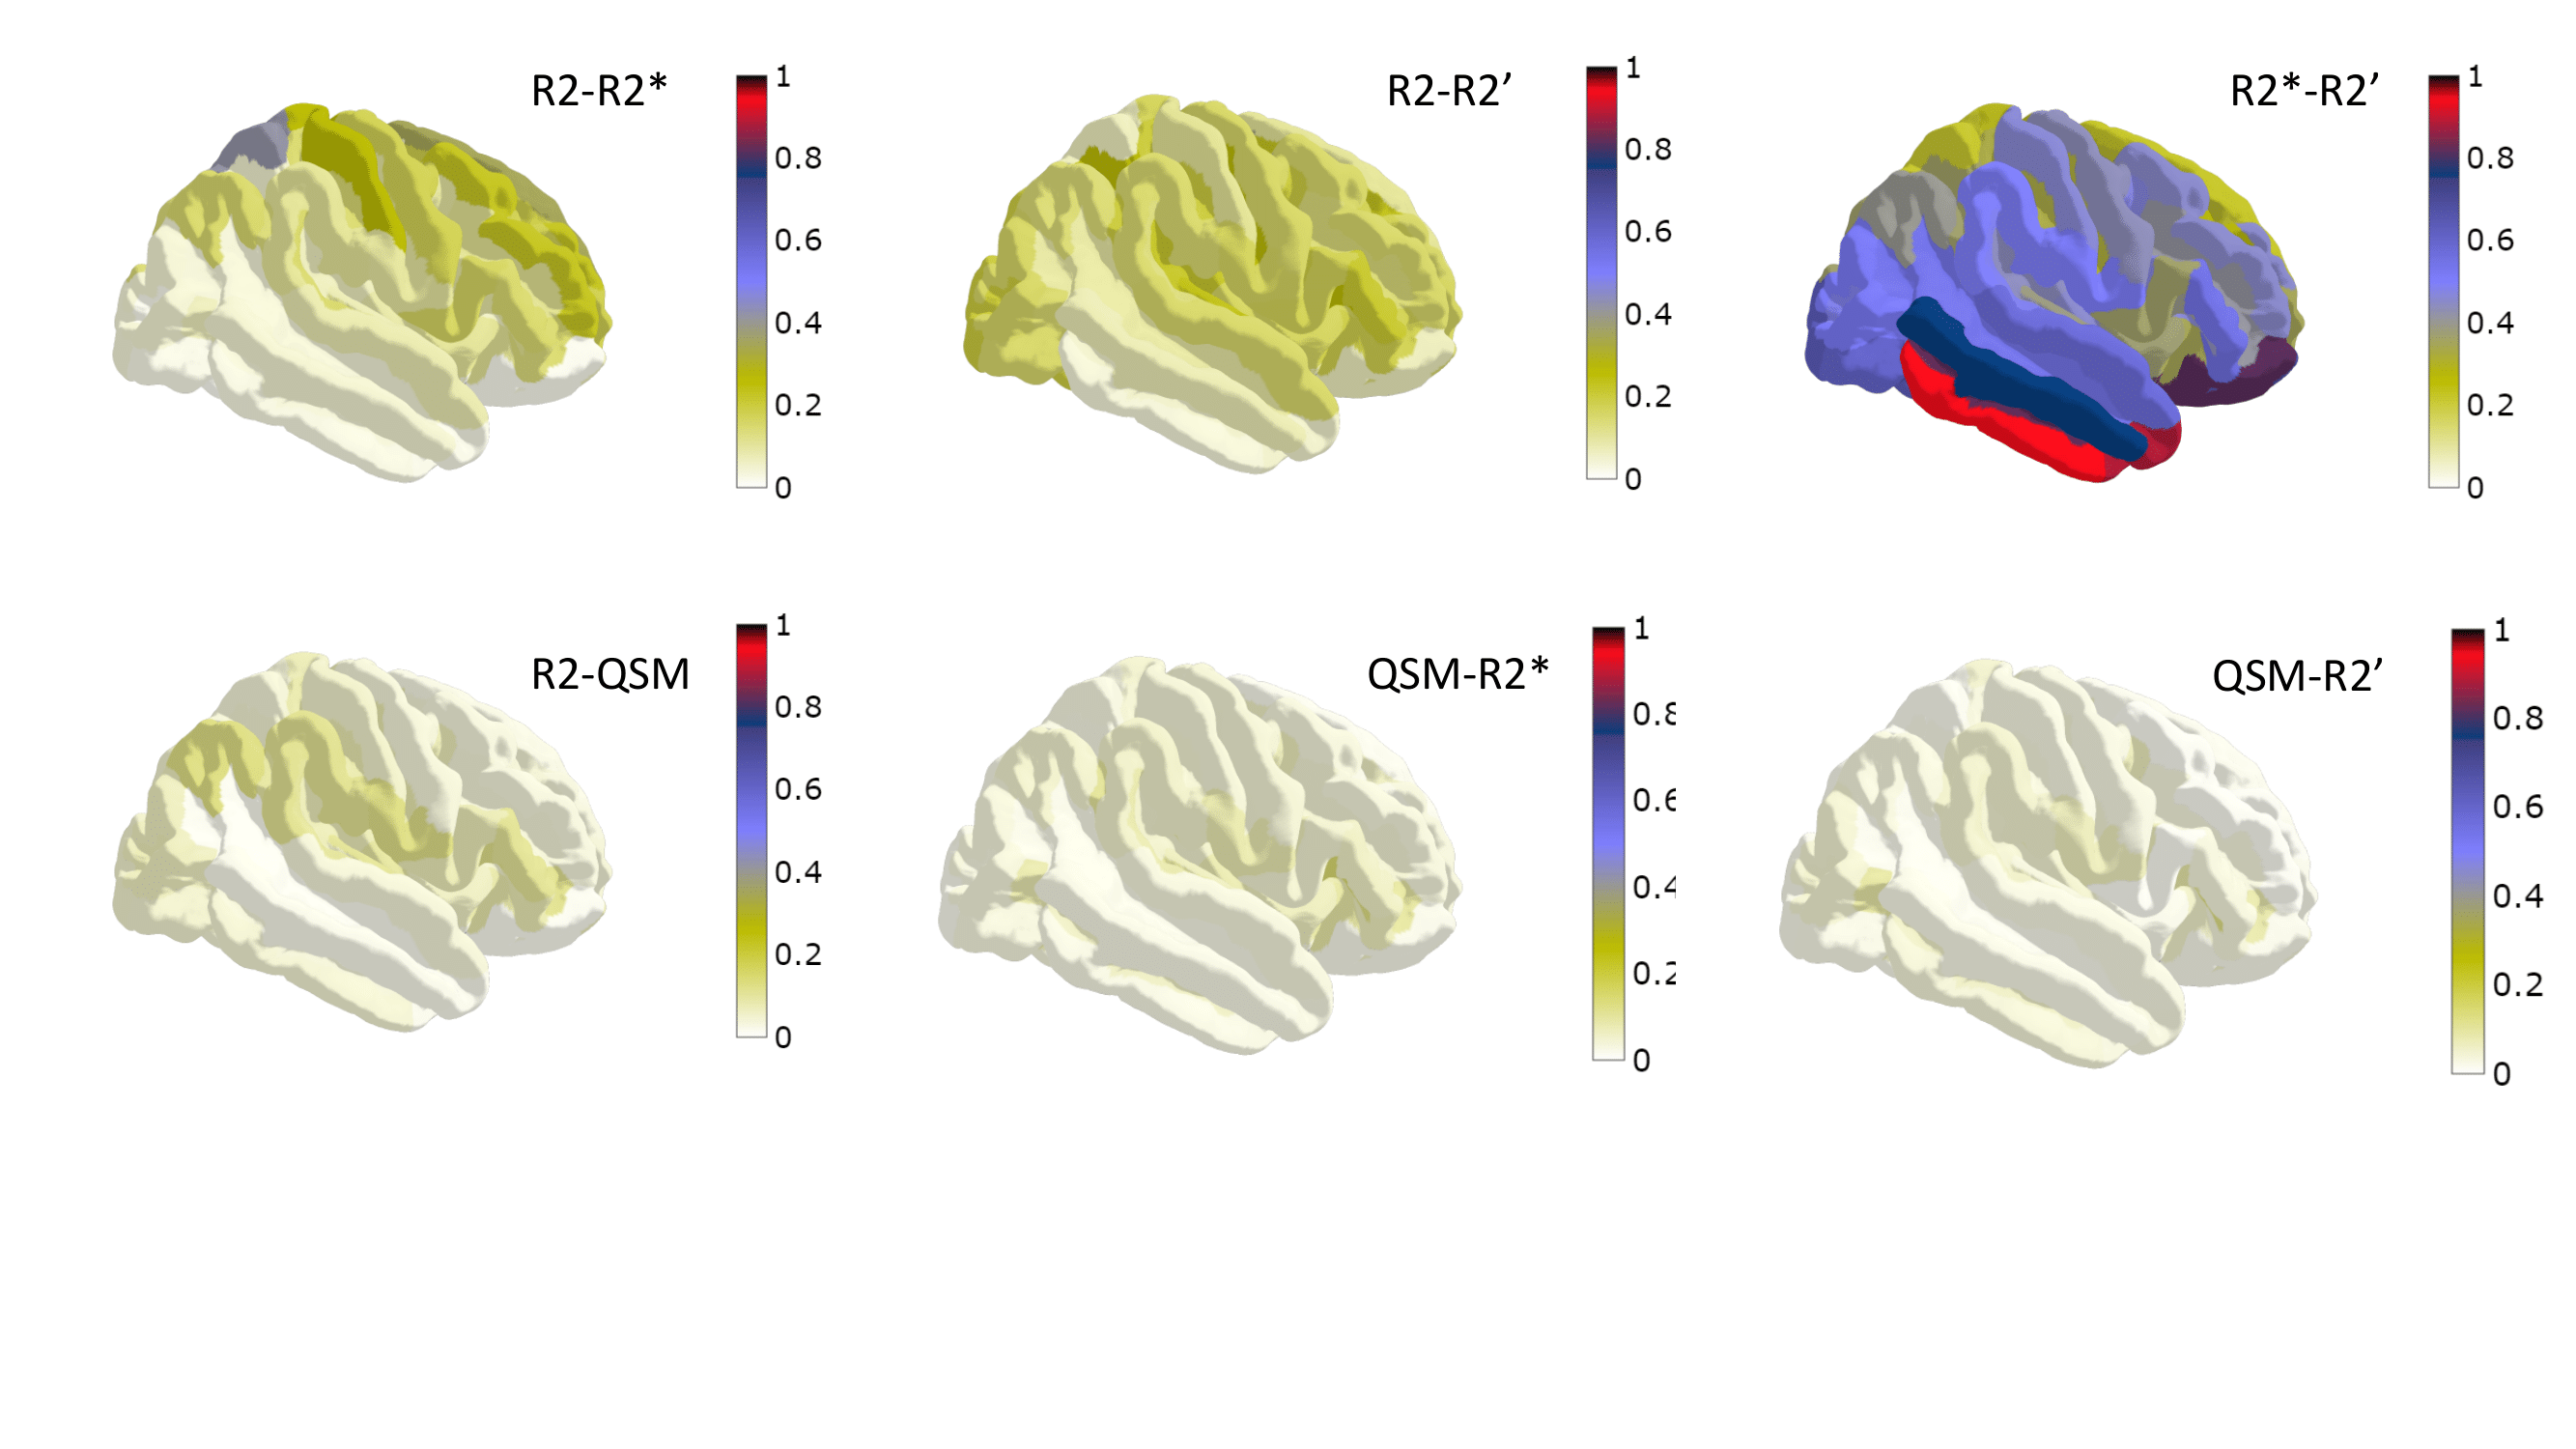
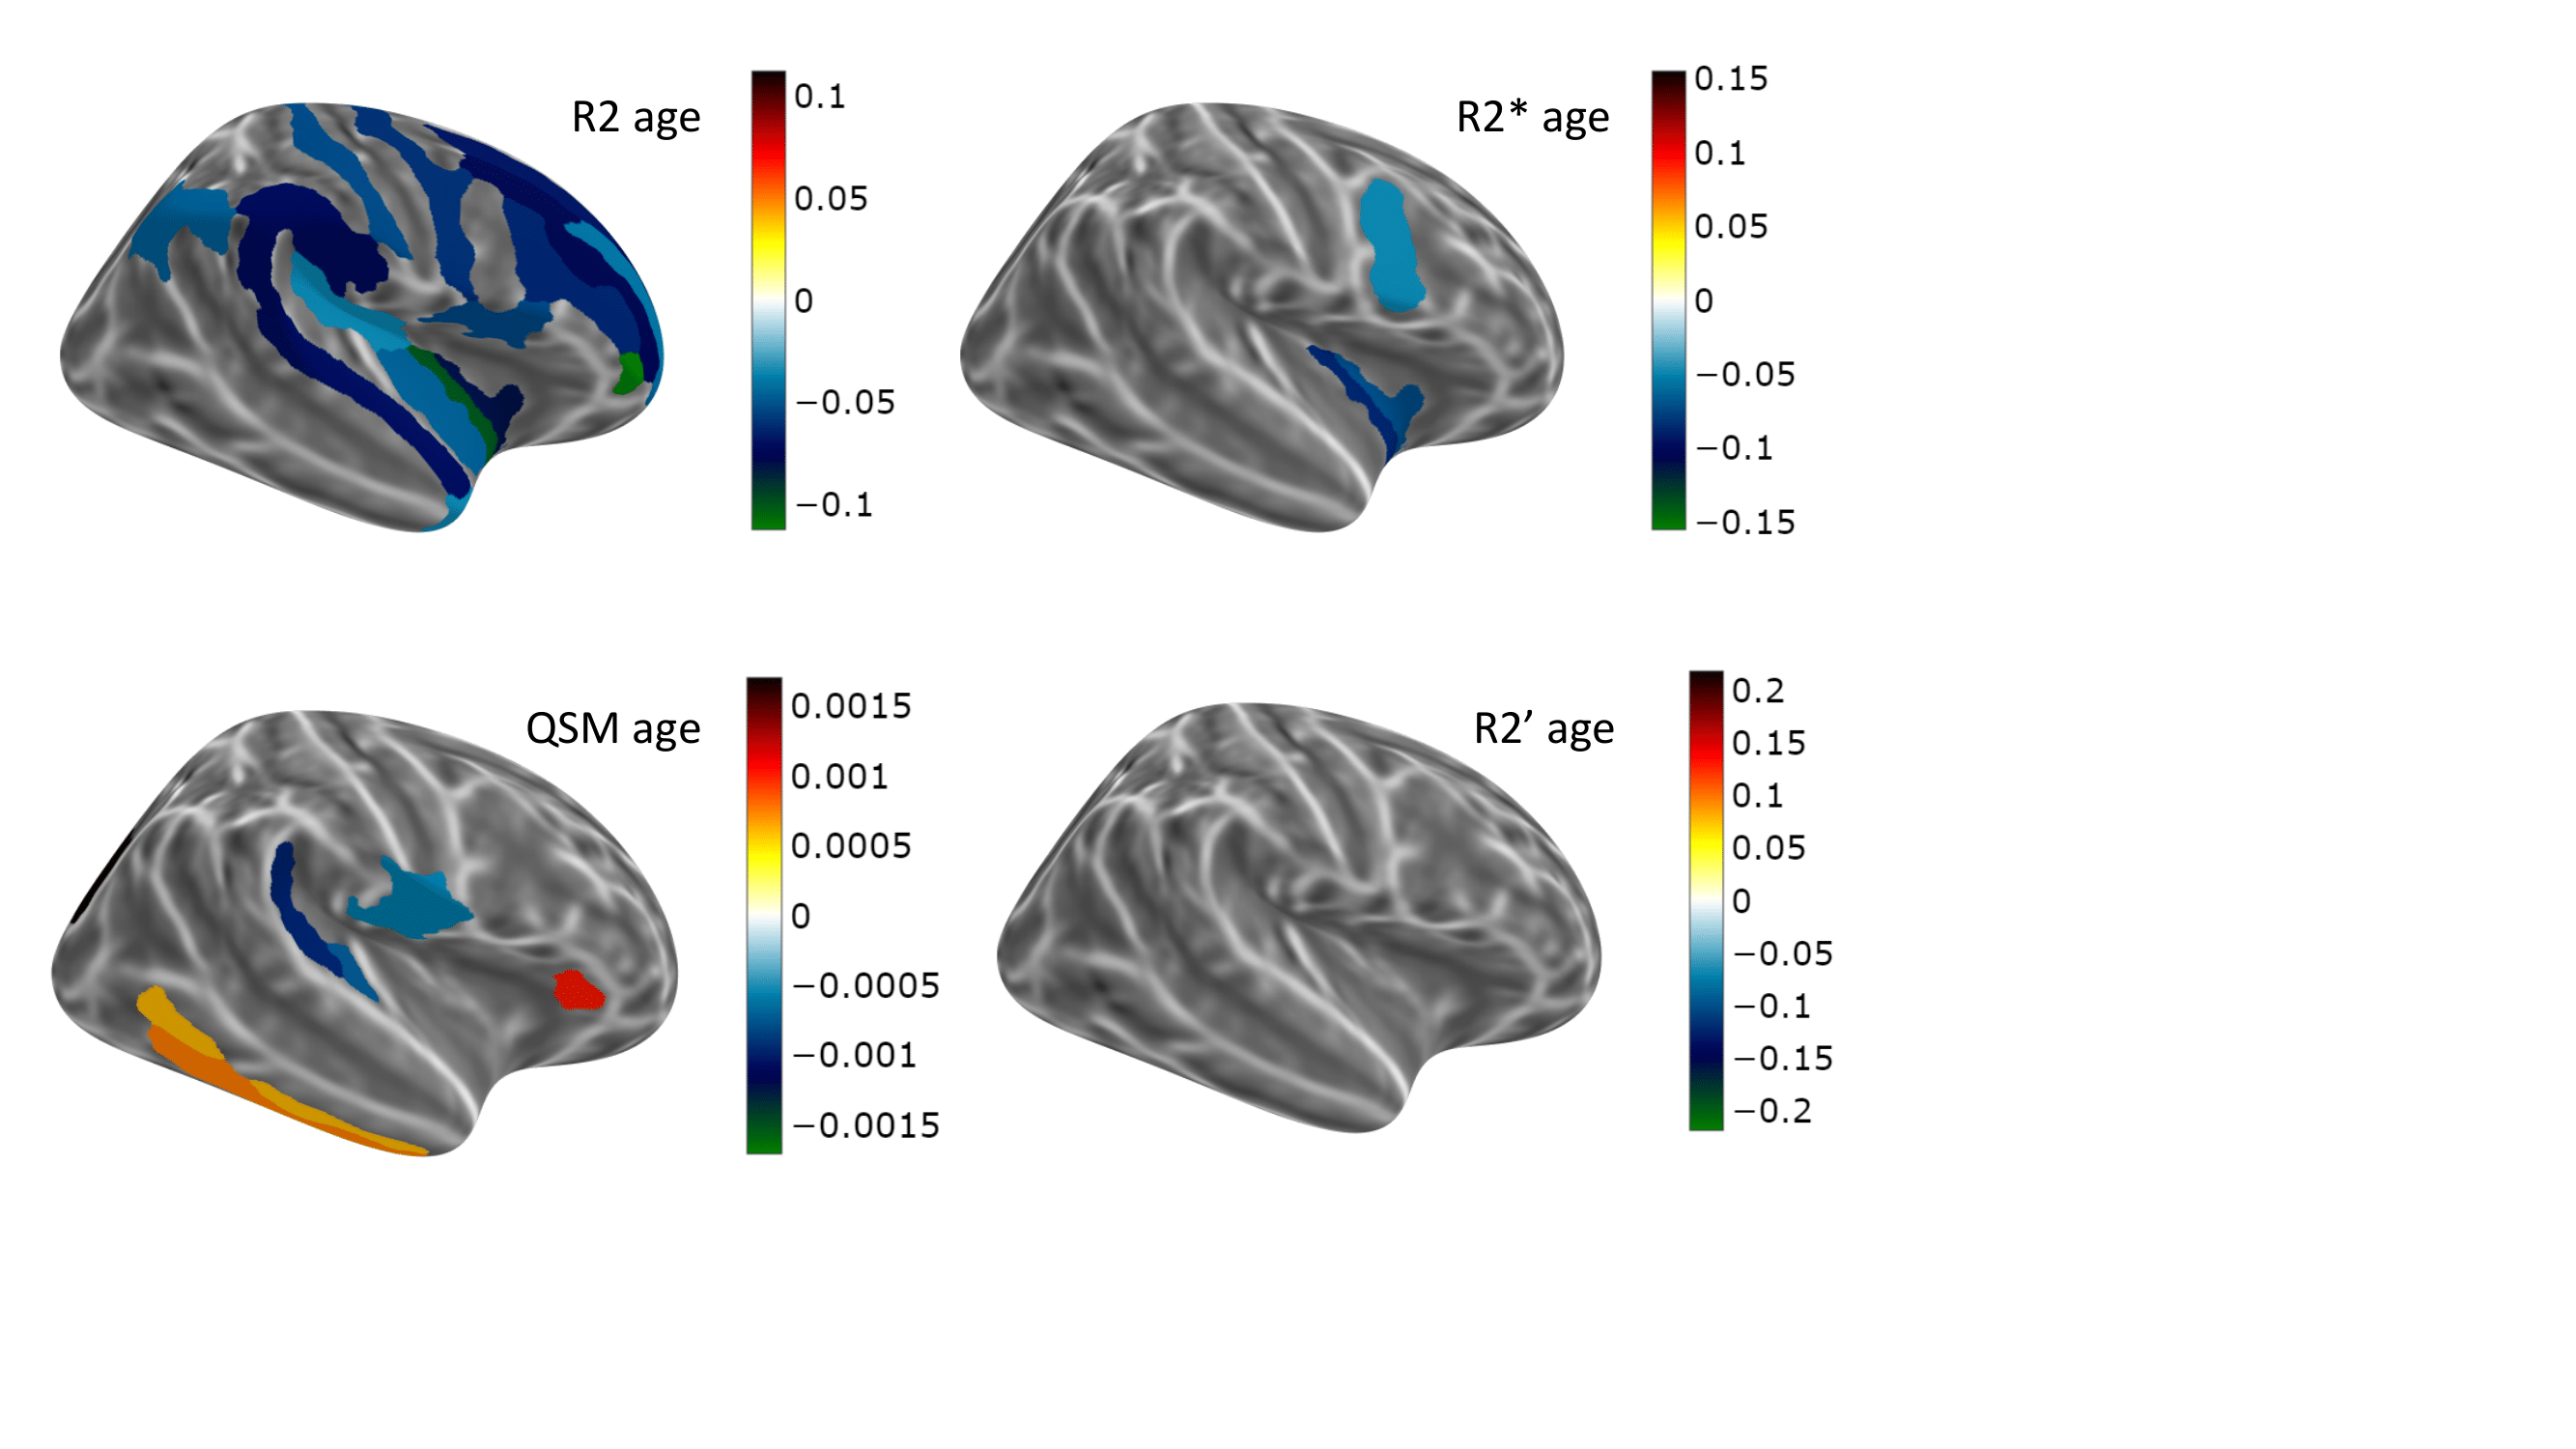
A decrease of R2 with age was measured in all regions with significant age dependence, a decrease of R2* in most regions (increase in putamen, pre and post-central sulci) and mixed behaviour was obtained for R2' (Figs 1-3). The number of regions in which R2 displayed a significant correlation with age (39) was more than twice as large as that for R2* (15), which was twice larger than the number for R2' (only 8). QSM displayed significant changes with age in 16 regions (Fig. 4), with mixed behaviour but mostly increasing towards more paramagnetic values. Most of the regions with significant age dependence were cortical, with the exception of thalamus and putamen. Cerebellar grey matter also showed a significant increase in QSM with age. The correlation between pairs of parameters was moderate (Spearman's Rho < 0.6) and, when involving QSM, highest for the pair QSM-R2. Among the different transverse relaxation times, the correlation between R2* and R2' was highest, and the correlation between R2 and R2' was higher and significant in more regions than that for R2 and R2*.Discussion
R2 is sensitive to iron deposits on the sub-cellular level, nm-um scale, effect mediated by the diffusion of water, whereas R2' is the reversible relaxation rate, sampling the field inhomogeneity in a static manner and sensitive to larger scale inhomogeneities (towards voxel size). R2* is even more influenced by diffusion than R2, reflecting more contributions from vasculature (especially large vessels, as known from GE-SE fMRI). These observations based on quantitative parameters do not lead to a clear-cut picture of cortical ageing, but suggest that age-related influences proceed mostly by the intra-cellular iron effect on QSM and demyelination effect on R2. However, R2 displayed age dependence in a similar number of, but disjoint set of ROIs from the more accurate measure of myelin fbound, measured from the same volunteers/protocol and reported before15. As pointed out in16, ultrastructural electron microscopy studies demonstrate that myelin breakdown results in microvacuolations consisting of splits of myelin sheath layers that create microscopic fluid-filled spaces that increase MRI-visible water and should contribute to decrease R2. Thus, at least one more physiological factor – water content – should be included in addition to myelin and iron when describing transverse relaxation times, susceptibility and their correlations in ageing.Acknowledgements
The authors would like to thank Mr. Jonas Kielmann for substantial help with establishing the processing chain and very valuable discussions.References
[1] Hallgren and Sourander (1958) doi: 10.1111/j.1471-4159.1958.tb12607.x
[2] De Barros et al. 2019 (review) https://doi.org/10.3389/fnana.2019.00068
[3] Sedlacik et al 2016 https://doi.org/10.1016/j.neuroimage.2013.08.051
[4] Uddin et al. 2016. Magnetic Resonance Imaging 34: 51-59.
[5] Hardy et al. 2005 JMRI 21: 118-127
[6] Caspers et al. 2014 Front Aging Neurosci 6:149
[7] Schall, Melissa et al. 2020 J. Magn. Reson. Imaging 51:514–523.
[8] Iordanishvili et al. 2019 Neuroimage 202(15):116077.
[9] V. Yarnykh Magn Reson Med. 2007 Jan;57(1):192-200.
[10] McPhee and Wilman 2015 https://doi.org/10.1016/j.neuroimage.20.
[11] Nöth et al. 2017. https://doi.org/10.1016/j.neuroimage.2 Fig. 4
[12] Oros-Peusquens et al. 2008. 10.1007/s10334-008-0107-5
[13] Liu et al. 2018 doi: 10.1002/mrm.26946
[14] Zhang et al. 2019 doi: 10.1016/j.mri.2019.04.003
[15] Oros-Peusquens, Proceedings ISMRM 2021, p.
[16] Peters et al 1996. J Neuropathol Exp Neurol 55:861–874
[17] Pei et al 2014 https://doi.org/10.1002/mrm.25137
[18] Stüber et al, 2014. Neuroimage 93 : 95-106.
Figures