1524
Cell swelling induces measurable changes in T2 relaxation time1Department of Biomedical Engineering, Sungkyunkwan University, Suwon, Republic of Korea, Suwon, Korea, Republic of, 2Laboratory for Imaging Science and Technology, Department of Electrical and Computer Engineering, Seoul National University, Seoul, Republic of Korea, Seoul, Korea, Republic of, 3Department of Intelligent Precision Healthcare Convergence, Sungkyunkwan University, Suwon, South Korea, Suwon, Korea, Republic of
Synopsis
To find novel contrast mechanisms of neuronal activity, our group previously demonstrated using in vitro cells that changes in membrane potential induces changes in MR parameters. There are two plausible factors that may contribute when the membrane potential changes: the dynamics of hydration water, and cell swelling. In this study, we investigated if cell swelling can contribute to changes in T2 under a constant membrane potential using non-excitable cells. As a result, we found that cell swelling induces measurable changes. As the cell size increased, the short T2 component caused by the intracellular water increased and vice versa.
Purpose
Blood-oxygen-level-dependent functional MRI (BOLD-fMRI) is widely used to elucidate brain functional organizations. However, because BOLD-fMRI is based on hemodynamic responses, it provides only indirect information about neuronal activation. For this reason, many studies have been conducted to find novel contrast mechanisms of neuronal activity with MRI.1 As part of these efforts, our group previously demonstrated using in vitro cells (SH-SY5Y) that changes in membrane potential induces changes in MR parameters such as T1 and T2 (mainly T2).2 In terms of the mechanisms underlying our findings, there are two plausible factors that may contribute to these MR parameters when the membrane potential changes: One is the dynamics of water molecules in the hydration layer of the plasma membrane, and the other is cell swelling. In this study, we attempted to investigate if cell swelling can contribute to changes in T2 under a constant membrane potential using non-excitable cells such as Jurkat cells.Methods
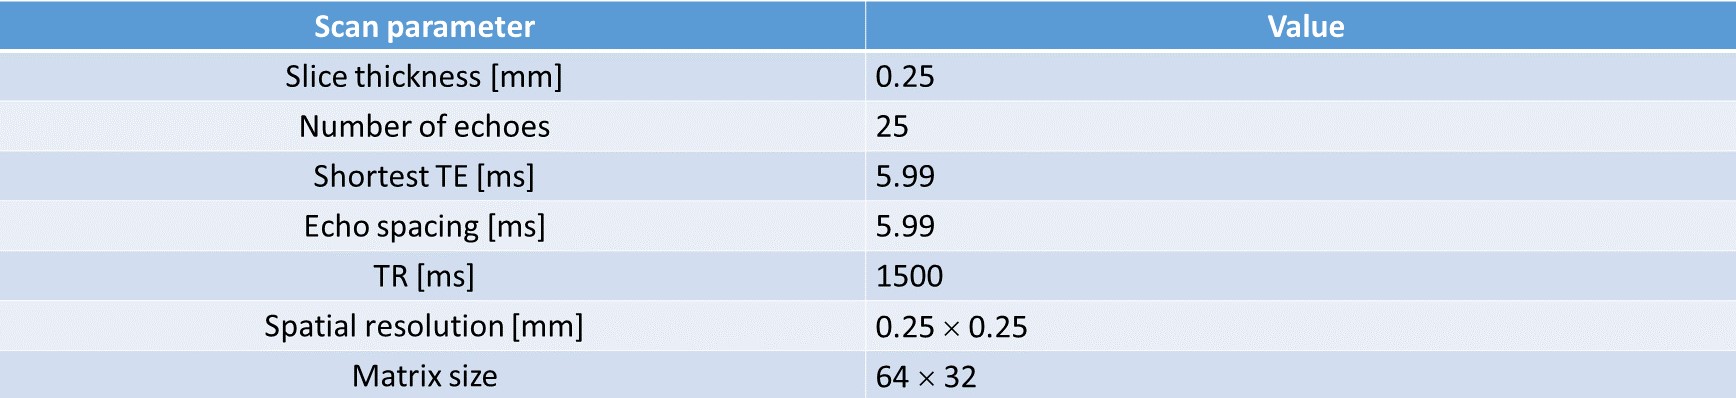
Cell culture and preparation: The main condition of this study is to exclude the effect of hydration water on the plasma membrane due to changes in cell membrane potential and consider only the T2 change due to cell swelling. Therefore, we used non-excitable cells such as T-lymphocyte cell line (Jurkat) with an extracellular medium containing NaCl because modulating sodium ions does not alter the membrane potential of in non-excitable cells, but alters the cell volume through osmotic pressure. The Jurkat cells were cultured in RPMI 1640 medium with 10% fetal bovine serum and 1% penicillin/streptomycin at 37 °C and 5% CO2 in the air. To control the osmotic pressure, we prepared three different media with additional [Na+] of 0, 15, and 30 mM, respectively. The composition of the medium consisting of the pipette solution was: 4.2mM KCl, 145.8mM NaCl, 20mM HEPES, 4.5g/L glucose, and 10μM EGTA with 7.2pH. For MR measurement, each cell suspension was loaded into each well perforated in a sphere-like acrylic phantom and centrifuged in the form of a pellet.MRI experiment: Experiments were performed at 9.4T (BioSpin, Bruker). A multiecho spin-echo (MESE) sequence with 25 echo times was used for quantitative T2 estimation. A single slice 0.25 mm thick was set across the cell pellet region. 150 trials were averaged to increase SNR enough to avoid an ill-posed problem. Scan parameter is given in Fig.1.
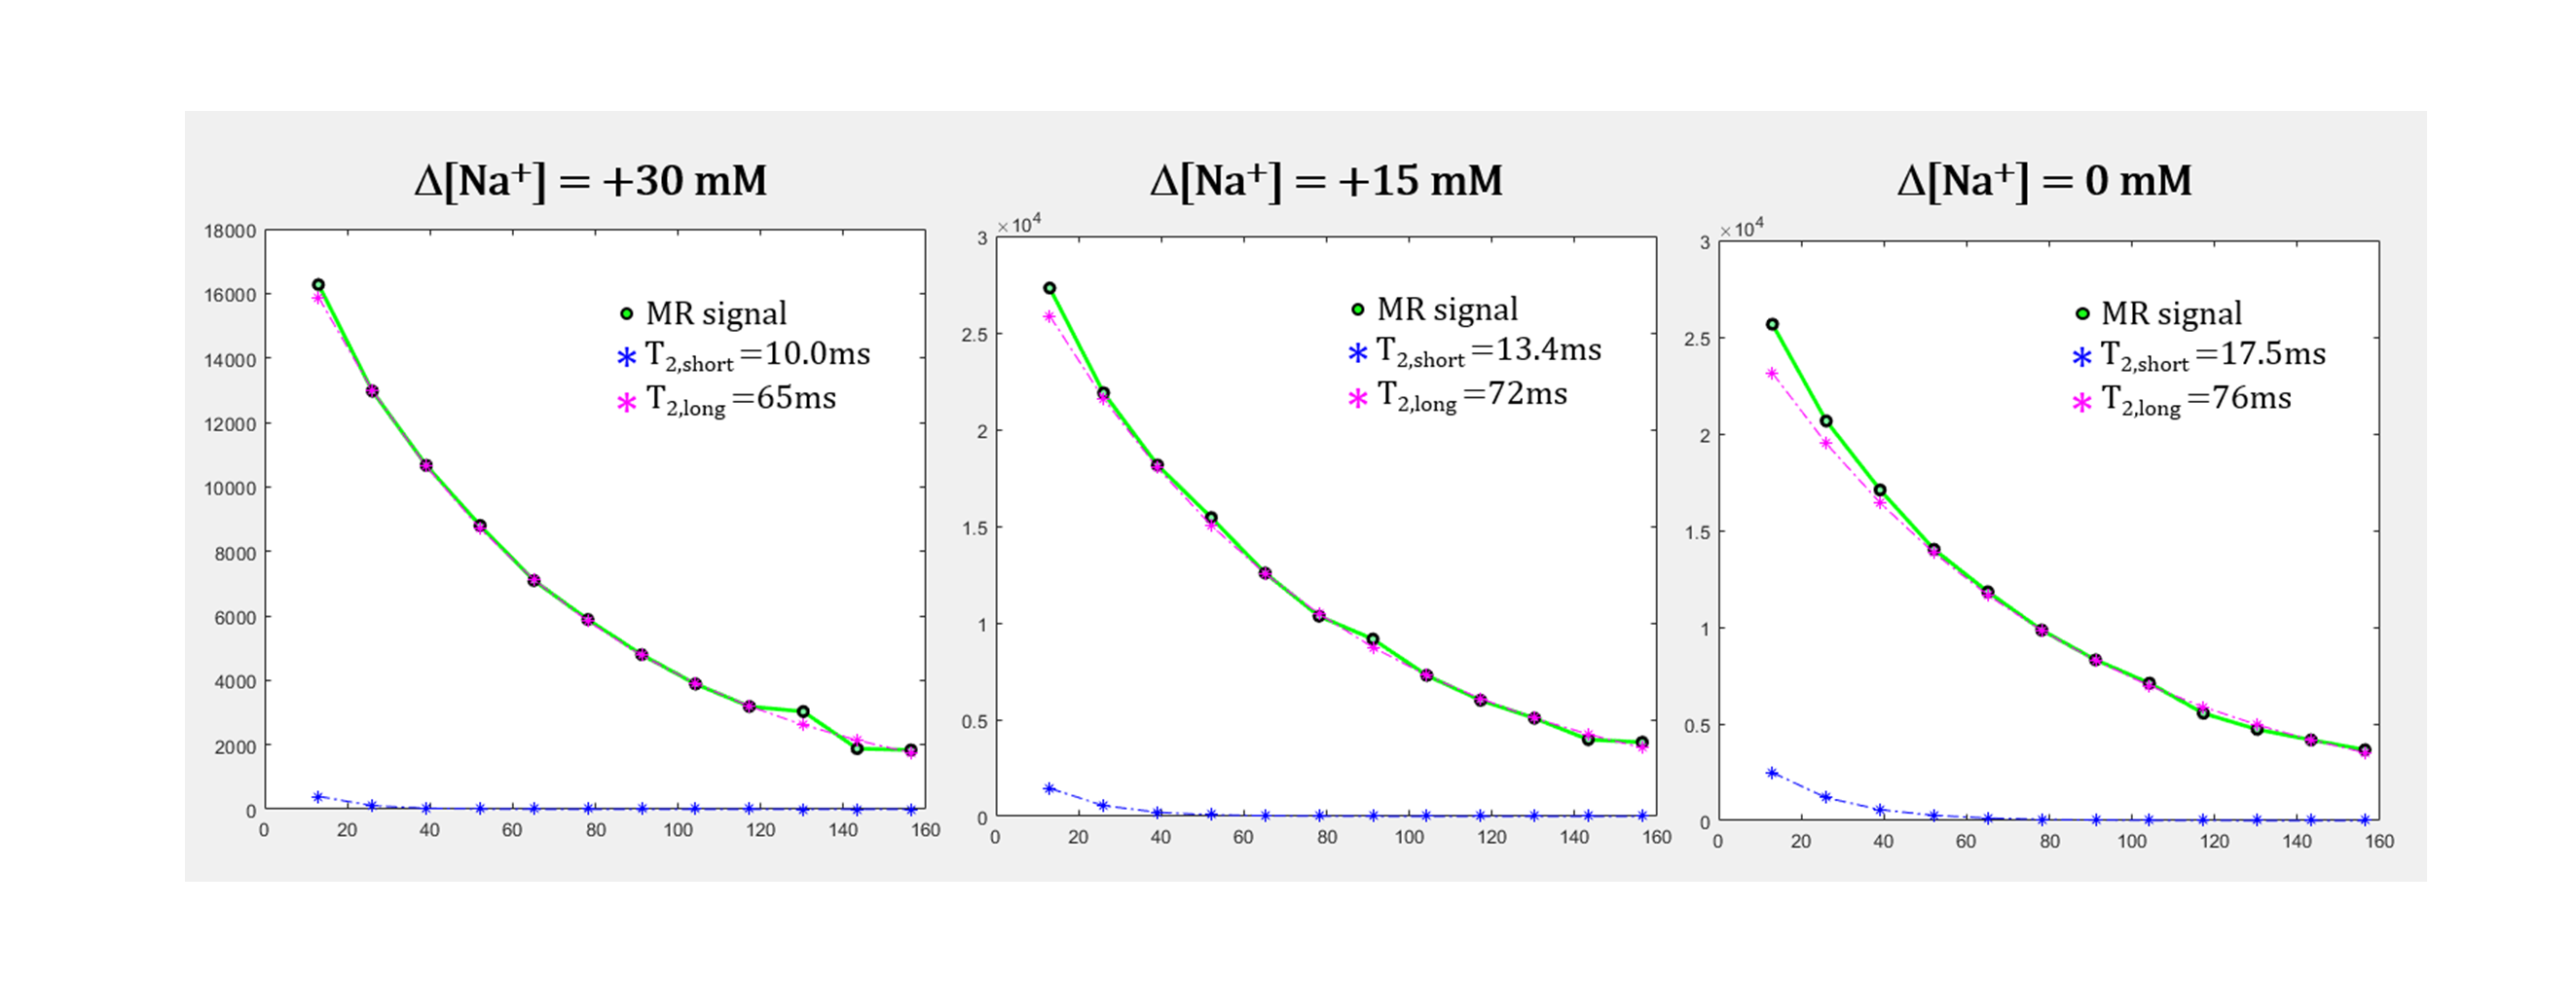
Analysis: For data analysis, odd-numbered echoes were chosen to minimize B1-related problems in quantitative analysis using a MESE sequence.3 To estimate the intracellular and extracelluar T2 values, signals were fitted to a bi-exponential function:4-6
$$Signal(TE) = C·(α×exp(-TE/T_{2,short}) + (1-α)×exp(-TE/T_{2,long}))$$
where α is a fraction of short T2 component (T2,short, intracellular water) ranging from 0 to 1, and (1-α) is a fraction of long T2 component (T2,long, extracellular water). For the fitting, α was calculated from 0 to 0.999 by increments of 0.001. T2,short was bounded from 10ms to 50ms, and T2,long was bounded from 50ms to 250ms.
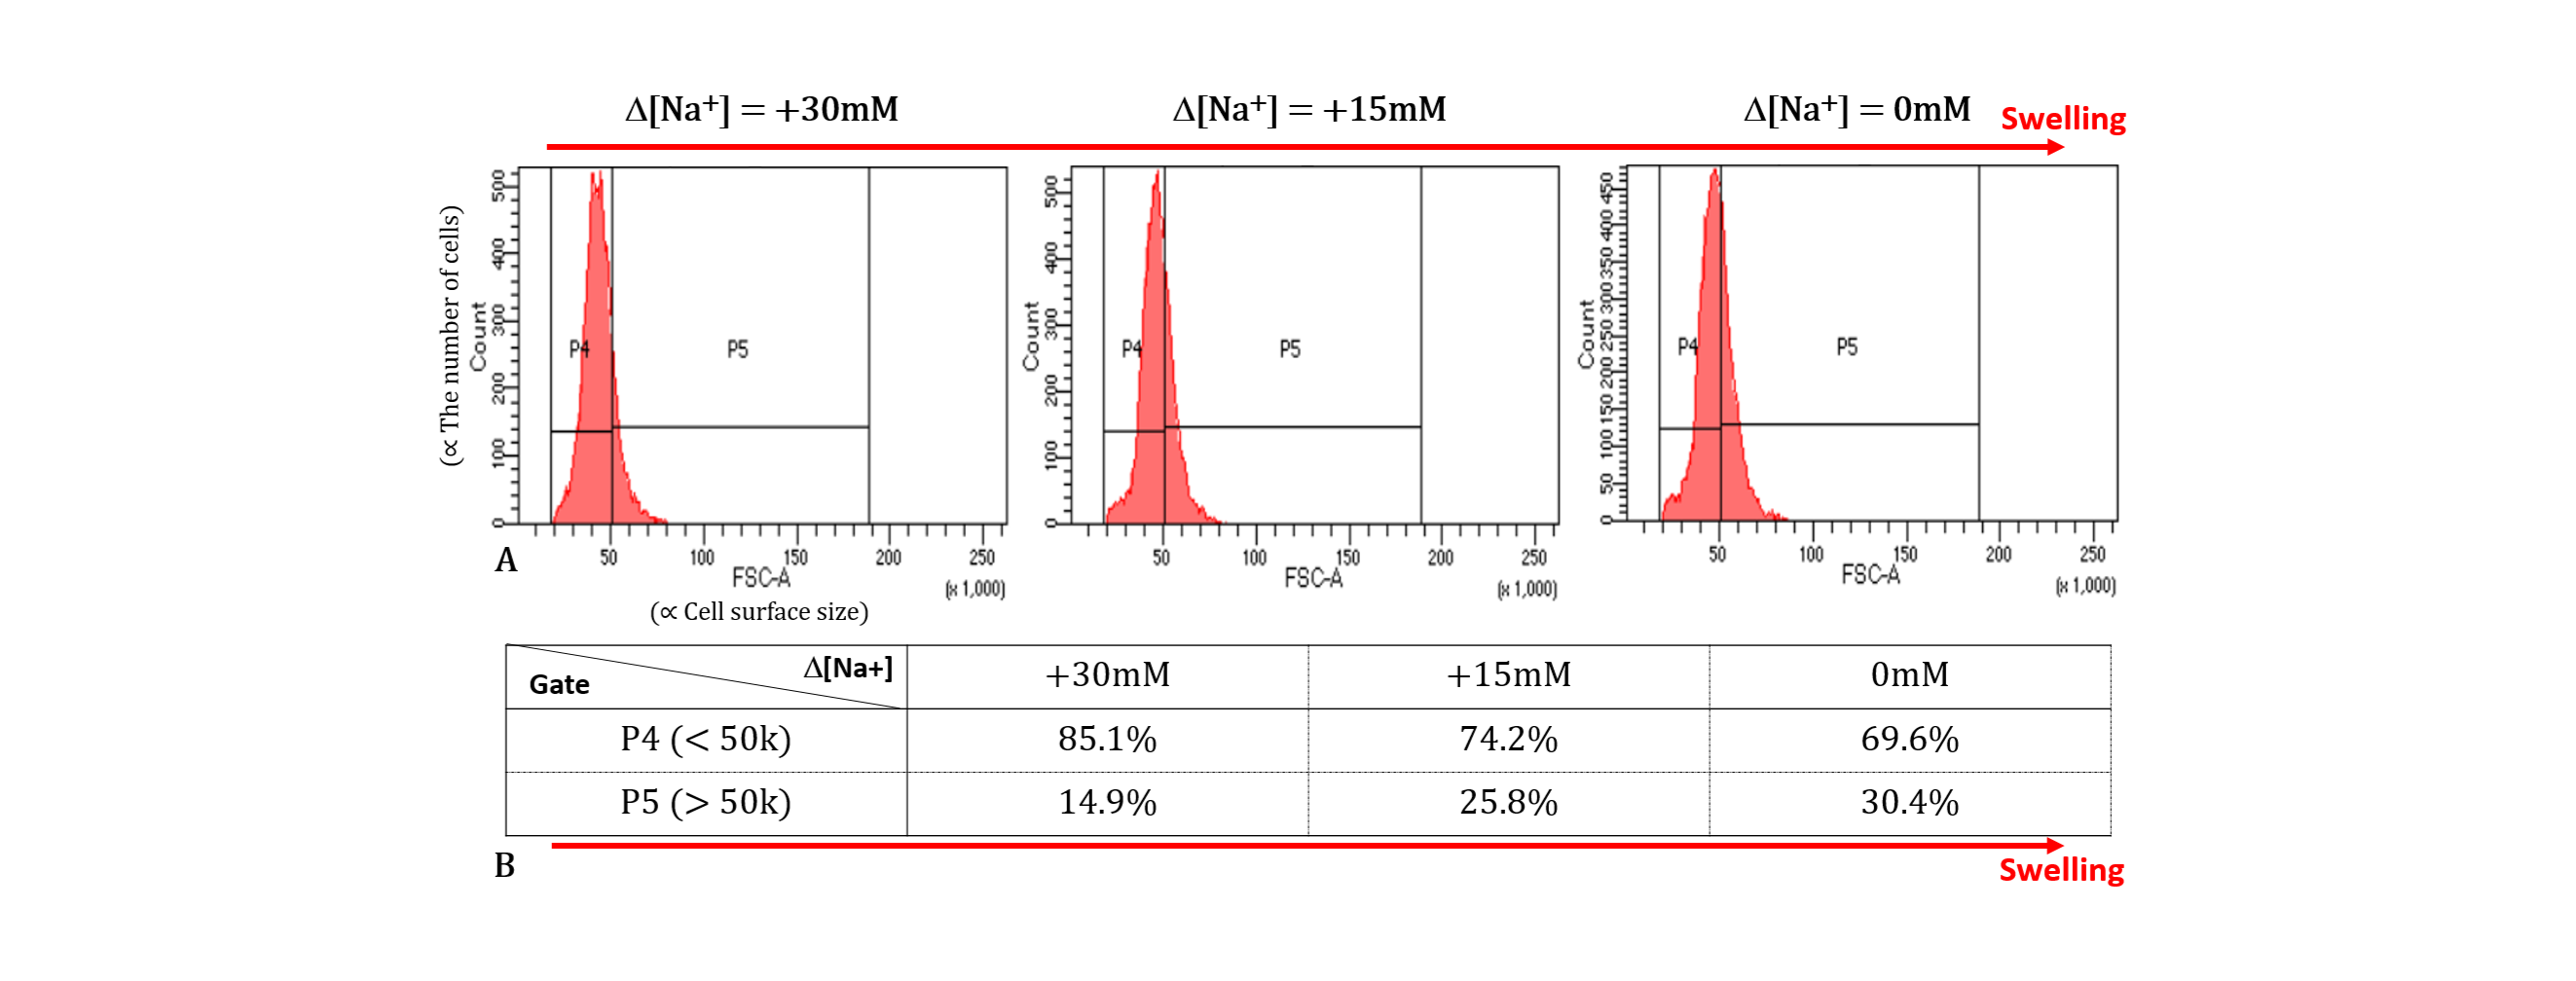
Flow cytometry: To confirm cell expansion due to reduced osmolality, cell size was evaluated in three different conditions (Δ[Na+] = 0, 15, and 30 mM) using flow cytometry (BD FACSAria Fusion Flow Cytometer, Biosciences).
Results and Discussion
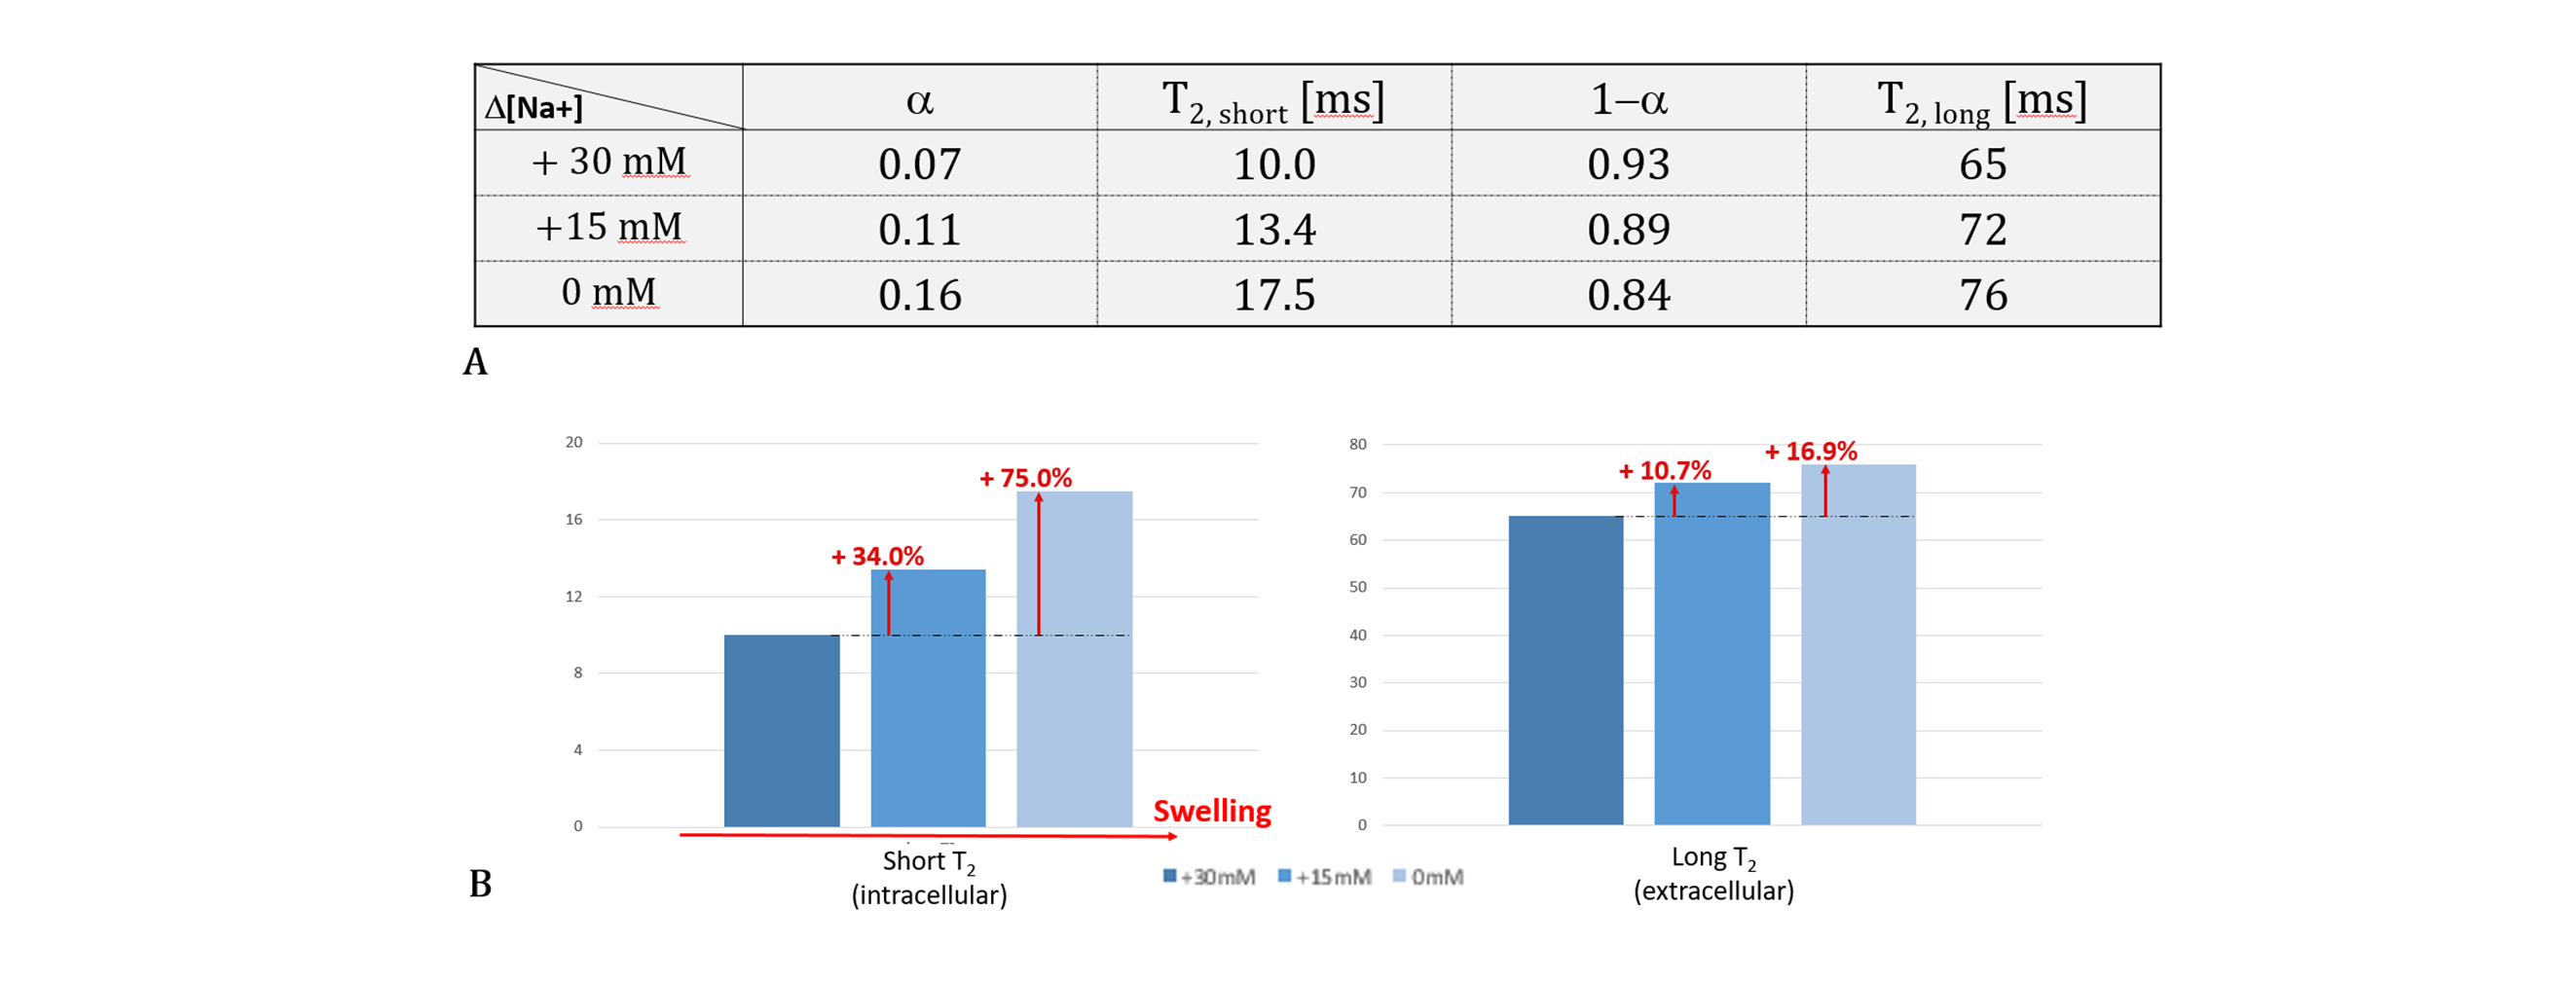
As shown in Figs.2 and 3, when Δ[Na+] changed from 30 to 0 mM, i.e., the cell volume expands due to the decrease in osmotic pressure, the short T2 component (T2,short) corresponding to intracellular water increased from 10.0 to 17.5 ms (Δ = +75.0%) and its fraction which is α, increased from 0.07 to 0.16 (Δ = +128.6%). This result agrees with our expectations because, as the cell size increases, the spin-spin interaction between hydrogen protons of intracellular water molecules decreases (increased T2,short) and the space occupancy of cells increases (increased α). On the other hand, as the cell volume expands, the long T2 component (T2,long) corresponding to extracellular water increased but its fraction (1-α) decreased. The decrease in a fraction of extracellular water is expected, whereas the increase in T2,long can be attributed to the expansion of the extracellular space following cell swelling.Figure 4 shows the flow cytometry results confirming that cell size increases as Δ[Na+] changes from 30 to 0 mM. In Fig.3A, the number of cells was analyzed for a cell size-dependent parameter (FSC-A) with a reference value of 50k. The total number of cells with values greater than 50k (i.e., a group of relatively large cells) increased from 14.9% to 30.4% as Δ[Na+] decreased from 30 to 0 mM (Fig.3B).
Conclusion
In this study, we demonstrated that cell swelling induces measurable changes in T2 relaxation time using non-excitable Jurkat cells. As the cell size increased, the short T2 component caused by the intracellular water increased and vice versa. A further study is warranted for investigating the relationship between cell swelling and changes in membrane potential using excitable cells as well as non-excitbale cells.Acknowledgements
This work was supported by the Brain Research Program through the National Research Foundation of Korea (NRF) funded by the Ministry of Science, ICT & Future Planning (NRF-2019M3C7A1031993)References
1. Bandettini, P. A., Petridou, N., & Bodurka, J. (2005). Direct detection of neuronal activity with MRI: Fantasy, possibility, or reality? In Applied Magnetic Resonance (Vol. 29, Issue 1, pp. 65–88). Springer Science and Business Media LLC.
2. Proc. Intl. Soc. Mag. Reson. Med. 29 (2021). Noninvasive detection of changes in membrane potential with magnetic resonance mearsurements.
3. Kumar, D., Siemonsen, S., Heesen, C., Fiehler, J., & Sedlacik, J. (2015). Noise robust spatially regularized myelin water fraction mapping with the intrinsic B1-error correction based on the linearized version of the extended phase graph model. In Journal of Magnetic Resonance Imaging (Vol. 43, Issue 4, pp. 800–817). Wiley.
4. Pamela Rose Jackson (2012). Multiexponential T2 and Diffusion Magnetic Resonance Measurements of Glioma Cells. In the Graduate division of the University of California, Berleley.
5. Ababneh, Z., Beloeil, H., Berde, C. B., Gambarota, G., Maier, S. E., & Mulkern, R. V. (2005). Biexponential parameterization of diffusion and T2 relaxation decay curves in a rat muscle edema model: Decay curve components and water compartments. In Magnetic Resonance in Medicine (Vol. 54, Issue 3, pp. 524–531). Wiley.
6. Ioannidis, G. S., Nikiforaki, K., Kalaitzakis, G., Karantanas, A., Marias, K., & Maris, T. G. (2020). Inverse Laplace transform and multiexponential fitting analysis of T2 relaxometry data: a phantom study with aqueous and fat containing samples. In European Radiology Experimental (Vol. 4, Issue 1). Springer Science and Business Media LLC.
Figures