1523
The electric potential of lipid vesicle surfaces affects T2 and magnetization transfer1Department of Electrical and Computer Engineering, Seoul National University, Seoul, Korea, Republic of, 2Department of Biomedical Engineering, Sungkyunkwan University, Suwon, Korea, Republic of, 3Department of Intelligent Precision Healthcare Convergence, Sungkyunkwan University, Suwon, Korea, Republic of
Synopsis
In this study, the effect of the electric potential of lipid vesicle surfaces on MR relaxation times and magnetization transfer was investigated. Negatively charged multilamellar vesicles were formed, and their surface potential was adjusted by changing the sodium ion concentration. While the zeta potential changed from -57.0 mV to –21.6 mV, T2 increased from 48.2 ms to 67.4 ms, PSR decreased from 5.5% to 5.0%, kmf decreased from 82.7 Hz to 40.6 Hz, and T2b increased from 177.8 μs to 189.1 μs. These observations are expected to be utilized to image action potential generated in white matter.
Introduction
Macromolecules retard the mobility of nearby water molecules1, affecting magnetic resonance imaging contrasts2 through changing T1, T2, and magnetization transfer occurring between macromolecules and water molecules3. Lipid molecules are the main component of macromolecules in white matter. Hence the effect of lipid molecules on the MRI signal of white matter has been studied extensively4,5. As an in-vitro model of white matter, multilamellar vesicles (MLV) can be used for its structural similarity to myelin sheath6. The electric potential of the lipid surfaces is a particularly important subject since it is directly related to the action potential generated in white matter. In this study, we used MLVs as an in-vitro model of white matter and examined the effect of the electric potential of the lipid vesicle surfaces on T1, T2, and magnetization transfer.Methods
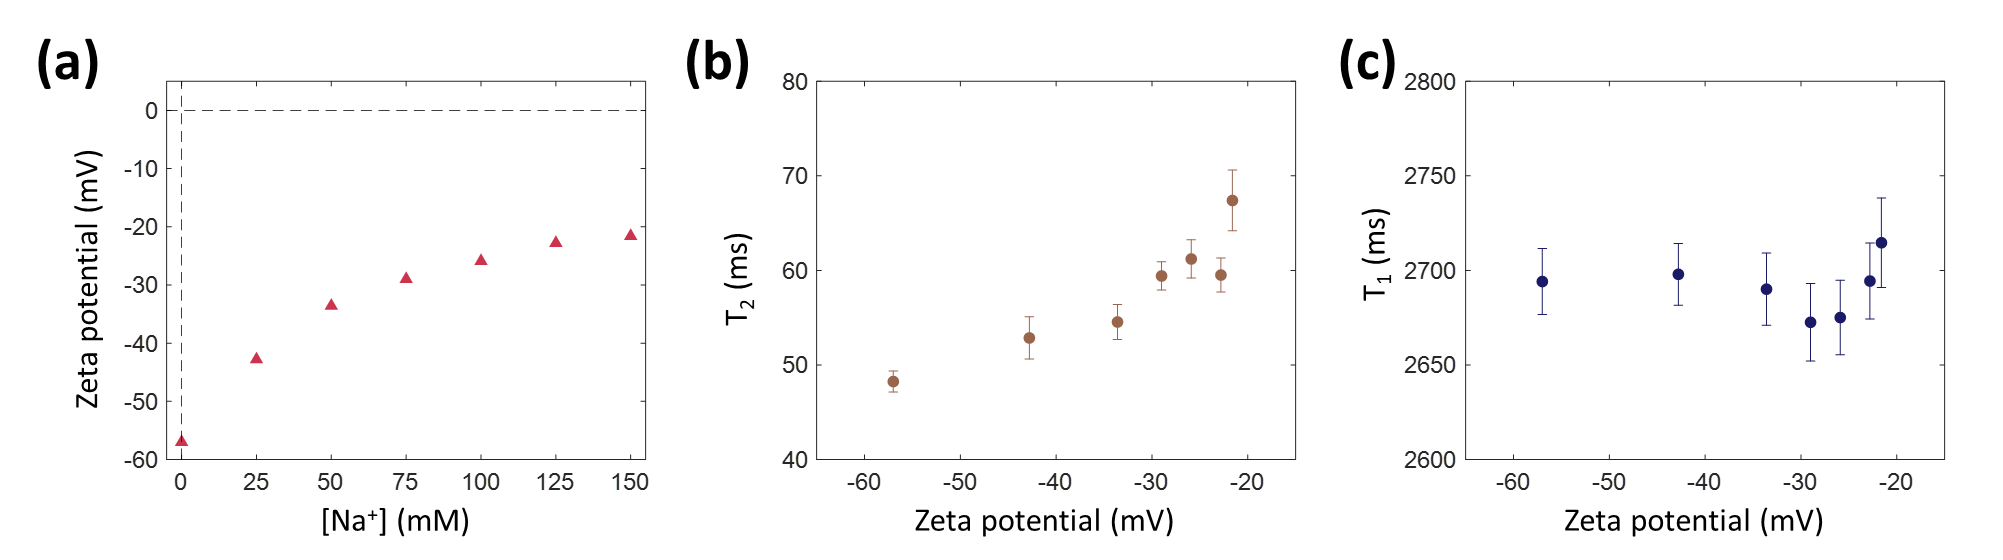
Multilamellar vesicles. Two types of phospholipids, neutrally charged 18:1 (Δ9-Cis) PC (DOPC) and negatively charged 18:1 (Δ9-Cis) PG (DOPG), were used to form negatively charged MLVs (Fig. 1a). Negatively charged MLVs were prepared by mixing DOPG and DOPC with a molar ratio of DOPG:DOPC = 2:8. First, DOPG/DOPC dissolved in chloroform was dried under a steady stream of nitrogen gas (N2) to form a thin lipid film. Then, the lipid film was hydrated with an aqueous solution containing NaCl (0 to 150 mM) to control the ionic strength of the solution. By changing the ionic strength of MLV solutions, the electric potentials of lipid vesicles surfaces were controlled (Fig. 1b, c). HEPES of 10 mM was added as a pH buffer (pH = 7.2). Glucose was added to match the osmolarity. The final lipid concentration was 1 mM.MR measurements. MR experiments were performed on a 9.4 T Bruker MRI scanner. The MLV solutions were loaded to wells fabricated on an acrylic sphere. The MR signals from each MLV solution were separated by one-dimensional frequency encoding, as the wells containing the solutions were aligned horizontally. T1 estimation was performed with an inversion recovery spin-echo sequence, with 40 inversion times (TI) spaced between 100 ms and 10,000 ms on a logarithmic scale. The pulse sequence used for the T2 estimation was a single-echo spin-echo sequence with 100 echo times (TE) spaced between 10 ms and 400 ms on a logarithmic scale. Lastly, quantitative magnetization transfer (qMT) measurements were performed by gradient-echo readouts after irradiating radiofrequency pulses of varying offset frequencies (50 to 50,000 Hz, 50 steps, logarithmic spacing) and intensities (120, 180, 270, 405, and 607.5 Hz).
Zeta potential measurements. Zeta potential is the electric potential at the shear plane of charged particles (Fig. 1b, c), which is commonly used as an experimental measurement of the surface potential. The composition of MLV solution was the same as in the MR measurements. The zeta potential of lipid vesicles was measured with Zetasizer Nano ZS90 (Malvern Instruments). The measurements were performed at 25°C.
Results
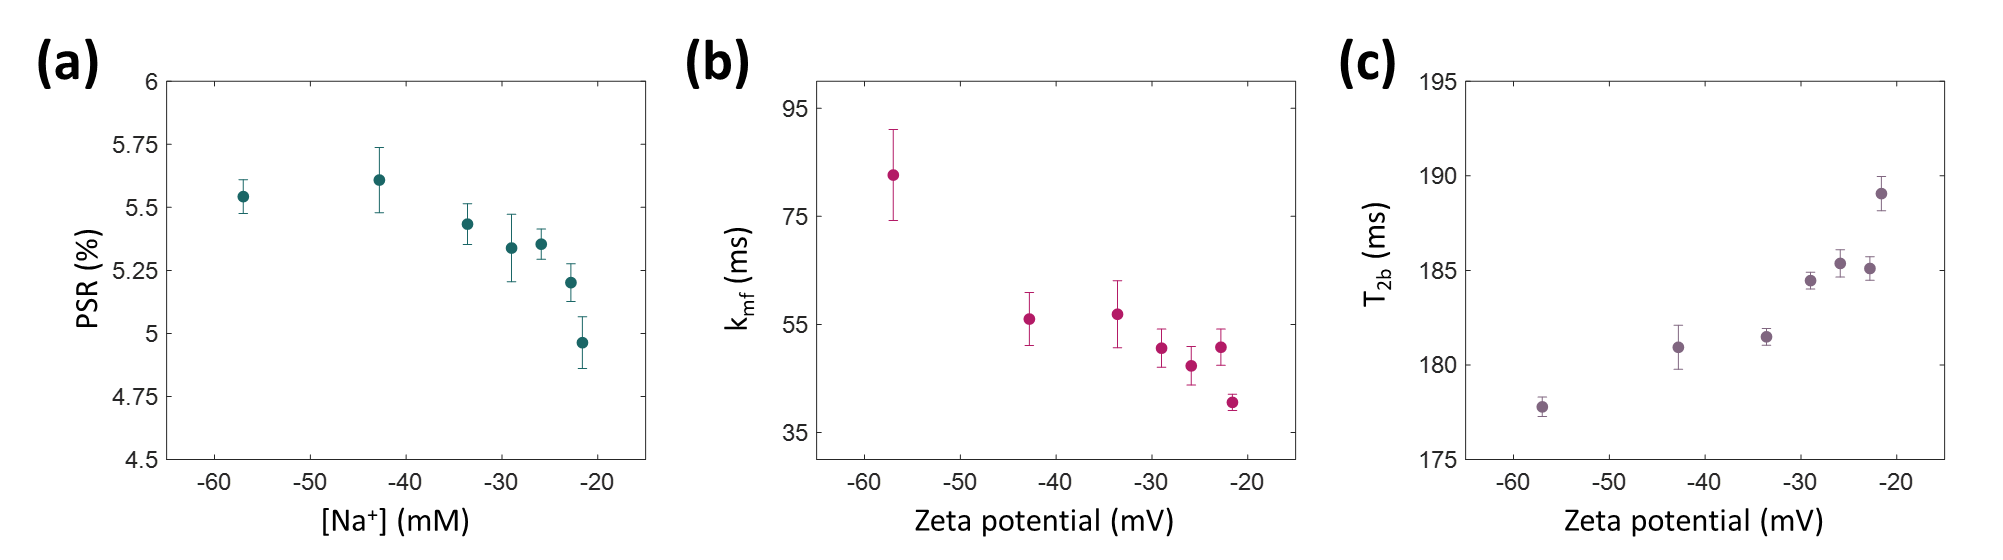
When the sodium ion concentration ([Na+]) increased from 0 to 150 mM, the zeta potential of the MLVs changed from –57.0 mV to –21.6 mV (Fig. 2a). Correspondingly, the relaxation time measurements showed that the T2 values increased from 48.2 ms to 67.4 ms (Fig. 2b), while there was neither an increasing nor decreasing tendency in the T1 values (Fig. 2c). For the quantitative magnetization transfer measurements, three parameters were quantified: PSR (pool size ratio), kmf (exchange rate from macromolecular pool to free water pool), and T2b (T2 of the macromolecular pool). At [Na+] = 0 mM, PSR was 5.5% and decreased to 5.0% at [Na+] = 150 mM (Fig. 3a). kmf decreased from 82.7 Hz to 40.6 Hz (Fig. 3b), and T2b increased from 177.8 μs to 189.1 μs (Fig. 3c), respectively.Discussion
In this study, our results demonstrated that while the zeta potential of lipid vesicles changed from negative values to zero, the T2 and T2b values increased; PSR and kmf values decreased. We suggest that the underlying mechanism for our observation is that the amount of water molecules hydrating the lipid membrane decreases when the effective amount of the surface charge on the lipid membrane decreases. The increase in T2 value can be explained by a decrease in hydration water protons, which have shorter T2 than bulk water protons7. Indeed, decreased hydration water protons can result in a decrease in PSR values.Conclusion
In summary, we have investigated the relationship between the electric potential of lipid vesicle surfaces and MR parameters. T2, T2b, PSR, and kmf showed clear dependence on the zeta potential of MLVs. We expect this observation to be applicable to in-vivo studies, particularly imaging of action potentials generated in white matter.Acknowledgements
This research was supported by the Brain Research Program through the National Research Foundation of Korea (NRF) funded by the Ministry of Science, ICT & Future Planning (NRF-2019M3C7A1031993, NRF-2019M3C7A1031994).
This work was supported by the BK21 FOUR program of the Education and Research Program for Future ICT Pioneers, Seoul National University in 2021.
References
1. Monroe J, Barry M, DeStefano A, et al. Water Structure and Properties at Hydrophilic and Hydrophobic Surfaces. Annu Rev Chem Biomol Eng. 2020;11:523-57.
2. Cooke R, & Kuntz I. The properties of water in biological systems. Annu Rev Biophys Bioeng. 1974;3(1):95-126.
3. Wolff SD, & Balaban RS. Magnetization transfer contrast (MTC) and tissue water proton relaxation in vivo. Magn Reson Med. 1989;10(1):135-44.
4. Morrison C, Stanisz G, & Henkelman RM. Modeling magnetization transfer for biological-like systems using a semi-solid pool with a super-Lorentzian lineshape and dipolar reservoir. J Magn Reson, Ser B. 1995;108(2):103-13.
5. Stanisz GJ, Kecojevic A, Bronskill M, et al. Characterizing white matter with magnetization transfer and T2. Magn Reson Med. 1999;42(6):1128-36.
6. Swanson SD, Malyarenko DI, Schmiedlin-Ren P, et al. Lamellar liquid crystal phantoms for MT—calibration and quality control in clinical studies. In Proceedings of the 20th Annual Meeting of ISMRM, Melbourne, Australia, 2012. p. 1378.
7. Hazlewood CF, Chang DC, Nichols BL, et al. Nuclear magnetic resonance transverse relaxation times of water protons in skeletal muscle. Biophys J. 1974;14(8):583-606.
Figures