1522
Virtual Dynamic Contrast Enhanced MRI of the Breast using a U-Net1Institute of Radiology, University Hospital Erlangen, Friedrich-Alexander University Erlangen-Nürnberg (FAU), Erlangen, Germany, 2Patter Recognition Lab, Department of Computer Science, Friedrich-Alexander University Erlangen-Nürnberg (FAU), Erlangen, Germany
Synopsis
Magnetic resonance imaging (MRI) examinations of the breast require intravenous administration of gadolinium based contrast agents (GBCA) for comprehensive characterization of the tissue. Novel approaches reducing the need for GBCA might therefore be of value. Here a virtual dynamic contrast enhancement (vDCE) using a U-net architecture is investigated in a cohort of n=540 patients. The vDCE generates T1 subtraction images for five consecutive time points predicting the perfusion maps based on native T1-weighted, T2-weighted, and multi-b-value diffusion weighted acquisitions. A mean structural similarity index (SSIM) value over a test group of 82 patients of 0.848±0.025 was achieved.
Introduction
Dynamic contrast enhanced (DCE) acquisitions are a core part of routine breast MRI protocols used for the detection of focal alterations of tissue perfusion. DCE images are acquired before and after the administration of gadolinium based contrast agent (GBCA). Then the post and pre-contrast images are usually subtracted from each other to reveal the perfusion behaviour. While the diagnostic accuracy of this method for breast MRI is well established, methods reducing the need for GBCA administration, e.g. in a screening setting1 or when examining women not eligible for GBCA are of major interest.In recent works of Kleesiek et al.2 and Chen et al.3, it has been shown that the generation of a contrast enhanced brain MRI is possible using neural networks. However, in both publications, the approach was to generate just a single time point after the administration of the contrast agent. This single time point prediction does not allow for full characterization of lesions in breast MRI, especially as this approach lacks the ability to directly visualize the subtraction characteristics. In this work, we investigate the possibility to generate a virtual DCE subtraction series (vDCE) using a U-net neural network using only natively acquired data.
Methods
In this retrospective study, n=540 patient datasets acquired between 2017 and 2020 at the University Hospital Erlangen (UKER) were used. The data were acquired on a single 3T scanner type (Siemens MAGNETOM Skyra) using an 18-Channel breast coil and a routine clinical protocol containing T1-weighted, T2-weighted, DCE and DWI acquisitions. The patient data were split into training, validation and test set with 70%, 15% and 15% of the whole dataset respectively.A U-net architecture was implemented with 3 encoder-decoder-stages. The network used as input MRI dataset comprised of T1-weighted, T2-weighted, and DWI acquisitions with three different b-values (50-1500 s/mm2). The network was trained using the subtractions at five time-points of a DCE T1-weighted acquisition as targets. For the training, two different loss functions were used.
Loss function 1: $$L(\theta)=\frac{1}{N}\sum_{i=1}^{N}\exp(-s_{i})*|y_{i}-y_{i}'|+s_i$$
In which yi is the ground truth pixel intensity, y'i is the predicted pixel intensity and si is an uncertainty term based on Monte-Carlo sampling. This loss is further called Bayesian-Loss and was proposed for this task by Kleesiek et al2. The second loss function:
Loss function 2: $$L(\theta)=\biggl(1-\frac{(2\mu_y\mu_{y'}+C_1)(2\sigma_{yy'}+C_2}{(\mu_y^2+\mu_{y'}^2+C_1)(\sigma_y^2\sigma_{y'}^2+C_2)}\biggr)+\sum_{i=1}^N |y_i - y_{i}'|$$
Is further called Combined Loss as it combines the SSIM and L1 norm and which is a slightly changed loss function from the work of Chen et al3.
For a quantitative evaluation, a mean structural similarity index measure (SSIM) and peak signal-to-noise ratio (PSNR) over the test group was calculated for each single time point. Additionally Pearson correlation coefficients between the original and generated perfusion curves were calculated for 18 patients in both normal appearing breast tissue and in lesions.
Results and Discussion
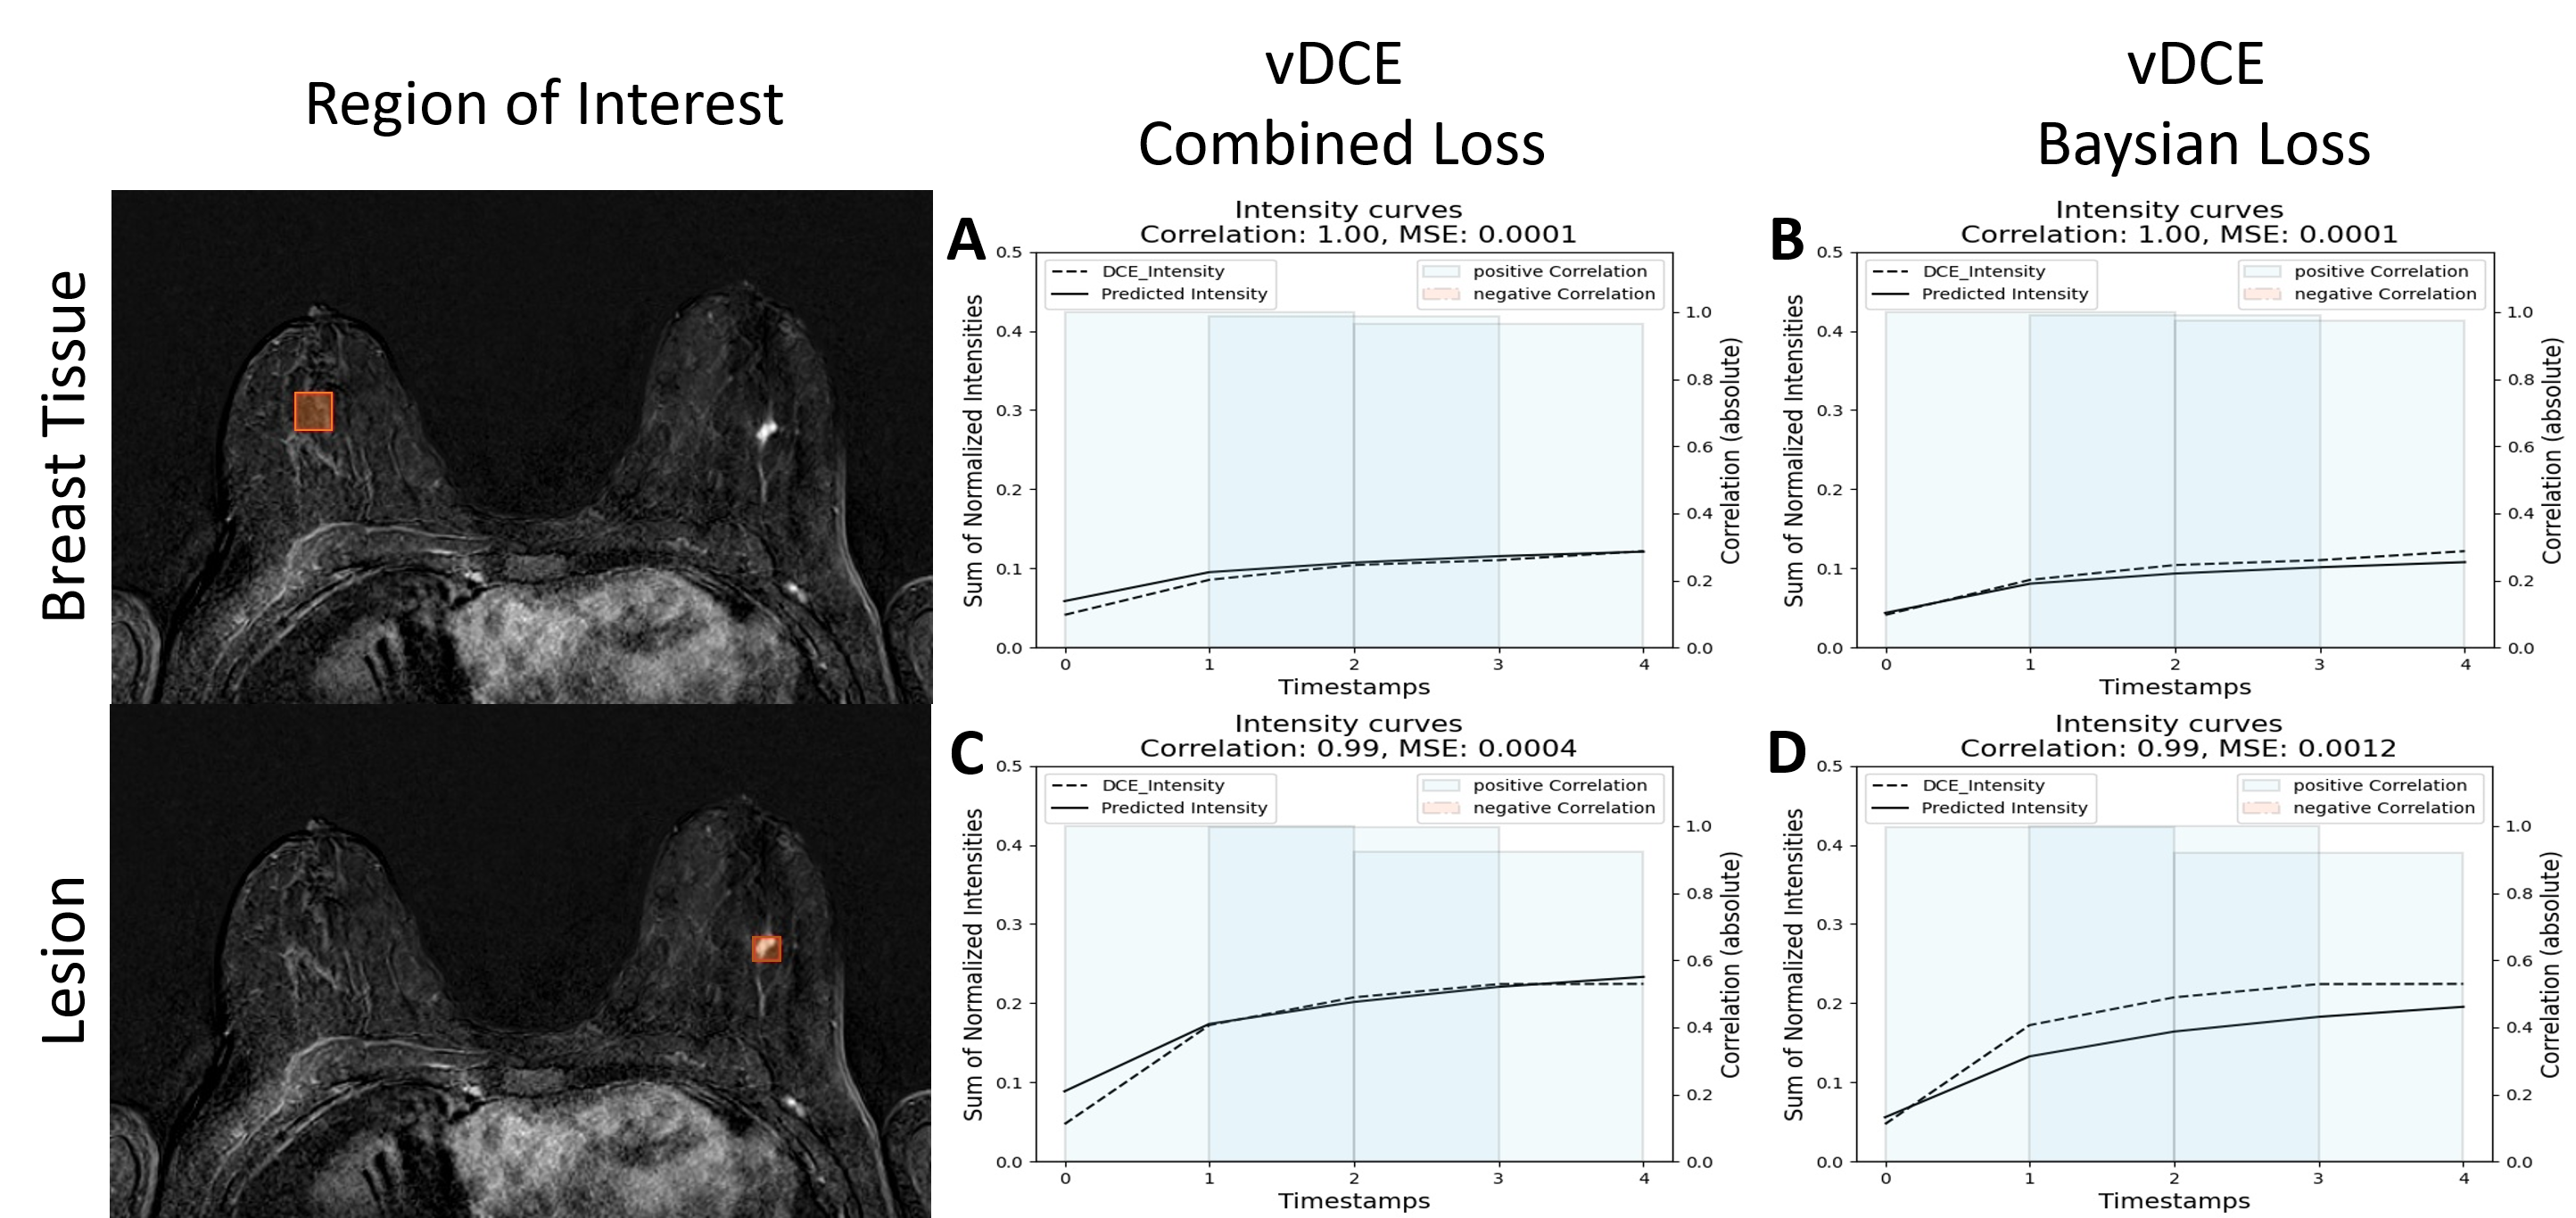
Figure 1 shows the comparison between the two investigated methods. These preliminary results clearly show that the generation of a DCE time-series is possible using a small U-net architecture (Fig.1). As it can be seen in the Table 1 the mean SSIM over all time-points reaches 0.848 with a standard deviation of 2.3%. An increase of the SSIM and a decrease of the PSNR for later time-points can be observed. A smaller SSIM can be noted for the first point in the series most likely due to this time-point’s much lower SNR.In Figure 2 we show a comparison of the perfusion curves of both DCE and vDCE using the two different loss function in a representative case. An increase of the mean square error between the original and generated perfusion curve can be noted for the Bayesian Loss method. The mean Pearson correlation coefficient in the test group was 0.948±0.055 in the normal appearing breast tissue and 0.967±0.041 in lesions for the combined loss function. For the Bayesian loss values of 0.949±0.055 and 0.959±0.048 could be achieved respectively.
In comparison to previous works by Kleesiek et al.2, our network achieved a slightly smaller mean SSIM over the test set. However, it should be noted that our solution uses a smaller architecture.
Additionally, the variability of shape is much higher in breast MRI than in brain MRI. In comparison to Chen et al.3, also a lower SSIM was achieved most likely due to no additional loss function for the lesions being applied. Potentially the addition of such a loss function could allow to reach even higher performances in the future. Finally, in comparison to the both previous works our network generates simultaneously the whole DCE series, which creates additional challenges for the network.
Conclusions
Here we demonstrate that a virtual generation of five consecutive subtraction series reflecting different time-points after contrast agent administration seems technically feasible using a non-contrast enhanced protocol augmented by a dedicated U-net architecture. Out of two different loss functions investigated, the combined loss function proposed by Chen et al. was able to achieve better results with higher SSIM and PSNR values as well as with higher mean Pearson correlation factors between the perfusion curves.. The achieved quantitative performances indicate that further research in this field might be justified in order to better understand advantages and limitations of this approach.Acknowledgements
EPO Patent application No. 21197259.1 - Apparatus and method for generating a perfusion image, and method for training an artificial neural network therefor, Friedrich-Alexander-Universität Erlangen-Nürnberg, Bickelhaupt S., Liebert A., Schreiter H., Sukumar V.,
The financial support of BMBF GoBioInitial project "SMART SELECT MR" to A.L. and H.S. is gratefully acknowledged.
References
1. Bickelhaupt S, Laun FB, Tesdorff J, et al. Fast and Noninvasive Characterization of Suspicious Lesions Detected at Breast Cancer X-Ray Screening: Capability of Diffusion-weighted MR Imaging with MIPs. Radiology. 2016;278(3):689-697.
2. Kleesiek J, Morshuis JN, Isensee F, et al. Can virtual contrast enhancement in brain MRI replace gadolinium?: a feasibility study. Investigative radiology. 2019;54(10):653-660.
3. Chen C, Raymond C,
Speier B, et al. Synthesizing MR Image Contrast Enhancement Using 3D High-resolution
ConvNets. arXiv preprint arXiv:210401592.  2021.
2021.
Figures
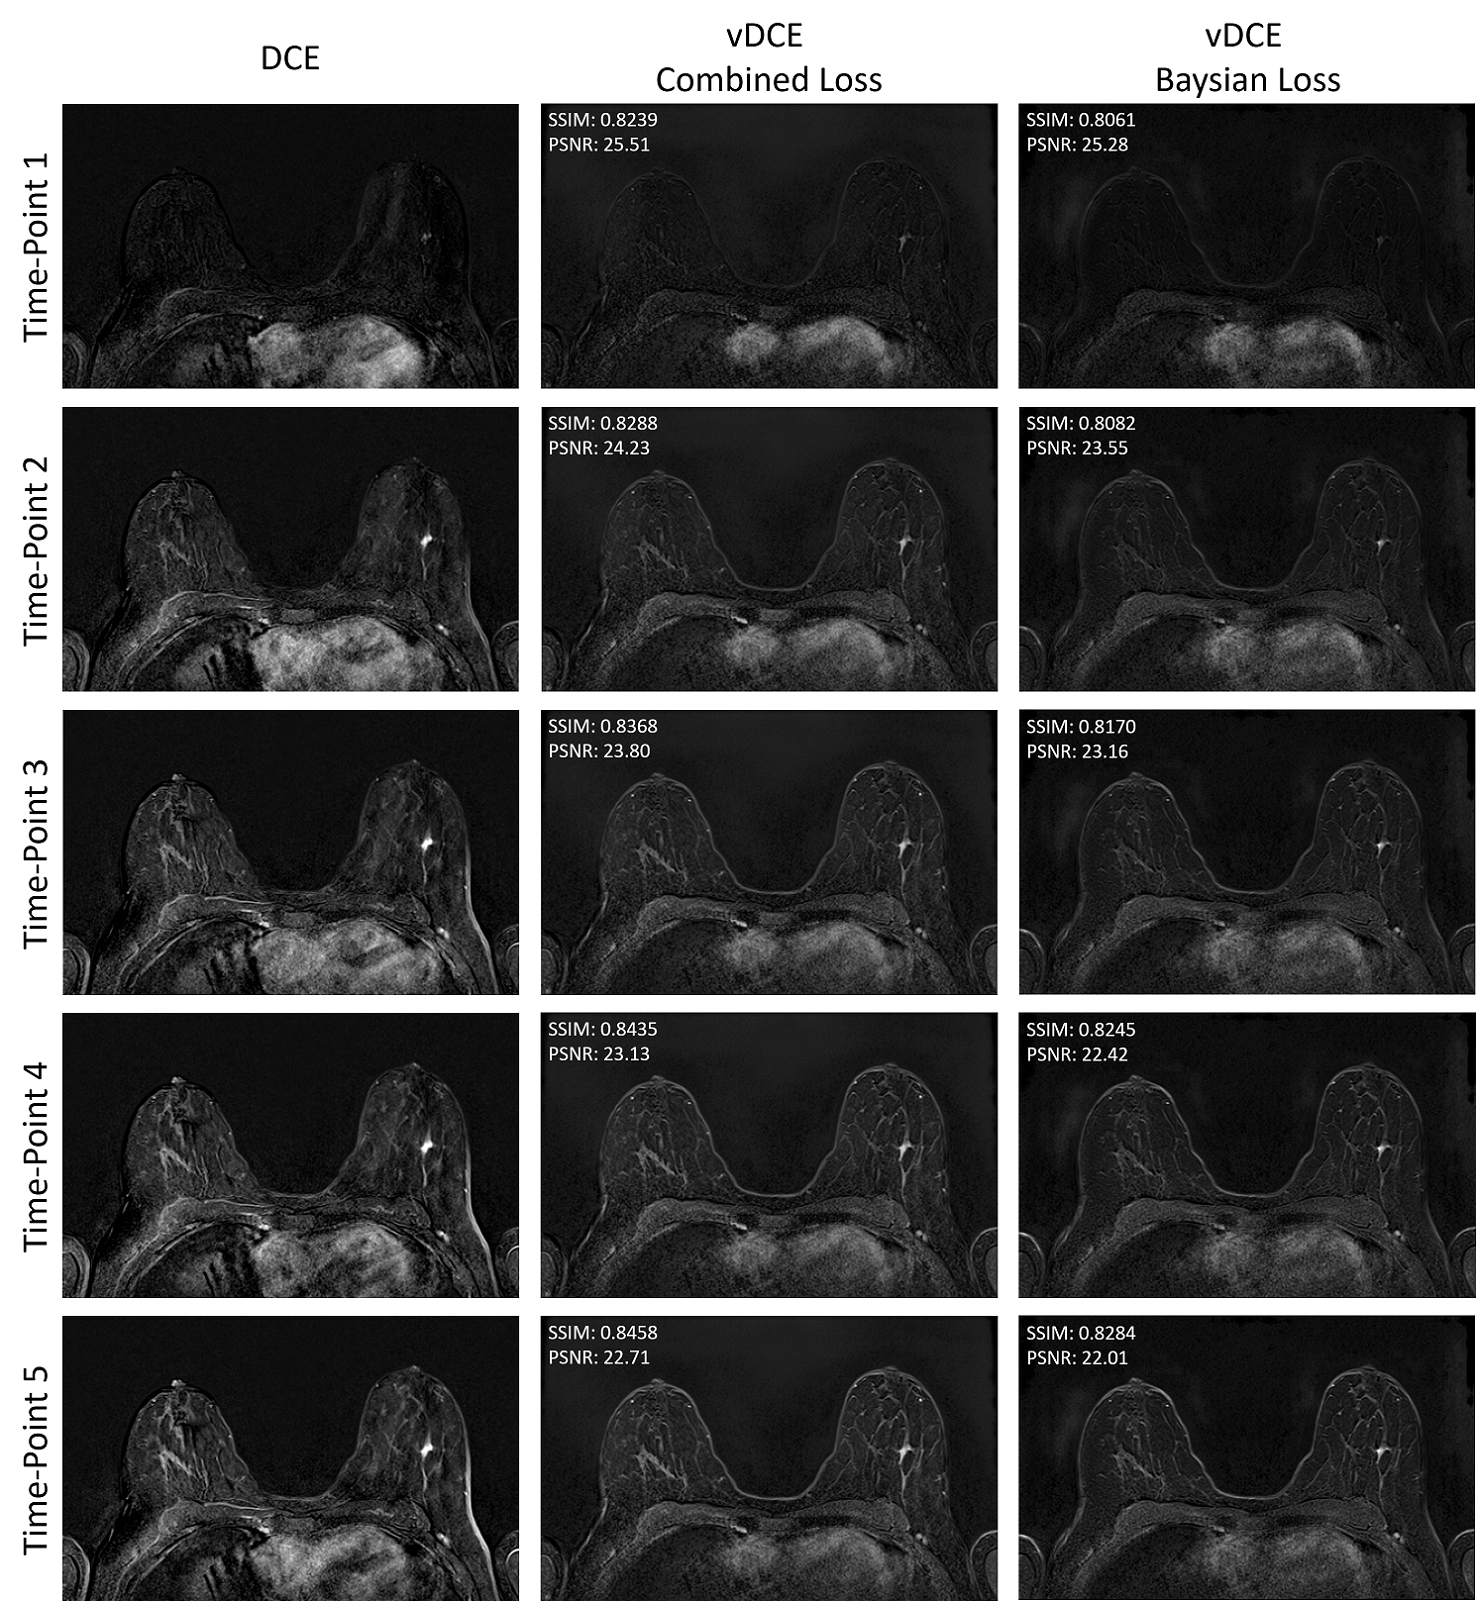
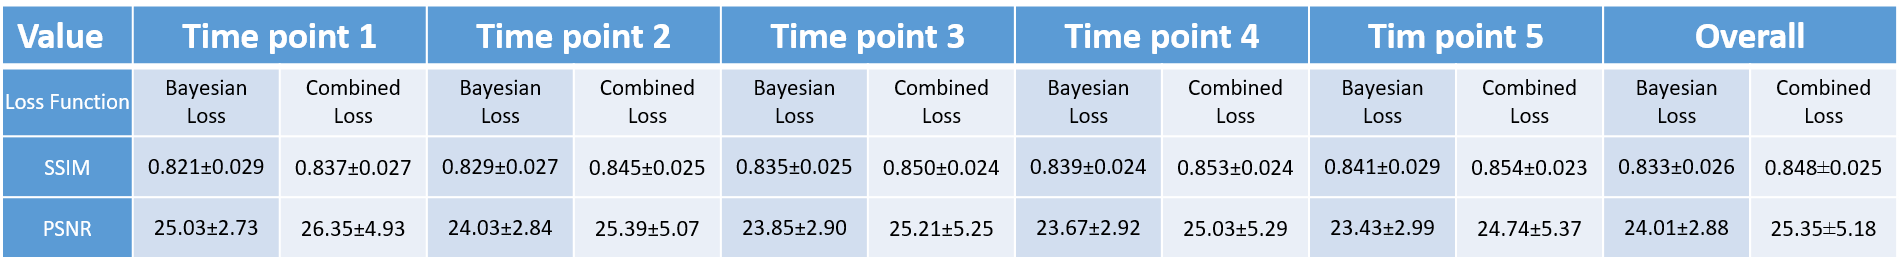
Table 1: Mean SSIM and mean PSNR over the whole test group for the each different time point generated using the vDCE with both loss functions. An overall decrease of the PSNR and an increase of the SSIM value can be noted in the later time points. The Combined loss function shows slightly higher SSIM and PSNR values.