1521
Predicted tumor stroma segmentation from high-field MR texture maps and machine learning: an ex vivo study on ovarian tumors1Montpellier Cancer Research Institute (IRCM), INSERM U1194, University of Montpellier, Montpellier, France, 2Department of pathology, Montpellier Cancer Institute (ICM), Montpellier, France, 3BNIF facility, L2C, UMR 5221, CNRS, University of Montpellier, Montpellier, France, 4Department of Surgery, Montpellier Cancer Institute (ICM), Montpellier, France
Synopsis
The objective was to probe the associations of high-field MR-images and their derived texture maps (TM) with histopathology in ovarian cancer (OC). Four ovarian tumors were imaged ex-vivo using a 9.4T-MR scanner. Automated MR-derived stroma-tumor segmentation maps were constructed using machine learning and validated against histology. Through TM, we found that areas of tumor cells appeared uniform on MR-images, while areas of stroma appeared heterogeneous. Using the automated model, MRI predicted stromal proportion with an accuracy from 61.4% to 71.9%. In this hypothesis-generating study, we showed that it is feasible to resolve histologic structures in OC using ex-vivo MR radiomics.
Purpose
High-grade serous ovarian cancer (HGSOC) is the most prevalent histological subtype of ovarian cancer1. Response to neoadjuvant treatment at histopathology manifests as an increase of stromal tissue and decreased of tumor cells but those changes cannot be assessed on clinical imaging2. Radiomic analysis extracts large amount of quantitative data and has the potential to uncover salient features that are imperceptible to human observers, yet possibly reflective of microscopic changes in tumor in response to treatment3. It is now well established that the stroma contributes to ovarian tumorigenesis and progression4. Being able to assess the stroma-tumor ratio in a non-invasive way with radiomics may open a new pathway in assessing tumor response in HGSOC. The aim of this proof-of-concept study was to evaluate the correlation between tumor-stroma maps derived from high-field MR images and whole histopathology slide images (WHSI) of histopathologic specimens and to develop an automated visual map of stromal proportion in HGSOC peritoneal implants using quantitative analysis of MR images.Methods
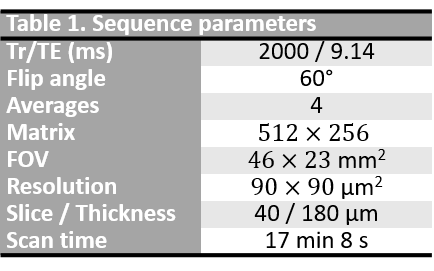
Four peritoneal implants were excised from patient with HGSOC and fixed in formalin solution. Fixed specimens were immersed in saline with 1% Gd-BOPTA during 1h, then in fluorinert solution to be imaged with a 9.4T-MR scanner. Images were acquired using a T1w fat-suppressed gradient-echo sequence with a voxel resolution of $$$90\times 90 \times 180$$$ µm3 with sequence parameters presented in Table 1. Images were preprocessed following IBSI guidelines5. Texture feature maps were extracted on a per-pixel basis with an in-house software implemented in Matlab: gray level co-ocurence matrix was computed for each pixel using the 3 neighboring pixels of each direction, allowing the extraction of 13 Haralick feature maps. After MR experiments, excised implants were cut into 4µm sections according to MRI slice plane for histology analysis. Stroma and tumor regions were segmented on histology and stromal proportion was assigned to each pixel by measuring this proportion in a circular neighborhood with radius of 3 pixels. Histology images were aligned on MR images using a non-linear registration with 3D-Slicer, allowing a pixel-wise comparison. Pixels were labelled as stroma-rich (stromal proportion>50%) and stroma-poor (stromal proportion<50%), leading to a common classification table with 58946 pixels associated with 14 inputs (13 features and their label). 50% of the pixels were randomly selected to train the machine learning model with balanced number of stroma-rich and –poor pixels; the 50% remaining pixels was used to test the algorithm. Classification model was completed using SVM classifier and 20-fold cross-validation, with classification learner toolbox of Matlab 2020a. Finally, this trained algorithm was applied to the 4 tumors separately to generate predicted segmentation maps and were compared to the stroma-rich and -poor segmentations, extracted from the histopathologic images.Results
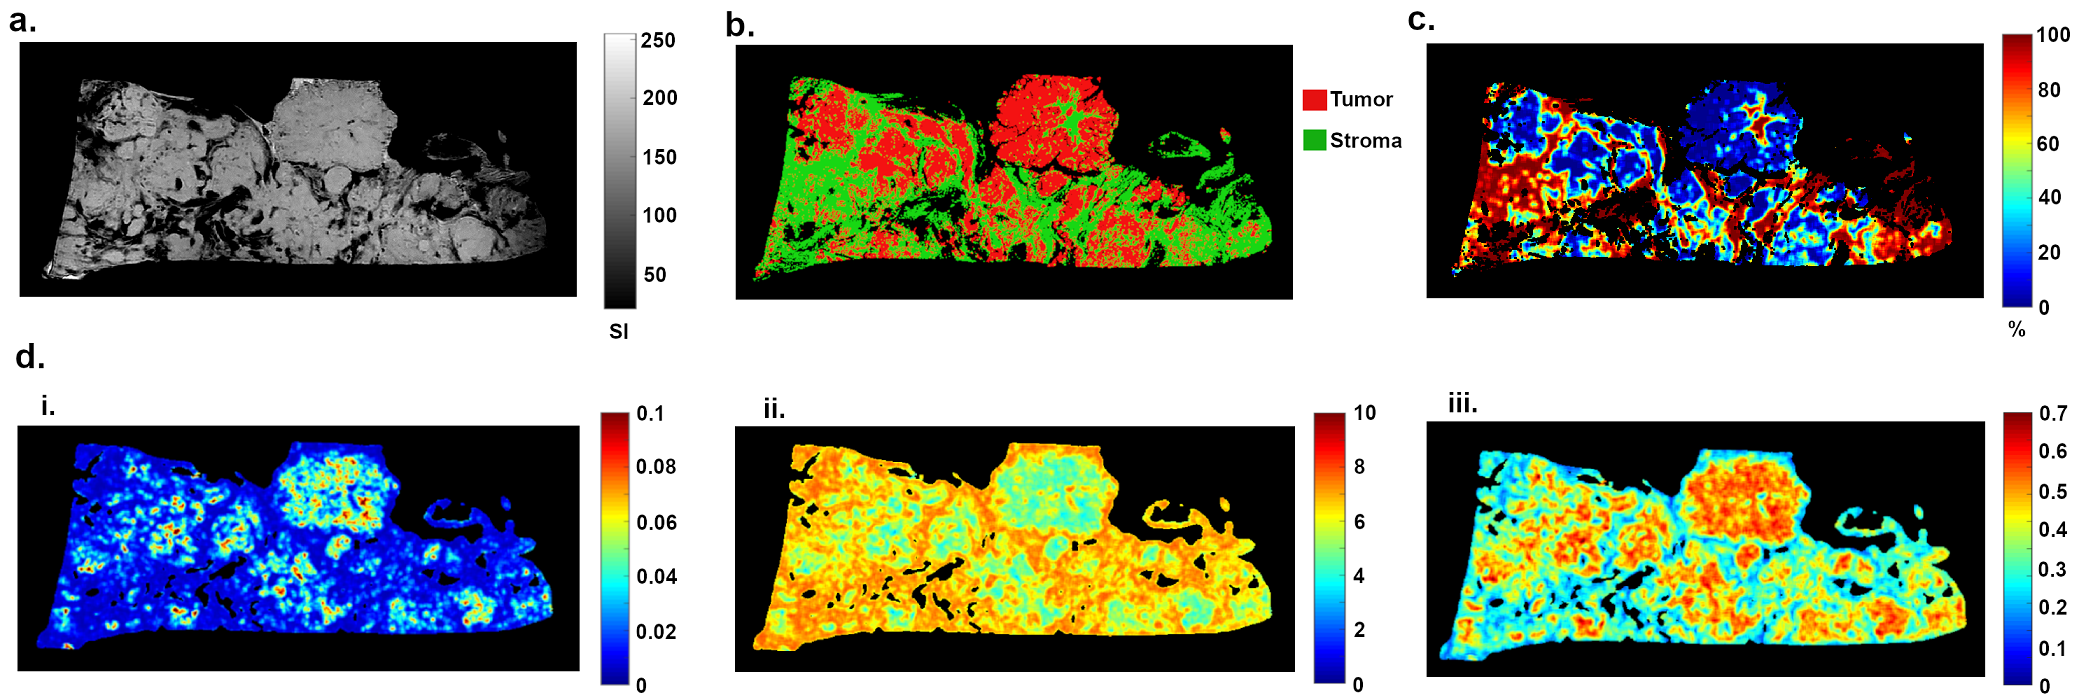
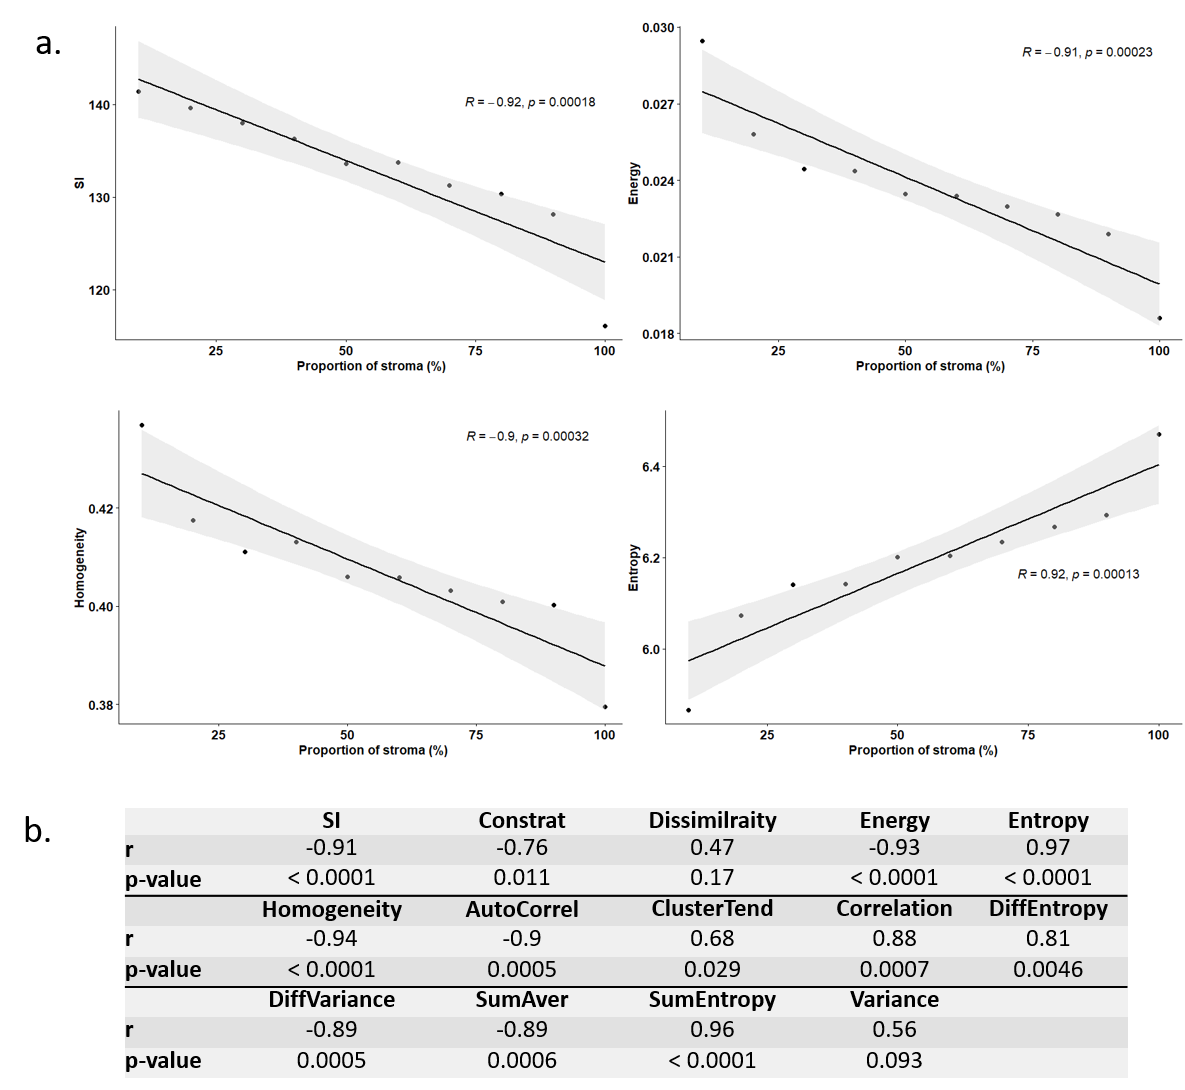
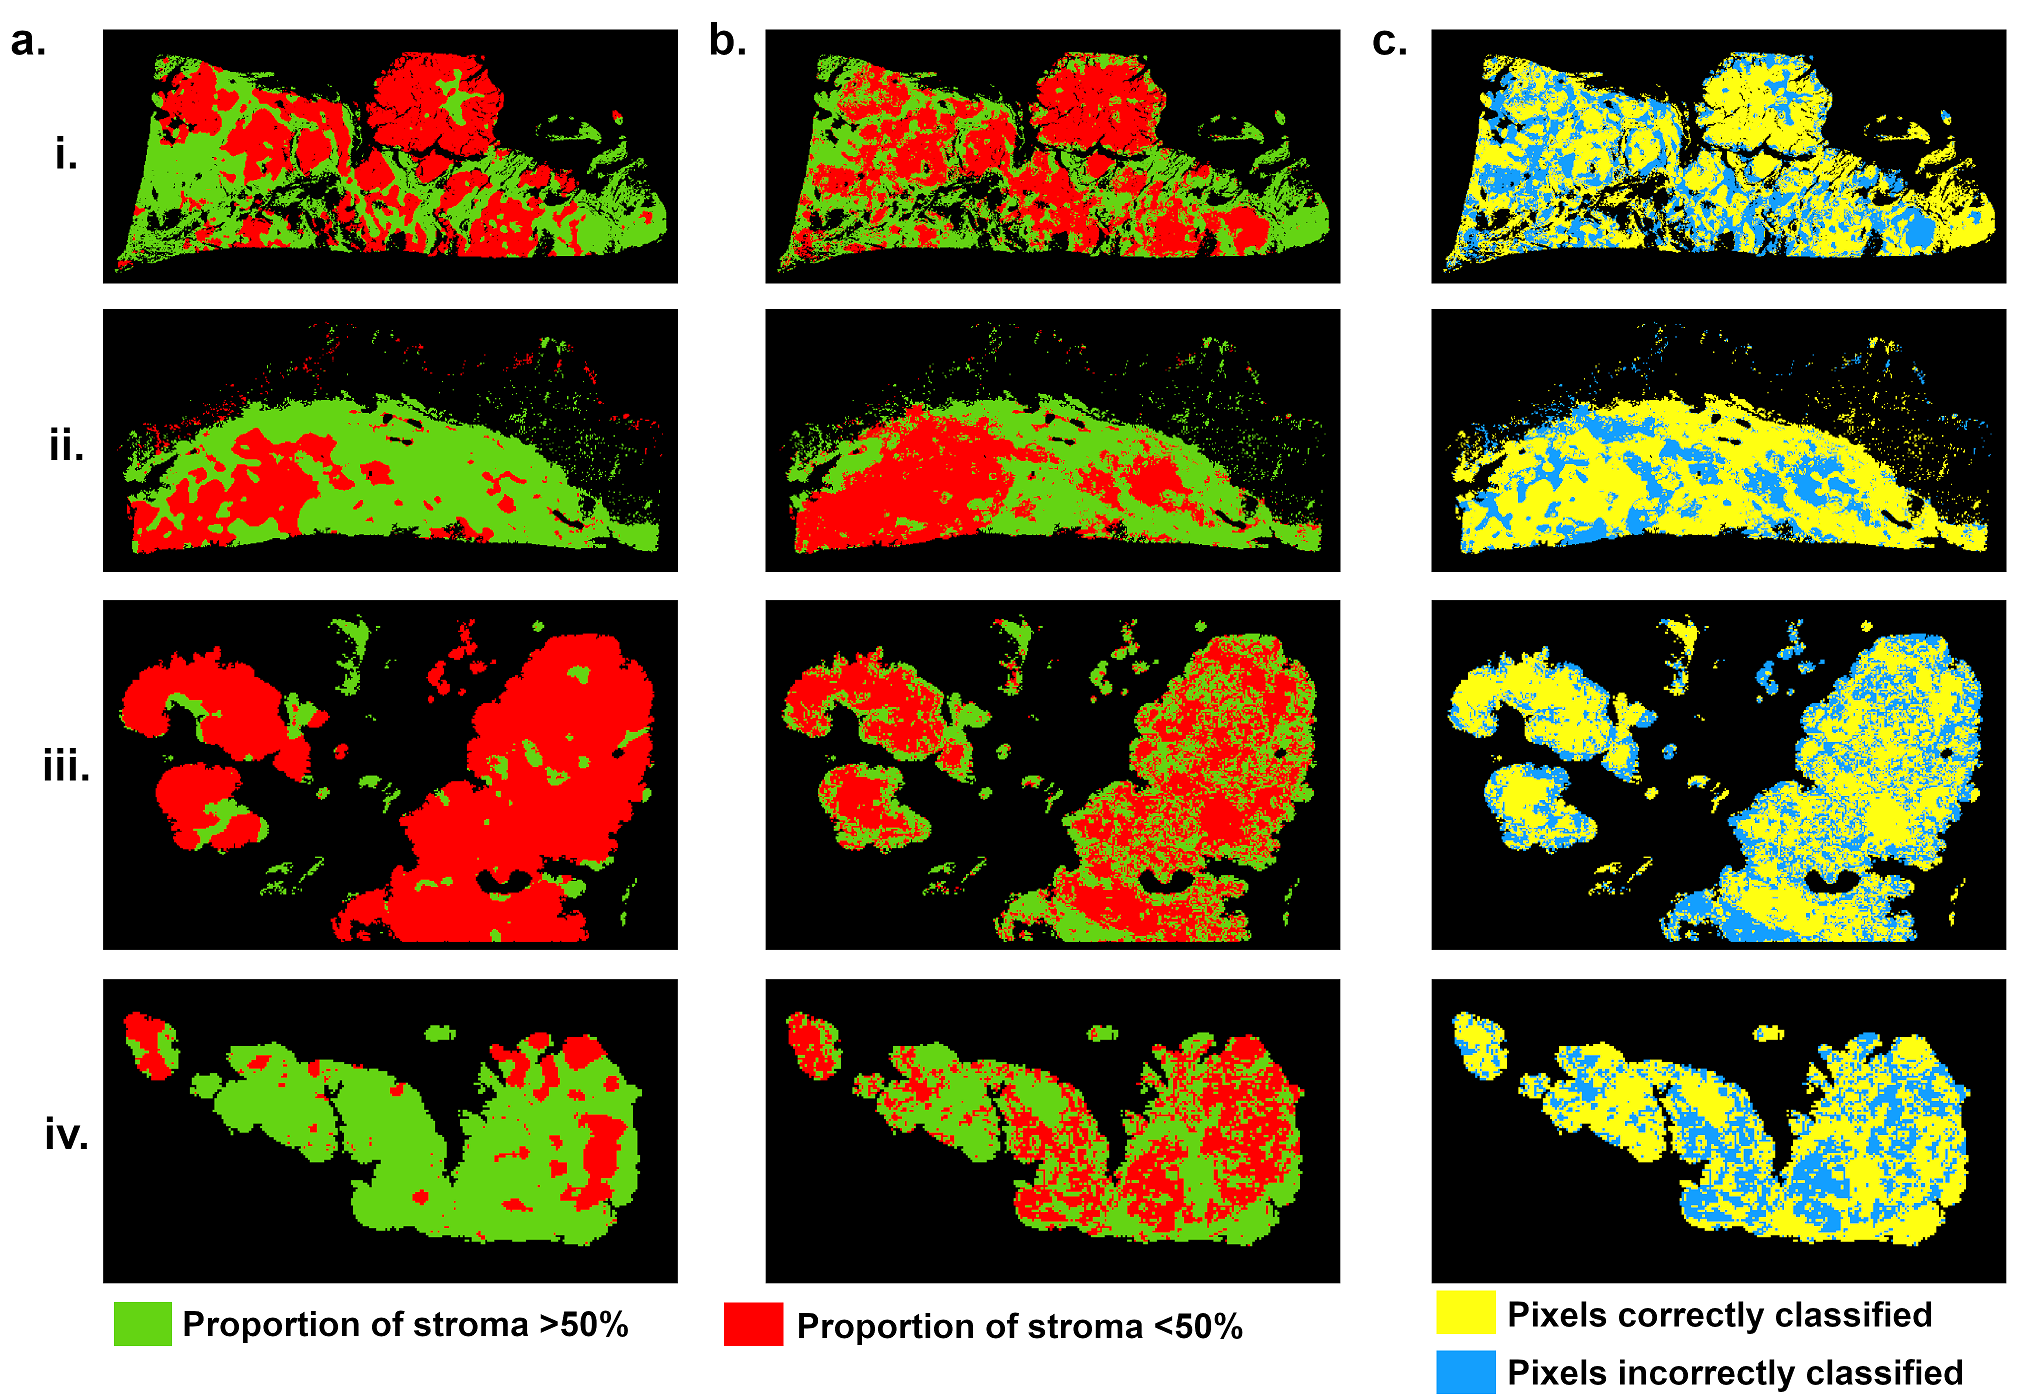
Figure 1 illustrates energy, entropy and homogeneity maps from a representative peritoneal carcinomatosis implant, with corresponding tumor-stroma segmentation and stromal proportion maps. Stromal proportion map was divided into increments of 10 percentage points and mean texture values were calculated for these 10 regions. Correlation plots between mean texture feature values and stromal proportion were constructed (Figure 2.a) and Pearson’s correlation coefficients with corresponding p-values were then determined (Figure 2.b). Estimated segmentation maps were performed using the training SVM model and are presented in Figure 3 with their corresponding stroma-rich and –poor histological segmentations, allowing confusion matrix calculation (Table 2). An accuracy for predicting stromal proportion from MRM images ranged from 61.4 to 71.9% on the holdout test data.Discussion
In our study, we correlated radiomics features with tumour/stromal proportion pixel-by-pixel. Here, entropy, correlation, difference entropy and sum entropy radiomics features were positively associated with stromal proportion while MR signal intensity, energy, homogeneity, auto correlation, difference variance and sum radiomics features were positively associated with tumor proportion. Energy feature is high when MR image grayscale is uniform; in contrast, entropy value is high when the MR image is disorderly. In this work, we found that areas of tumor cells appeared uniform on MR images, while areas of stroma appeared heterogeneous. Those radiomics features associated with stroma heterogeneity may be explained by stroma neoangiogenesis known to be disorderly and the consistence of the stroma itself. In this work, we built a model allowing to compute a visualize map of estimated stromal and tumor regions from MR images. The 4 generated predicted segmentation maps were compared to the actual segmentation maps measured from histology and found a good accuracy (61.4% to 71.9%). Relative low accuracy values can be explained by the presence of histological structures not taken into account in the model training, such as glandular lumens resulting in signal loss. These values can also be explained by the difference of slice thickness between MR and histological images, with a factor of 45%. Finally, predicted segmentation maps allowed us to assess the stroma-tumor ratio by ex-vivo imaging. Multiple studies have demonstrated the importance of stroma in ovarian tumorigenesis, progression and in reduced overall survival6. Future on-going work will try to translate this ex-vivo findings to in-vivo real time evaluation from 1.5 or 3T scanners used in clinical routine.Conclusion
In this proof of concept study, high-field MRI with radiomics analysis allowed us to associate texture features to tumor and stromal proportionAcknowledgements
This research was funded by foundation de l’Avenir grant and SIRIC Montpellier Cancer Grant INCa-DGOS-Inserm_12553.References
1. Torre L A, Trabert B, DeSantis C E, et al. Ovarian cancer statistics, 2018. CA: a cancer journal for clinicians. 2018 ; 68(4),: 284-296.
2. Jacob F, Marchetti R L, Kind A B, et al. High‐grade serous peritoneal cancer follows a high stromal response signature and shows worse outcome than ovarian cancer. Molecular Oncology. 2021; 15(1), 91-103.
3. Lambin P, Rios-Velazquez E, Leijenaar R, et al. Radiomics: extracting more information from medical images using advanced feature analysis. European journal of cancer. 2012 ; 48(4), 441-446.
4. Greenaway J, Moorehead R, Shaw P, Petrik J. Epithelial–stromal interaction increases cell proliferation, survival and tumorigenicity in a mouse model of human epithelial ovarian cancer. Gynecologic oncology. 2008; 108(2), 385-394.
5. Zwanenburg A, Leger S, Vallières M, Löck S. Initiative for the IBS. Image biomarker standardisation initiative. 2016.
6. Labiche A, Heutte N, Herlin P, et al. Stromal compartment as a survival prognostic factor in advanced ovarian carcinoma. International Journal of Gynecologic Cancer. 2010 ; 20(1).
Figures