1520
A Deep Neural Network for Detection of Glioblastomas in Spectroscopic MRI
Erin Beate Bjørkeli1,2, Jonn Terje Geitung1,2, and Morteza Esmaeili1,3
1Department of Diagnostic Imaging, Akershus University Hospital, Oslo, Norway, 2Institue of Clinical Medicine, University of Oslo, Oslo, Norway, 3Department of Electrical Engineering and Computer Science, University of Stavanger, Stavanger, Norway
1Department of Diagnostic Imaging, Akershus University Hospital, Oslo, Norway, 2Institue of Clinical Medicine, University of Oslo, Oslo, Norway, 3Department of Electrical Engineering and Computer Science, University of Stavanger, Stavanger, Norway
Synopsis
We have developed a MRSI spectra classifying convolutional neural network (CNN), building on the AUTOMAP model for image and spectra reconstruction. The model was trained to discern between non-water-suppressed spectra from healthy subjects and glioblastoma (GBM) patients. The trained CNN was able to classify the spectra correctly and seemed to recognize the healthy spectra based on the NAA-peak and the GBM based on the choline levels and possibly 2HG, indicating an IDH mutation.
Introduction:
Magnetic resonance spectroscopy imaging (MRSI) is a powerful technique for imaging the various metabolites within living tissue and can aid in the detection and grade prediction of pathologies such as tumors [1]. Glioblastomas (GBM) are one pathology of interest, and in MRSI they can be observed by a reduction in NAA and creatine and increased choline.The implementation of MRSI, however, is fundamentally challenged in the acquisition and analysis steps, and it is limited by the signal-to-noise ratio and low spatial resolution.The success of Deep Learning (DL) approaches in MRSI in recent years is promising for a resolution to these problems. The automation of the MRSI data acquisition and analysis will both be time-saving and make the process more available for clinics while limiting the necessity for multiple third-party programs. DL models have for example been successfully trained to classify spectra based on whether they are of sufficient quality for clinical assessments [2] or discern between mutation statuses in gliomas [3].The purpose of this project is to develop and train a convolutional neural network (CNN) for distinguishing between MRSI spectra based on their belonging to GBM patients or healthy subjects.Materials and Methods:
Dataset: The data used for training the model consists of data sets: the first one is data from two glioblastoma (GBM) patient with 7939 spectra, both with known IDH mutation [4]; the other dataset is from a healthy subject with 11251 spectra. Both are acquired by FID-MRSI. With each spectra having a real and an imaginary part gives a total of 38380 spectra, all with 1024 time points. The data were not water suppressed, which means the water signal will be magnitudes larger than that of metabolites of interest, which could complicate the fitting. A label with one-hot encoding has been added to the spectra to mark them as belonging to the GBM or the healthy group. Methods: We constructed a CNN (described in Figure 1), inspired by the AUTOMAP network [5] which we have adapted for the one-dimensional data. The model consists of three fully connected layers with hyperbolic tangent activation followed by two convolutional layers with ReLU activation [6] and a deconvolution. To adapt the model for the binary classification task, two fully connected layers, with ReLU and sigmoid activation respectively, were added at the end of the model. Model training was performed using binary cross entropy as loss function, and was optimized using the Adam optimizer [7], with a batch size of 200, a learning rate of 5e-5, and 10 epochs. The real and imaginary parts of the data were trained separately in the same model. Gradient-weighted class activation mapping (Grad-CAM) was used to highlight which parts of the spectra contributed most to the classification.Results:
The model was validated on an unused test data set (n=7676 spectra, 20%) and the ROC curve for the test set can be seen in Figure 2. The confusion matrix for the same spectra is provided in Figure 3. Misclassified spectra seemed to fall into two main categories: 1) No signal or 2) Low signal with broad line shape. Idealized healthy and GBM spectra were created by sampling 50 consecutive spectra for each group and taking their average for spectra with increased SNR. Grad-CAM was run on these to visualize how the model’s decision-making. Due to the one-hot encoding the model will evaluate whether a spectrum is healthy and whether it is GBM separately; each of the decisions can be seen in Figure 4. The model was interested in the are close to the choline peak to evaluate if the spectrum was GBM. The area around 2.25 ppm was also lit up, which could indicate 2HG. To evaluate if the spectra was healthy, more of the spectrum was activated and the areas around NAA were most closely considered.Discussion and Conclusion:
In this work, we have proposed an extension of AUTOMAP’s data reconstruction framework to classification problems and presented some preliminary results. The model is precise in its classification, but a clearer output from the Grad-CAM and more strongly highlighting the areas an expert would focus on, is desirable for increased model interpretability. These two factors might suggest some data leakage, i.e. that the model have recognized some difference between the two classes that are not relevant for this task. More data is necessary to control for this, but also transfer learning could be deployed for guiding the model towards the areas of interest. However, the possible highlighting of 2HG is very interesting as this is a marker for IDH mutation, which should be present in both GBM patients.As the SNR affects the model’s performance, so a next step might be to develop the model further to first discharge low quality spectra from the training set to increase the robustness of the model. A robust classification model would be able to reduce analysis-time for MRSI data, which could be of great use in the diagnosing and monitoring of various pathologies, such as the glioblastomas in this case.Acknowledgements
This work was funded by the Helse Sør-Øst RHF – Southern Eastern Norway Regional Health Authority (HSØ, grant numbers 2018047 to M.E. and 2021023 to E.B.B.).References
- Chronaiou, I., et al., Impacts of MR spectroscopic imaging on glioma patient management. Acta Oncol, 2014. 53(5): p. 580-9.
- Gurbani, S.S., et al., A convolutional neural network to filter artifacts in spectroscopic MRI. Magn Reson Med, 2018. 80(5): p. 1765-1775.
- Bangalore Yogananda, C.G., et al., A novel fully automated MRI-based deep-learning method for classification of IDH mutation status in brain gliomas. Neuro Oncol, 2020. 22(3): p. 402-411.
- Hingerl, L., et al., Clinical High-Resolution 3D-MR Spectroscopic Imaging of the Human Brain at 7 T. Invest Radiol, 2020. 55(4): p. 239-248.
- Zhu, B., et al., Image reconstruction by domain-transform manifold learning. Nature, 2018. 555(7697): p. 487-492.
- Agarap, A.F., Deep Learning using Rectified Linear Units (ReLU). arXiv, 2019.
- Kingma, D.P. and J.L. Ba, Adam: A Method for Stochastic Optimization. arXiv, 2014.
Figures

Figure 1: Architecture of the CNN. The model is based on the AUTOMAP structure, but fully connected layers have been added at the end of the model.

Figure 2: Receiver-operator characteristic curve (ROC), with area under the curve (AUC) of 0.975.
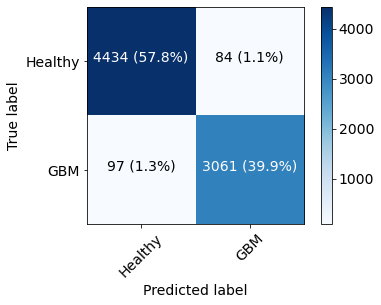
Figure 3: Confusion matrix of the test set shows that most spectra were correctly classified with few false positives (1.1% of total, 2.7% of predicted GBM) and few false negatives (1.3% of total, 2.1% of predicted healthy).

Figure 4: Grad-CAM of idealized spectra. Top left: Healthy spectrum classified as "not GBM". Top right: Healthy spectrum classified as "healthy". Area around NAA peak (2.0 ppm) is most active. Bottom left: Glioblastoma spectrum classified as "GBM". Bottom right: Glioblastoma spectrum classified as “not GBM”.
DOI: https://doi.org/10.58530/2022/1520