1517
Machine learning based classification of major depressive disorder using clinical symptom scales and ultrahigh field MRI features1Biomedical Engineering and Imaging Institute, Icahn School of Medicine at Mount Sinai, New York, NY, United States, 2Computer Science, University of Kentucky, Lexington, KY, United States, 3Psychiatry, Icahn School of Medicine at Mount Sinai, New York, NY, United States, 4Diagnostic, Molecular and Interventional Radiology, Icahn School of Medicine at Mount Sinai, New York, NY, United States, 5Radiology, University of Missouri, Columbia, MO, United States
Synopsis
Major depression is highly-prevalent disorder with frustratingly-high rates of treatment resistance. Ultrahigh field imaging may provide objective quantitative biomarkers for characterizing depression, generating insight into clinical phenotypes of this heterogeneous disease. Forty-two major depressive disorder patients currently off anti-depressant treatment were recruited for scanning at ultrahigh field, and given batteries of clinical symptom measures. Machine-learning clustering analysis was performed to group patients by clinical symptoms and differences in imaging features observed. A separate analysis was performed in the reverse direction clustering on quantified imaging features and identifying clinical differences between clusters, including differences in ruminative response between the patient clusters.
Introduction
Major Depressive Disorder (MDD) is a debilitating illness associated with feelings of sadness or apathy, high suicide rate and disturbances in sleep and appetite. MDD affects roughly one in six people (16.6%) over a lifetime with one in fifteen adults (6.7%) estimated to experience depression in a given year [1-4]. Unfortunately, a majority (50-60%) of depression patients experience treatment-resistant depression (TRD), receiving inadequate response from antidepressant treatments [5]. While underlying mechanisms of treatment resistance aren't fully-understood, medical comorbidities and heterogeneity in depressive severity or subtype may be contributing factors [6].Magnetic Resonance Imaging (MRI) can non-invasively characterize neuroanatomy and neuropathology. Because MRI signal quality and imaging resolution is directly proportional to field strength, scanning at 7T may facilitate more accurate visualization of small imaging features compared to 1.5T/3T. Better contrast between cortical and subcortical volumes may facilitate more reliable quantification of anatomical structures. Combined with automated whole-brain segmentation and data-driven, machine-learning based classification algorithms, 7T MRI can provide accurate and reliable information about subtle morphological changes in depression patients.
Machine learning analysis was implemented to classify imaging-derived subtypes of depression, and investigate their relationships to clinical subtypes of depression. A second arm of the study applies a machine-learning analysis in the reverse direction, clustering on clinical symptom scales and probing the imaging characteristics of the derived clusters. The anti-depressant treatment history of the patients clustered by each method (both imaging-derived and based on clinical symptom scales) was also probed. This study leverages7T MRI resolution and image quality to investigate correlations between imaging features and symptom measures and how both relate to treatment response.
Materials & Methods
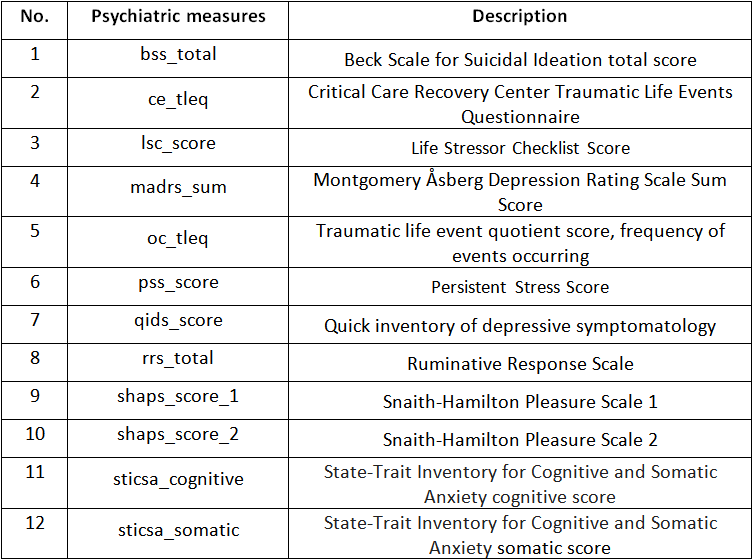
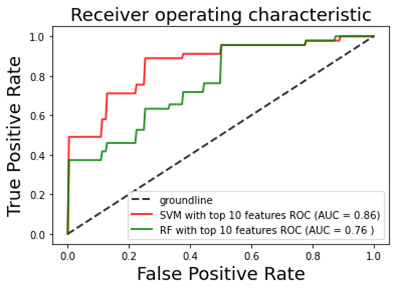
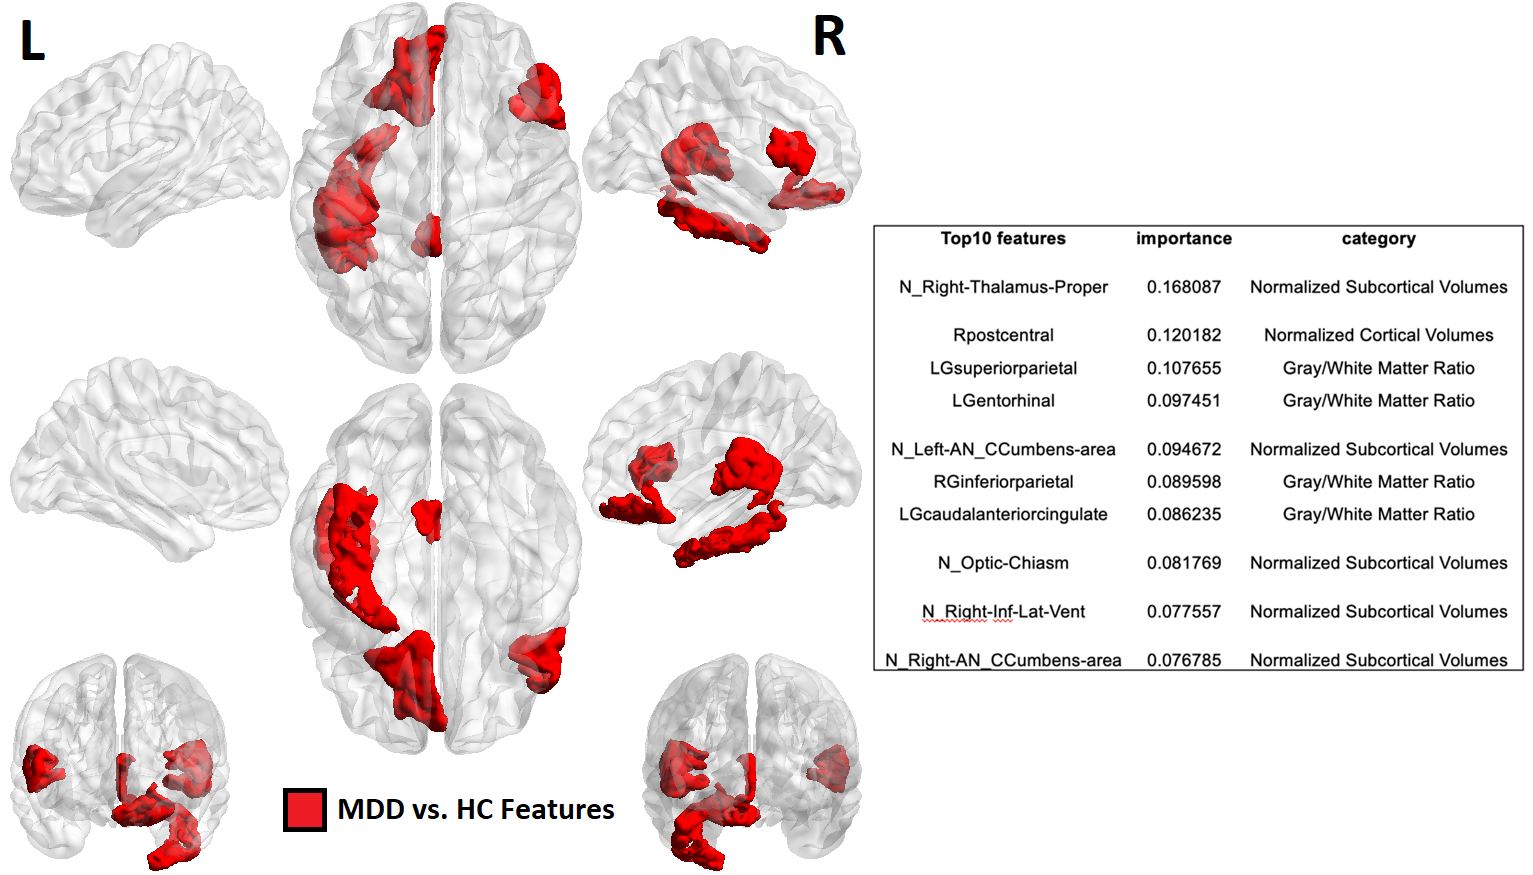
Patients with MDD clinically diagnosed by a board-certified psychiatrist were recruited for this study along with age/gender matched healthy controls. Subjects taking anti-depressant medication or recreational drugs were excluded, as were participants for who MRI was contra-indicated. Forty-two MDD patients (16F/28M, 38.2±11.5 years) and forty-six healthy controls (18F/28M, 37.0±10.5 years) were scanned on a Siemens Magnetom 7T whole-body MRI scanner (Siemens Healthineers, Erlangen, Germany) with a 32Rx/1Tx channel Nova head coil (Nova Medical, Wilmington, MA). The primary anatomical imaging study was T1-weighted magnetization rapid gradient-echo (MPRAGE) sequence with the following parameters: echo time (TE) = 3.62s, repetition time (TR) = 6000ms, field-of-view (FOV) = 224x168 mm3, array size = 320x240, slices = 240, voxel size = 0.7 mm3 isotropic, acquisition time = 7:26 minutes. In addition to imaging, twelve clinical measures were acquired (Table 1) to measure depressive symptomology.Automated segmentation was performed using FreeSurfer and 175 imaging metrics were recorded in four categories: cortical thickness, cortical gray/white matter ratios, normalized cortical volume and normalized subcortical volume. In arm 1 (performed among MDD patients) linear regression models were computer correlating imaging features to clinical measures while controlling for age and gender. Imaging metrics highlighted by this analysis were forwarded to a hierarchical clustering model to separate MDD patients into two clusters, and these clusters were analyzed in terms of demographic characteristics and clinical scales. In arm 2, supervised learning was performed
Results & Discusssion
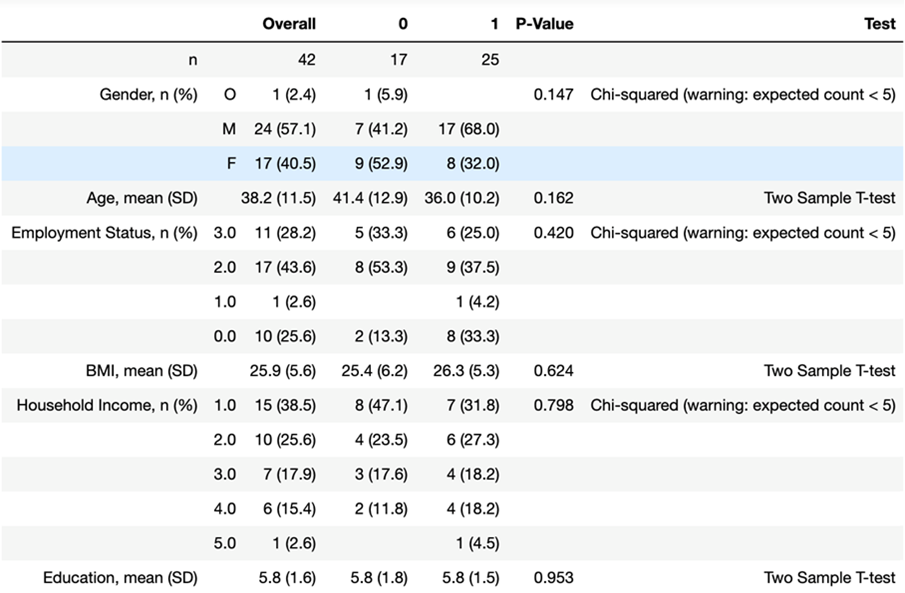
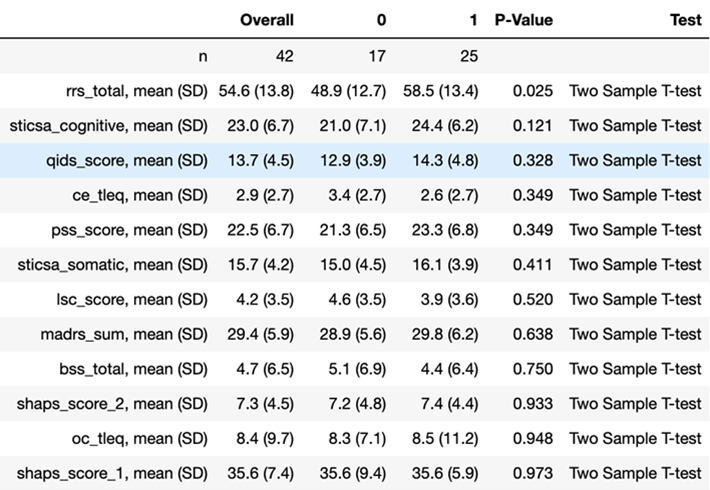
In Arm 1, three clinical measures: BSS, LSC and RRS clustered MDD patients into two significantly-different clusters. Hierarchical clustering using BSS produced clusters of size n=27 (C0) and n=15 (C1) with significant differences in BSS scores (p=9.8e-5). These two clusters also showed significant differences between precentral gyrus gray/white matter ratios and normalized volumes of insula and pars opercularis. Clustering using LSC score generated clusters of size n=23 (C0) and n=19 (C1) with significantly-different values for LSC (p=0.034). Imaging metrics showing significant differences among these two clusters included gray/white matter ratios of left isthmus cingulate, right precuneus and left caudal anterior cingulate. Left isthmus cingulate also showed significantly-different normalized cortical volume between the two clusters. Clustering using RRS generated clusters of size n=29 (C0) and n=13 (C1) with significantly-different RRS score (p=0.009). These clusters showed significant differences in normalized volume of right fusiform gyrus, left pars triangularis and left inferior parietal lobe. As age and gender were adjusted as confounding variables, generated clusters showed no significant between-group differences among those categories.Arm 2 clustered MDD patients by imaging data generating two clusters, C0 and C1, described demographically and clinically in figures 2-3. Following removal of principal component tied closest to age, the resultant clusters on PC2 and PC3 showed no major differences between the groups in terms of age or other demographic characteristic. Of the twelve clinical scales measured, Arm 2 clusters showed between-group difference in RRS. Though non-significant, C0 tended to be an older and gender-balanced group with later onset age and lower scores for RRS and cognitive anxiety measures. By contrast, C1 was predominantly female both younger with earlier onset and higher RRS and cognitive anxiety measures.
Conclusion
High image resolution and signal quality facilitated by ultrahigh field MRI was leveraged to perform clustering of major depression patients into clinical and imaging-derived phenotypes. Arm 1 clustered patients by clinical measures, identifying imaging features with significant differences between the clusters. Arm 2 clustered patients by imaging metric and found significant differences in RRS between the two clusters.Acknowledgements
The authors would like to acknowledge funding from NIH R01 MH109544.References
1. Kessler, R.C., et al., Lifetime prevalence and age-of-onset distributions of DSM-IV disorders in the National Comorbidity Survey Replication. Archives of general psychiatry, 2005. 62(6): p. 593-602.
2. Kessler, R.C., et al., The epidemiology of major depressive disorder: results from the National Comorbidity Survey Replication (NCS-R). Jama, 2003. 289(23): p. 3095-3105.
3. Spaner, D., R. Bland, and S. Newman, Major depressive disorder. Acta Psychiatrica Scandinavica, 1994. 89: p. 7-15.
4. Greenberg, P.E., et al., The economic burden of adults with major depressive disorder in the United States (2010 and 2018). Pharmacoeconomics, 2021: p. 1-13.
5. Fava, M., Diagnosis and definition of treatment-resistant depression. Biological psychiatry, 2003. 53(8): p. 649-659.
6. Insel, T.R. and B.N. Cuthbert, Brain disorders? precisely. Science, 2015. 348(6234): p. 499-500.
7. Silhouettes: A graphical aid to the interpretation and validation of cluster analysis. J. Comput. Appl. Math. 20, 53–65 (1987).
8. Caliński, T. & Harabasz, J. A dendrite method for cluster analysis. Commun. Stat. Simul. Comput. 3, 1–27 (1974).
9. Davies, D. L. & Bouldin, D. W. A cluster separation measure. IEEE Trans. Pattern Anal. Mach. Intell. 1, 224–227 (1979).
10. Von Luxburg, U. A tutorial on spectral clustering. Stat. Comput. 17, 395–416 (2007).
11. D’agostino, R. & Pearson, E. S. Tests for departure from normality. Empirical results for the distributions of b2 and √b1. Biometrika 60, 613–622 (1973).
Figures