1516
Differentiation of IDH and TERTp mutations in Glioma Using Dynamic Susceptibility Contrast MRI with Machine Learning at 3T
Buse Buz-Yalug1, Ayca Ersen Danyeli2,3, Cengiz Yakicier3,4, Necmettin Pamir3,5, Alp Dincer3,6, Koray Ozduman3,7, and Esin Ozturk-Isik1
1Institute of Biomedical Engineering, Bogazici University, Istanbul, Turkey, 2Department of Medical Pathology, Acibadem Mehmet Ali Aydinlar University, Istanbul, Turkey, 3Center for Neuroradiological Applications and Reseach, Acibadem Mehmet Ali Aydinlar University, Istanbul, Turkey, 4Department of Molecular Biology and Genetics, Istanbul, Turkey, 5Department of Neurosurgery, Acibadem Mehmet Ali Aydinlar University, Istanbul, Turkey, 6Department of Radiology, Acıbadem Mehmet Ali Aydinlar University, Istanbul, Turkey, 7Department of Neurosurgery, Acıbadem Mehmet Ali Aydinlar University, Istanbul, Turkey
1Institute of Biomedical Engineering, Bogazici University, Istanbul, Turkey, 2Department of Medical Pathology, Acibadem Mehmet Ali Aydinlar University, Istanbul, Turkey, 3Center for Neuroradiological Applications and Reseach, Acibadem Mehmet Ali Aydinlar University, Istanbul, Turkey, 4Department of Molecular Biology and Genetics, Istanbul, Turkey, 5Department of Neurosurgery, Acibadem Mehmet Ali Aydinlar University, Istanbul, Turkey, 6Department of Radiology, Acıbadem Mehmet Ali Aydinlar University, Istanbul, Turkey, 7Department of Neurosurgery, Acıbadem Mehmet Ali Aydinlar University, Istanbul, Turkey
Synopsis
Isocitrate dehydrogenase (IDH) and telomerase reverse transcriptase promoter (TERTp) mutations highly affect the clinical outcome in gliomas. The aim of this study was to identify IDH and TERTp mutations in glioma patients using machine learning approaches on relative cerebral blood volume (rCBV) maps obtained from dynamic susceptibility contrast MRI (DSC-MRI). The highest classification accuracy was 87.2% (sensitivity = 85.7%, specificity = 88.9%) for the IDH subgroup, 81.8% accuracy (sensitivity = 77.5%, specificity = 86.4%) was obtained for classifying the TERTp subgroup. Additionally, a classification accuracy of 89.6% (sensitivity = 88.3%, specificity = 91.2%) was obtained for identifying the TERTp-only gliomas.
Introduction
Isocitrate dehydrogenase (IDH) and telomerase reverse transcriptase promoter (TERTp) mutations highly affect the prognosis and clinical outcome in gliomas.1-4 While IDH mutant (IDH-mut) gliomas have a better treatment response and outcome, TERTp-only gliomas, who have the TERT mutation without the presence of an IDH mutation, have been reported to have the worst overall survival.2 Recent studies have shown that the IDH mutation is associated with tumor angiogenesis, and it could be predicted using rCBV maps obtained from DSC-MRI.5, 6 Moreover, TERTp mutation has been associated with the aggressiveness of gliomas7, for which DSC-MRI might be useful for prediction. Therefore, this study aims to define possible brain perfusion-based signatures for the identification of IDH and TERT mutations in gliomas using rCBV maps with machine learning algorithms.Methods
The patient cohort included 106 glioma patients in this IRB approved study (36F/70M, mean age = 47.6 ± 13.5 years, 66 IDH-wild, 40 IDH-mutant, 38 TERTp-mutant, 50 TERTp-wild, 56 TERTp-only). The patients were scanned on a 3T clinical MR scanner (Siemens, Erlangen, Germany) using a 32-channel head coil before surgery. The brain tumor protocol included pre- and post-contrast (gadolinium DTPA) T1-weighted TSE (TR=500 ms, TE=10 ms), T2-weighted TSE (TR=5000 ms, TE=105 ms), and T2*-weighted gradient-echo echo-planar imaging (EPI) dynamic susceptibility contrast (DSC) MRI (TR=1500 ms, TE=30 ms). IDH and TERTp mutations in the tissue were determined by either minisequencing or Sanger sequencing. The whole tumor volumes were segmented on FLAIR images while the necrosis volumes were segmented on T1-weighted post-contrast MRI using 3D slicer version 4.8.1 (http://slicer.org/). The tumor and necrosis images of each subject were registered to the rCBV maps using FMRIB Software Library (FSL; http://fsl.fmrib.ox.ac.uk/fsl/fslwiki/). The histogram properties, including the mean, median, standard deviation, kurtosis and skewness, of the rCBV pixel values within the tumor regions were calculated using an in-house program written in MATLAB 2020a (The MathWorks Inc., Natick, MA). A Mann Whitney U test was applied to detect statistically significant differences between the three molecular subsets of gliomas defined either based on IDH and TERTp mutations or TERTp mutation only. Then, the histogram properties were used as input features and supervised machine learning algorithms were used in the Classification Learner application of MATLAB with five-fold cross-validation. Moreover, an in-house program was written to automatically convert the segmented ROI into an RGB image including the slice with the largest tumor area, and the former and the latter slices (Figure 1), and the features coming from the resultant RGB images were also used for classification. The overall classification accuracy, specificity and sensitivity were calculated.Results
Using six features coming from the pixel-wise analysis, only the skewness of the rCBV values was statistically significantly different between IDH-mut and IDH wildtype (IDH-wt) gliomas (p<0.01). There were no other statistically significant differences in rCBV values between the molecular subgroups (Table 1). The IDH-mut and IDH-wt gliomas were classified with 84.6% accuracy (sensitivity = 93.7%, specificity = 70.0%) using a linear discriminant analysis on rCBV maps. Additionally, the TERTp mutant (TERTp-mut) and TERTp wildtype (TERTp-wt) subgroups were classified with 81.8% accuracy (sensitivity = 90%, specificity = 75%) using ensemble methods on rCBV maps. Moreover, the classification accuracy of TERTp-only gliomas vs others was 68.2% (sensitivity = 71.4%, specificity = 62.5%) using support vector machines on rCBV maps. On the other hand, using RGB image features resulted in higher classification accuracies. The IDH mutational subgroups were classified with 87.2% accuracy (sensitivity = 85.7%, specificity = 88.9%) using k nearest neighbors, while the TERTp mutational subgroups were classified with 81.8% accuracy (sensitivity = 77.5%, specificity = 86.4%) using the same algorithm. Additionally, the classification accuracy of TERTp-only gliomas vs others was 89.6% (sensitivity = 88.3%, specificity = 91.2%) using bagged trees (Table 2).Conclusion and Discussion
The results of this study indicated that both IDH and TERTp molecular subsets of gliomas could be classified using rCBV maps acquired from DSC-MRI. Although no statistically significant differences were observed between the histogram features, machine learning methods were able to differentiate the molecular subgroups. Moreover, using three consecutive slices provided more information for the molecular subgroup classification. Future studies will use the RGB images of the rCBV maps in deep learning approaches to identify IDH and TERP mutations on a larger glioma patient cohort.Acknowledgements
This study was supported by the Scientific and Technological Research Council of Turkey (TUBITAK) grant 216S432.References
1. Network CGAR. Comprehensive, integrative genomic analysis of diffuse lower-grade gliomas. New England Journal of Medicine 2015;372(26):2481-98.2. Eckel-Passow JE, Lachance DH, Molinaro AM, Walsh KM, Decker PA, Sicotte H, et al. Glioma Groups Based on 1p/19q, IDH, and TERT Promoter Mutations in Tumors. N Engl J Med 2015;372(26):2499-508.
3. Ogura R, Tsukamoto Y, Natsumeda M, Isogawa M, Aoki H, Kobayashi T, et al. Immunohistochemical profiles of IDH1, MGMT and P53: practical significance for prognostication of patients with diffuse gliomas. Neuropathology : official journal of the Japanese Society of Neuropathology 2015;35(4):324-35.
4. Takano S, Ishikawa E, Sakamoto N, Matsuda M, Akutsu H, Noguchi M, et al. Immunohistochemistry on IDH 1/2, ATRX, p53 and Ki-67 substitute molecular genetic testing and predict patient prognosis in grade III adult diffuse gliomas. Brain tumor pathology 2016;33(2):107-16.
5. Kickingereder P, Sahm F, Radbruch A, Wick W, Heiland S, Von Deimling A, et al. IDH mutation status is associated with a distinct hypoxia/angiogenesis transcriptome signature which is non-invasively predictable with rCBV imaging in human glioma. Scientific reports 2015;5:16238.
6. Hong EK, Choi SH, Shin DJ, Jo SW, Yoo RE, Kang KM, et al. Radiogenomics correlation between MR imaging features and major genetic profiles in glioblastoma. Eur Radiol 2018;28(10):4350-61.
7. Arita H, Narita Y, Fukushima S, Tateishi K, Matsushita Y, Yoshida A, et al. Upregulating mutations in the TERT promoter commonly occur in adult malignant gliomas and are strongly associated with total 1p19q loss. Acta neuropathologica 2013;126(2):267-76.
Figures
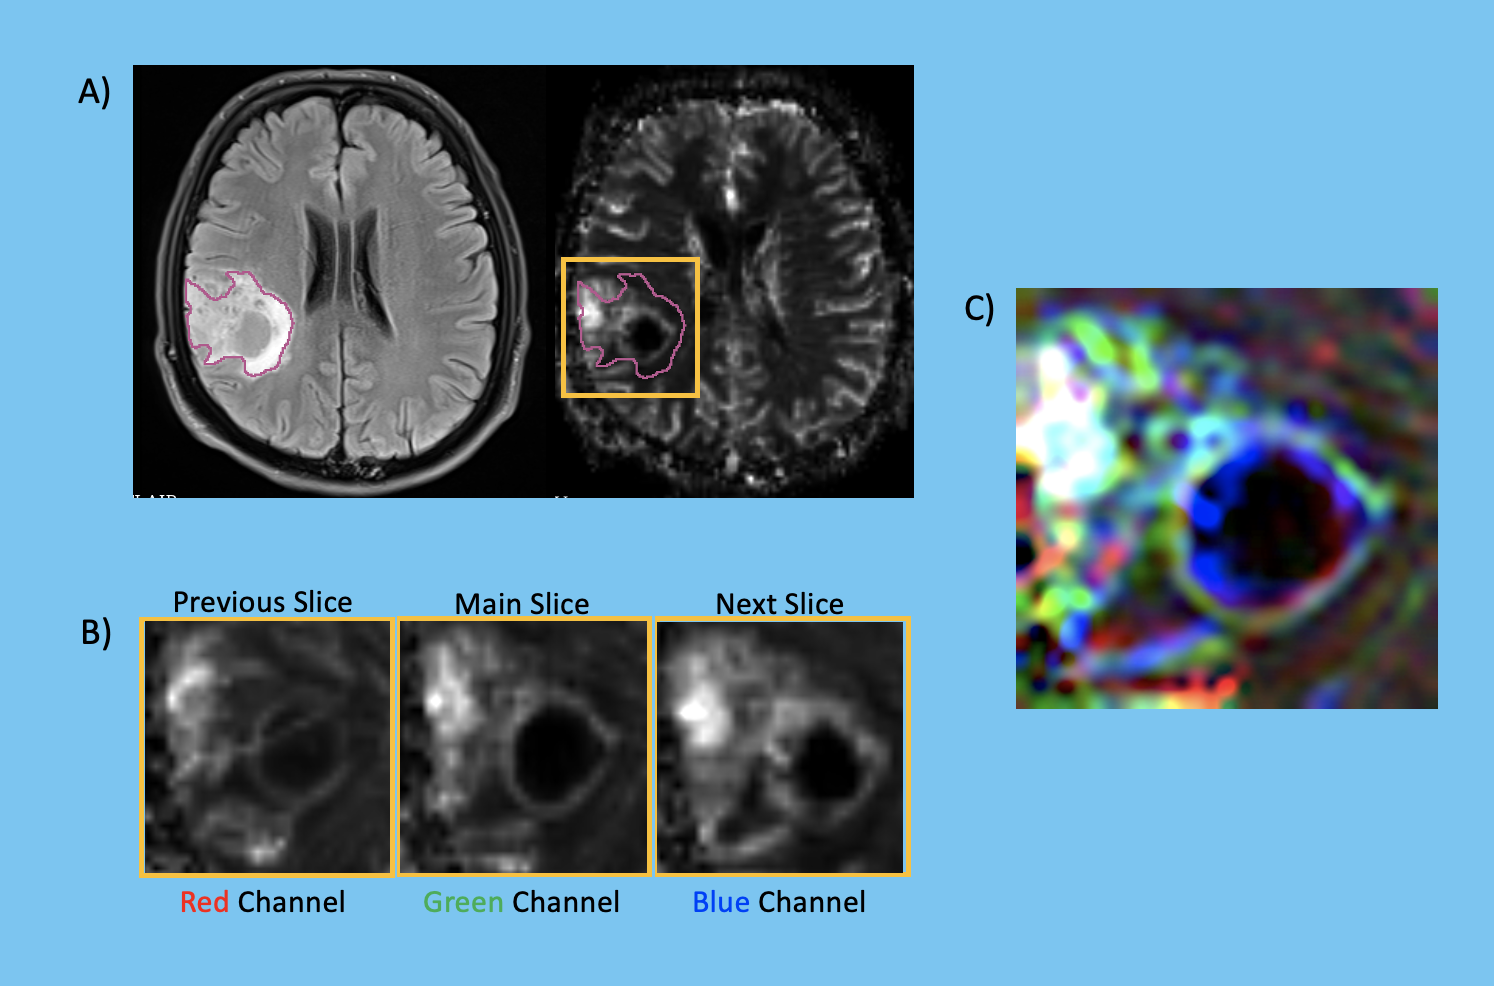
Figure 1. A) Tumor mask on a FLAIR MRI and on the corresponding rCBV map, B) Three consecutive slices that contain the main slice with the largest tumor area, and the latter and former slices, and C) Tumor map as an RGB image that contains information from the consecutive 3 slices.
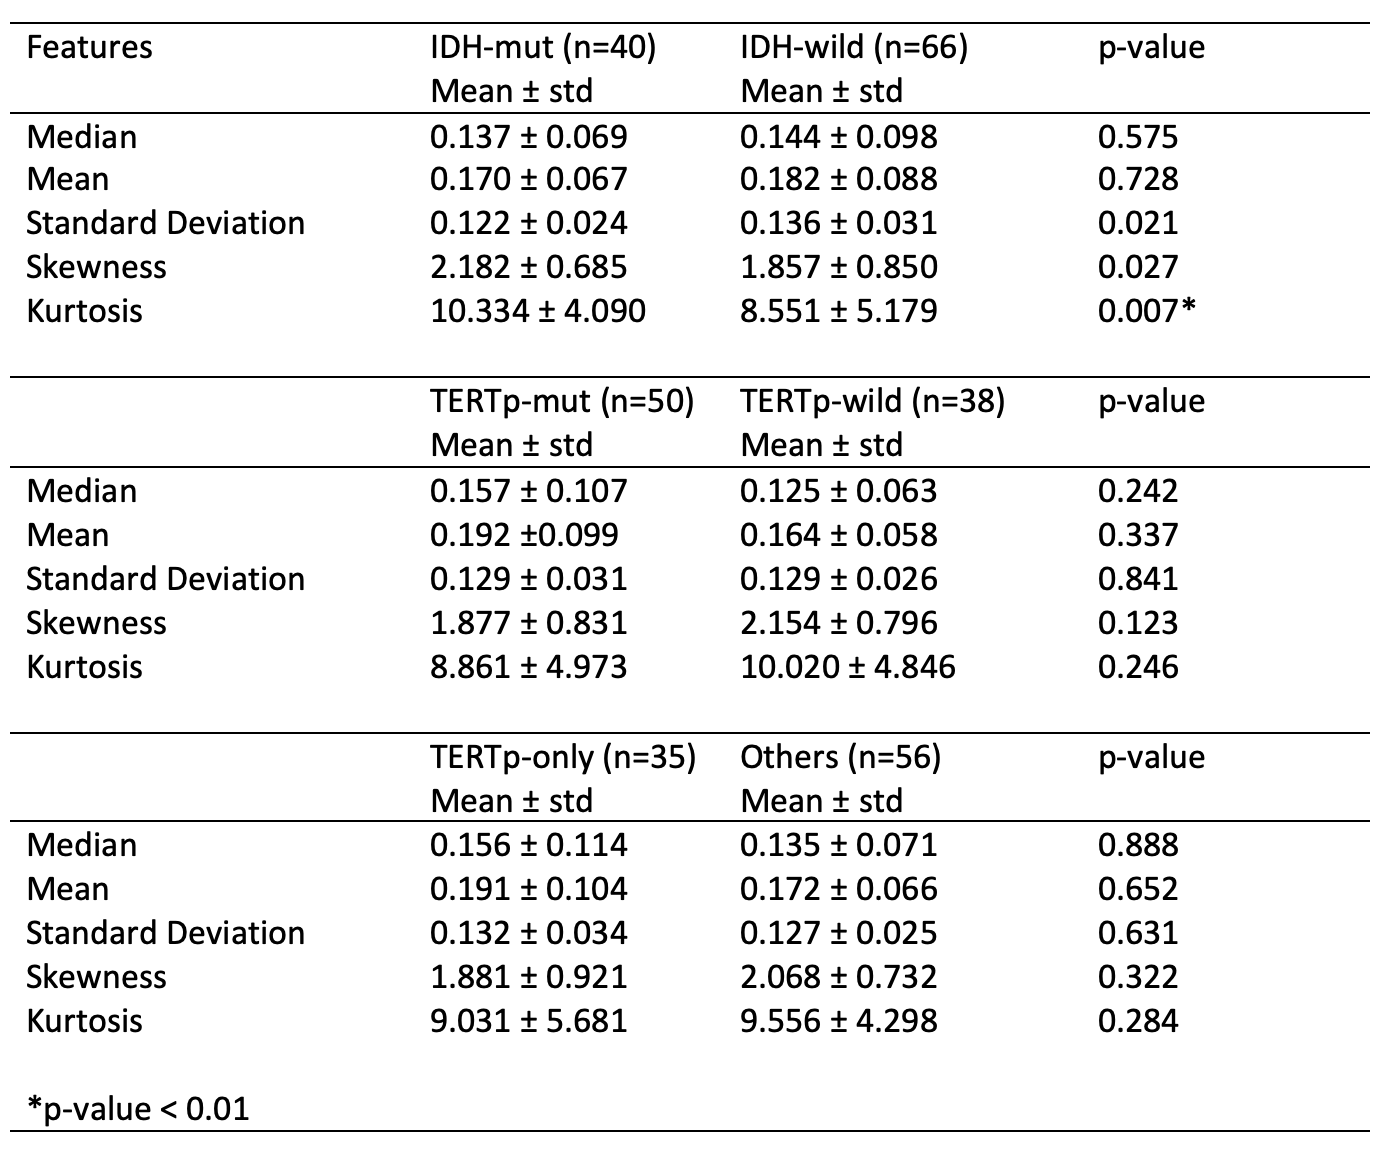
Table 1. The statistical feature differences between IDH-mut vs IDH-wt , TERTp-mut vs TERTp-wt, and TERTp-only vs others and the p-values of the Mann-Whitney U tests.
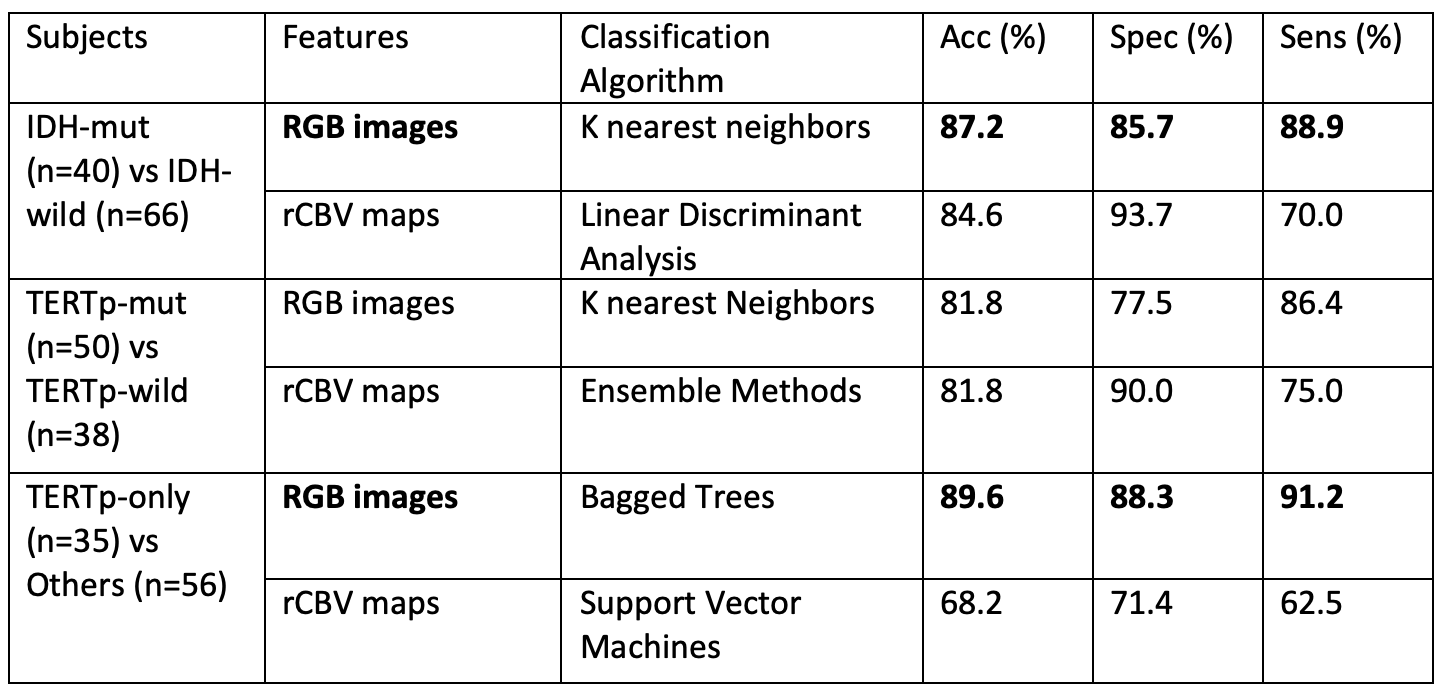
Table 2. The accuracy, specificity, and sensitivity values of classification of the IDH, TERTp and TERTp-only subsets of gliomas.
DOI: https://doi.org/10.58530/2022/1516