1515
Multi-parametric versus bi-parametric prostate MRI for deep learning: Marginal benefits from adding dynamic contrast-enhanced images1Radiology, German Cancer Research Center, Heidelberg, Germany, 2Heidelberg University Medical School, Heidelberg, Germany, 3Urology, University of Heidelberg Medical Center, Heidelberg, Germany, 4Pathology, University of Heidelberg Medical Center, Heidelberg, Germany
Synopsis
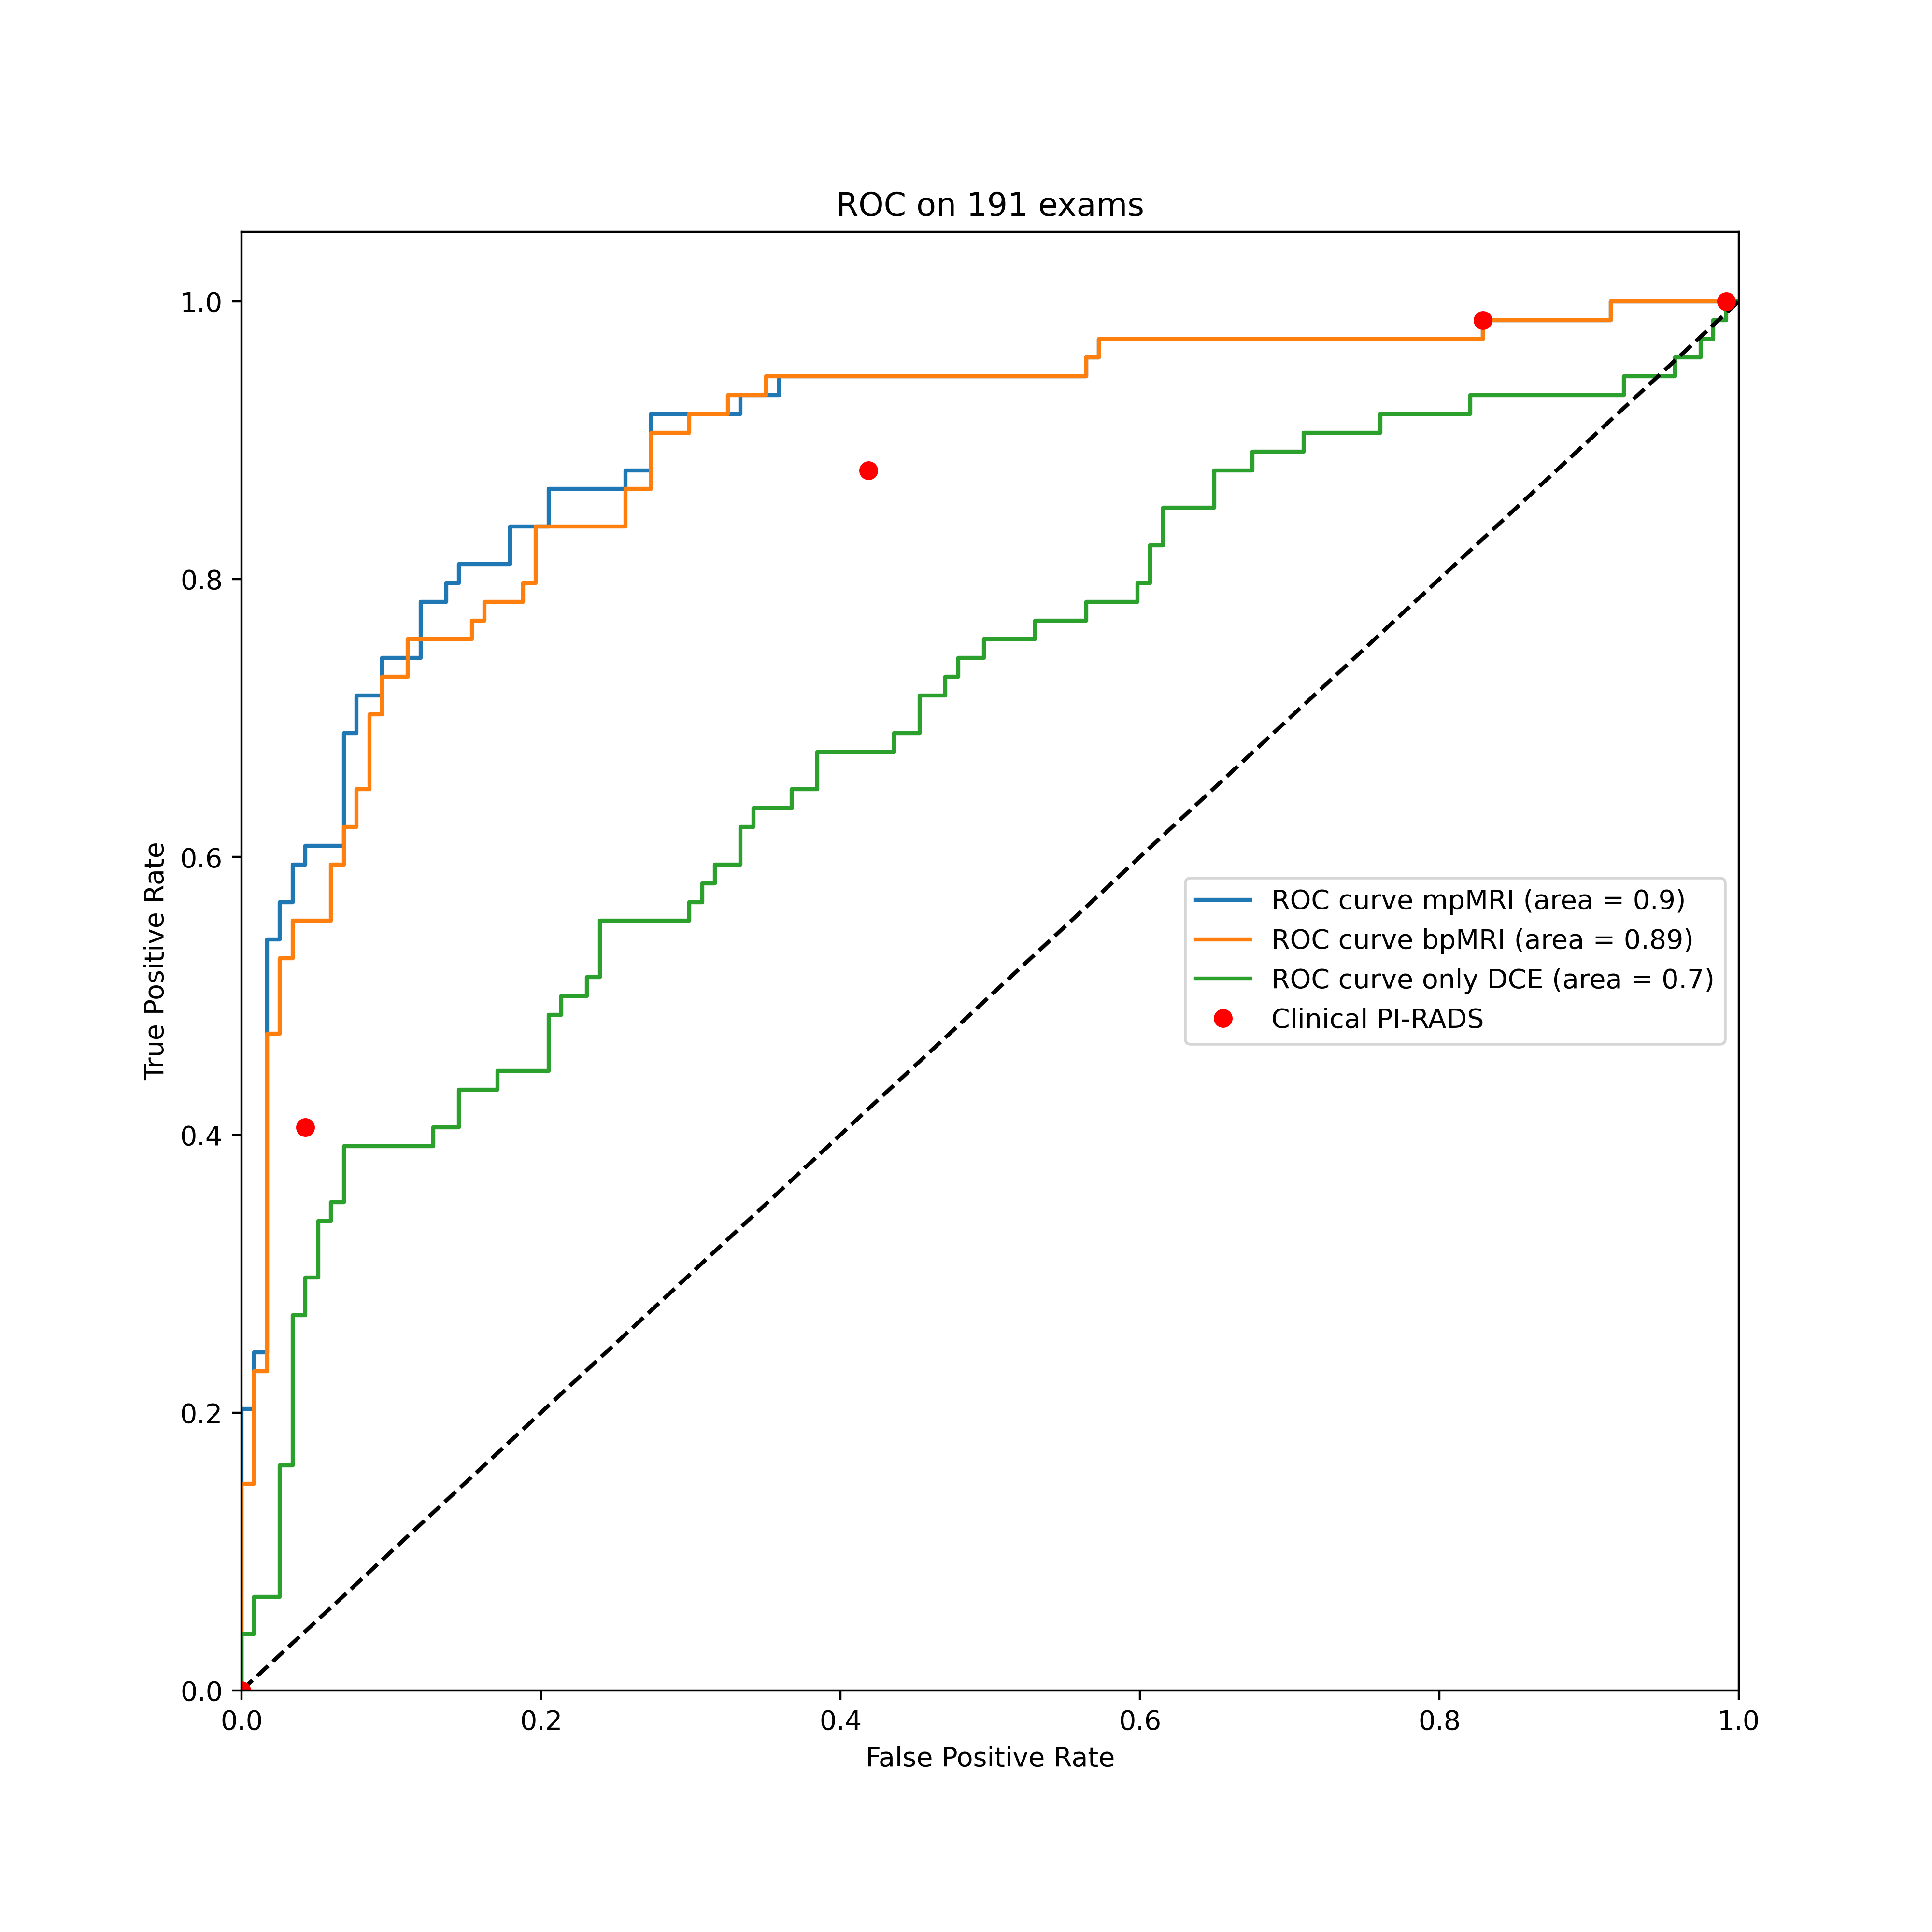
The value of dynamic contrast enhanced MRI (DCE) for the diagnosis of prostate cancer is unclear and has not yet been investigated in the context of deep learning. We trained 3D U-Nets to segment prostate cancer on bi-parametric MRI and on DCE images of 761 exams. On a test set of 191 exams, the bi-parametric baseline achieved a ROC AUC of 0.89, showing a higher specificity that clinical PI-RADS at a sensitivity of 0.9. Additional improvement could be achieved by fusing bpMRI and DCE predictions, resulting in a ROC AUC of 0.9.
Introduction
Although dynamic contrast-enhanced MRI (DCE) for the diagnosis of clinically significant prostate cancer (sPC) is an integral part of the Prostate Imaging Reporting and Data System1 (PI-RADS v2.1 ), its added value remains unclear with studies debating its benefits2. Previous studies applying deep learning (DL) to provide automatic sPC lesion segmentation are based on bi-parametric MRI (bpMRI) using only T2-weighted (T2w) and diffusion weighted (DWI) images3,4. We hypothesized that that extending a bpMRI based DL approach to include DCE, forming a multi-parametric (mpMRI) approach, would similarly provide only a small performance increase.Methods
952 mpMRI exams were included in this study. Lesion- and patient-based ground truth for the presence of sPC (Gleason Grade Groups5 ≥2) was provided by targeted MRI/TRUS-Fusion biopsy using the Ginsburg protocol6. Lesions containing sPC were retrospectively annotated on T2w images under the supervision of an experienced radiologist. A total of four DCE timepoints surrounding the influx of contrast agent into the prostate were fully automatically selected for each exam. A random 80%/20% train/test split was performed, with the train set being further split to perform 5-fold stratified cross-validation. DWI and DCE images were co-registered to their reference T2w images using weakly supervised DL to obtain affine transformations7.The resulting T2w images, high b-value images and ADC maps were used to train a bpMRI 3D-UNet ensemble to segment sPC, forming our baseline model. A second U-Net ensemble was trained on the same labels using only the four DCE timepoints as input to a pseudo-3D Network, in which 2D slices of each timepoint were stacked and presented as a volume to a 3D-UNet. The trained bpMRI and DCE models were then used to predict and segment sPC on our test set.
To obtain operating points, the bpMRI model was calibrated to a sensitivity of 95% and 90% to mimic typical PI-RADS performance (DL-PIRADS 3/4). A DCE threshold was calculated using the Youden-Index. To integrate information extracted from DCE, each bpMRI lesion with a DL-PIRADS of ≥3 was correlated and enriched with the corresponding DCE score obtained by the DCE ensemble, forming our mpMRI approach. For patient-level predictions, the maximum value of the probability map output was extracted for each case. DeLong test was used to compare ROCs. McNemar’s test was used to compare bpMRI DL performance at a fixed sensitivity of 90% (DL-PIRADS 4) to clinical radiologists to provide a frame of reference. Significance level was set at 5%.
Results
ROC analysis shows an area under the curve (AUC) of 0.89 (95% CI 0.84-0.94) for the bpMRI system, 0.90 (95% CI 0.85-0.95) for the mpMRI approach and 0.70 (95% CI 0.62-0.78) for the DCE only model. Comparing the mpMRI approach to bpMRI showed a small but significant improvement (p=0.04). DL-PIRADS 4 had a significantly higher specificity than clinical PI-RADS 4 at 0.7 compared to 0.58 (p=0.04).Discussion
We showed that dynamic contrast-enhanced MRI holds valuable information for the detection and segmentation of sPC that can be extracted using deep learning. Integrating DCE into a high performance bi-parametric deep learning pipeline has provides a small but significant improvement in the high specificity range. This confirms previous clinical studies and suggests that DCE contains only little information not already contained in the more decisive DWI and T2w images, especially when these are acquired mainly on 3T scanners as was the case in this cohort.Conclusion
Using information contained in dynamic contrast-enhance images provides small benefits for the diagnosis of clinically significant prostate cancer using deep learning for lesion segmentation.Limitations
The results need to be confirmed in a larger, consecutive test cohort.Acknowledgements
No acknowledgement found.References
1. Turkbey B, Rosenkrantz AB, Haider MA, et al. Prostate Imaging Reporting and Data System Version 2.1: 2019 Update of Prostate Imaging Reporting and Data System Version 2. Eur Urol. 2019;76(3):340-51
2. Scialpi, M., et al. (2017). "Is contrast enhancement needed for diagnostic prostate MRI?" Translational Andrology and Urology 6(3): 499-509
3. Schelb P, Kohl S, Radtke JP, et al. Classification of Cancer at Prostate MRI: Deep Learning versus Clinical PI-RADS Assessment. Radiology. 2019;293(3):607-17
4. Netzer N, Weißer C, Schelb P, et al. Fully Automatic Deep Learning in Bi-institutional Prostate Magnetic Resonance Imaging: Effects of Cohort Size and Heterogeneity. Investigative Radiology 2021;Publish Ahead of Print
5. Egevad, L., et al., International Society of Urological Pathology (ISUP) grading of prostate cancer - An ISUP consensus on contemporary grading. Apmis, 2016. 124(6): p. 433-5.
6. Kuru, T.H., et al., Definitions of terms, processes and a minimum dataset for transperineal prostate biopsies: a standardization approach of the Ginsburg Study Group for Enhanced Prostate Diagnostics. BJU Int, 2013. 112(5): p. 568-77.
7. Y. Hu et al., "Label-driven weakly-supervised learning for multimodal deformable image registration," 2018 IEEE 15th International Symposium on Biomedical Imaging (ISBI 2018), 2018, pp. 1070-1074
Figures
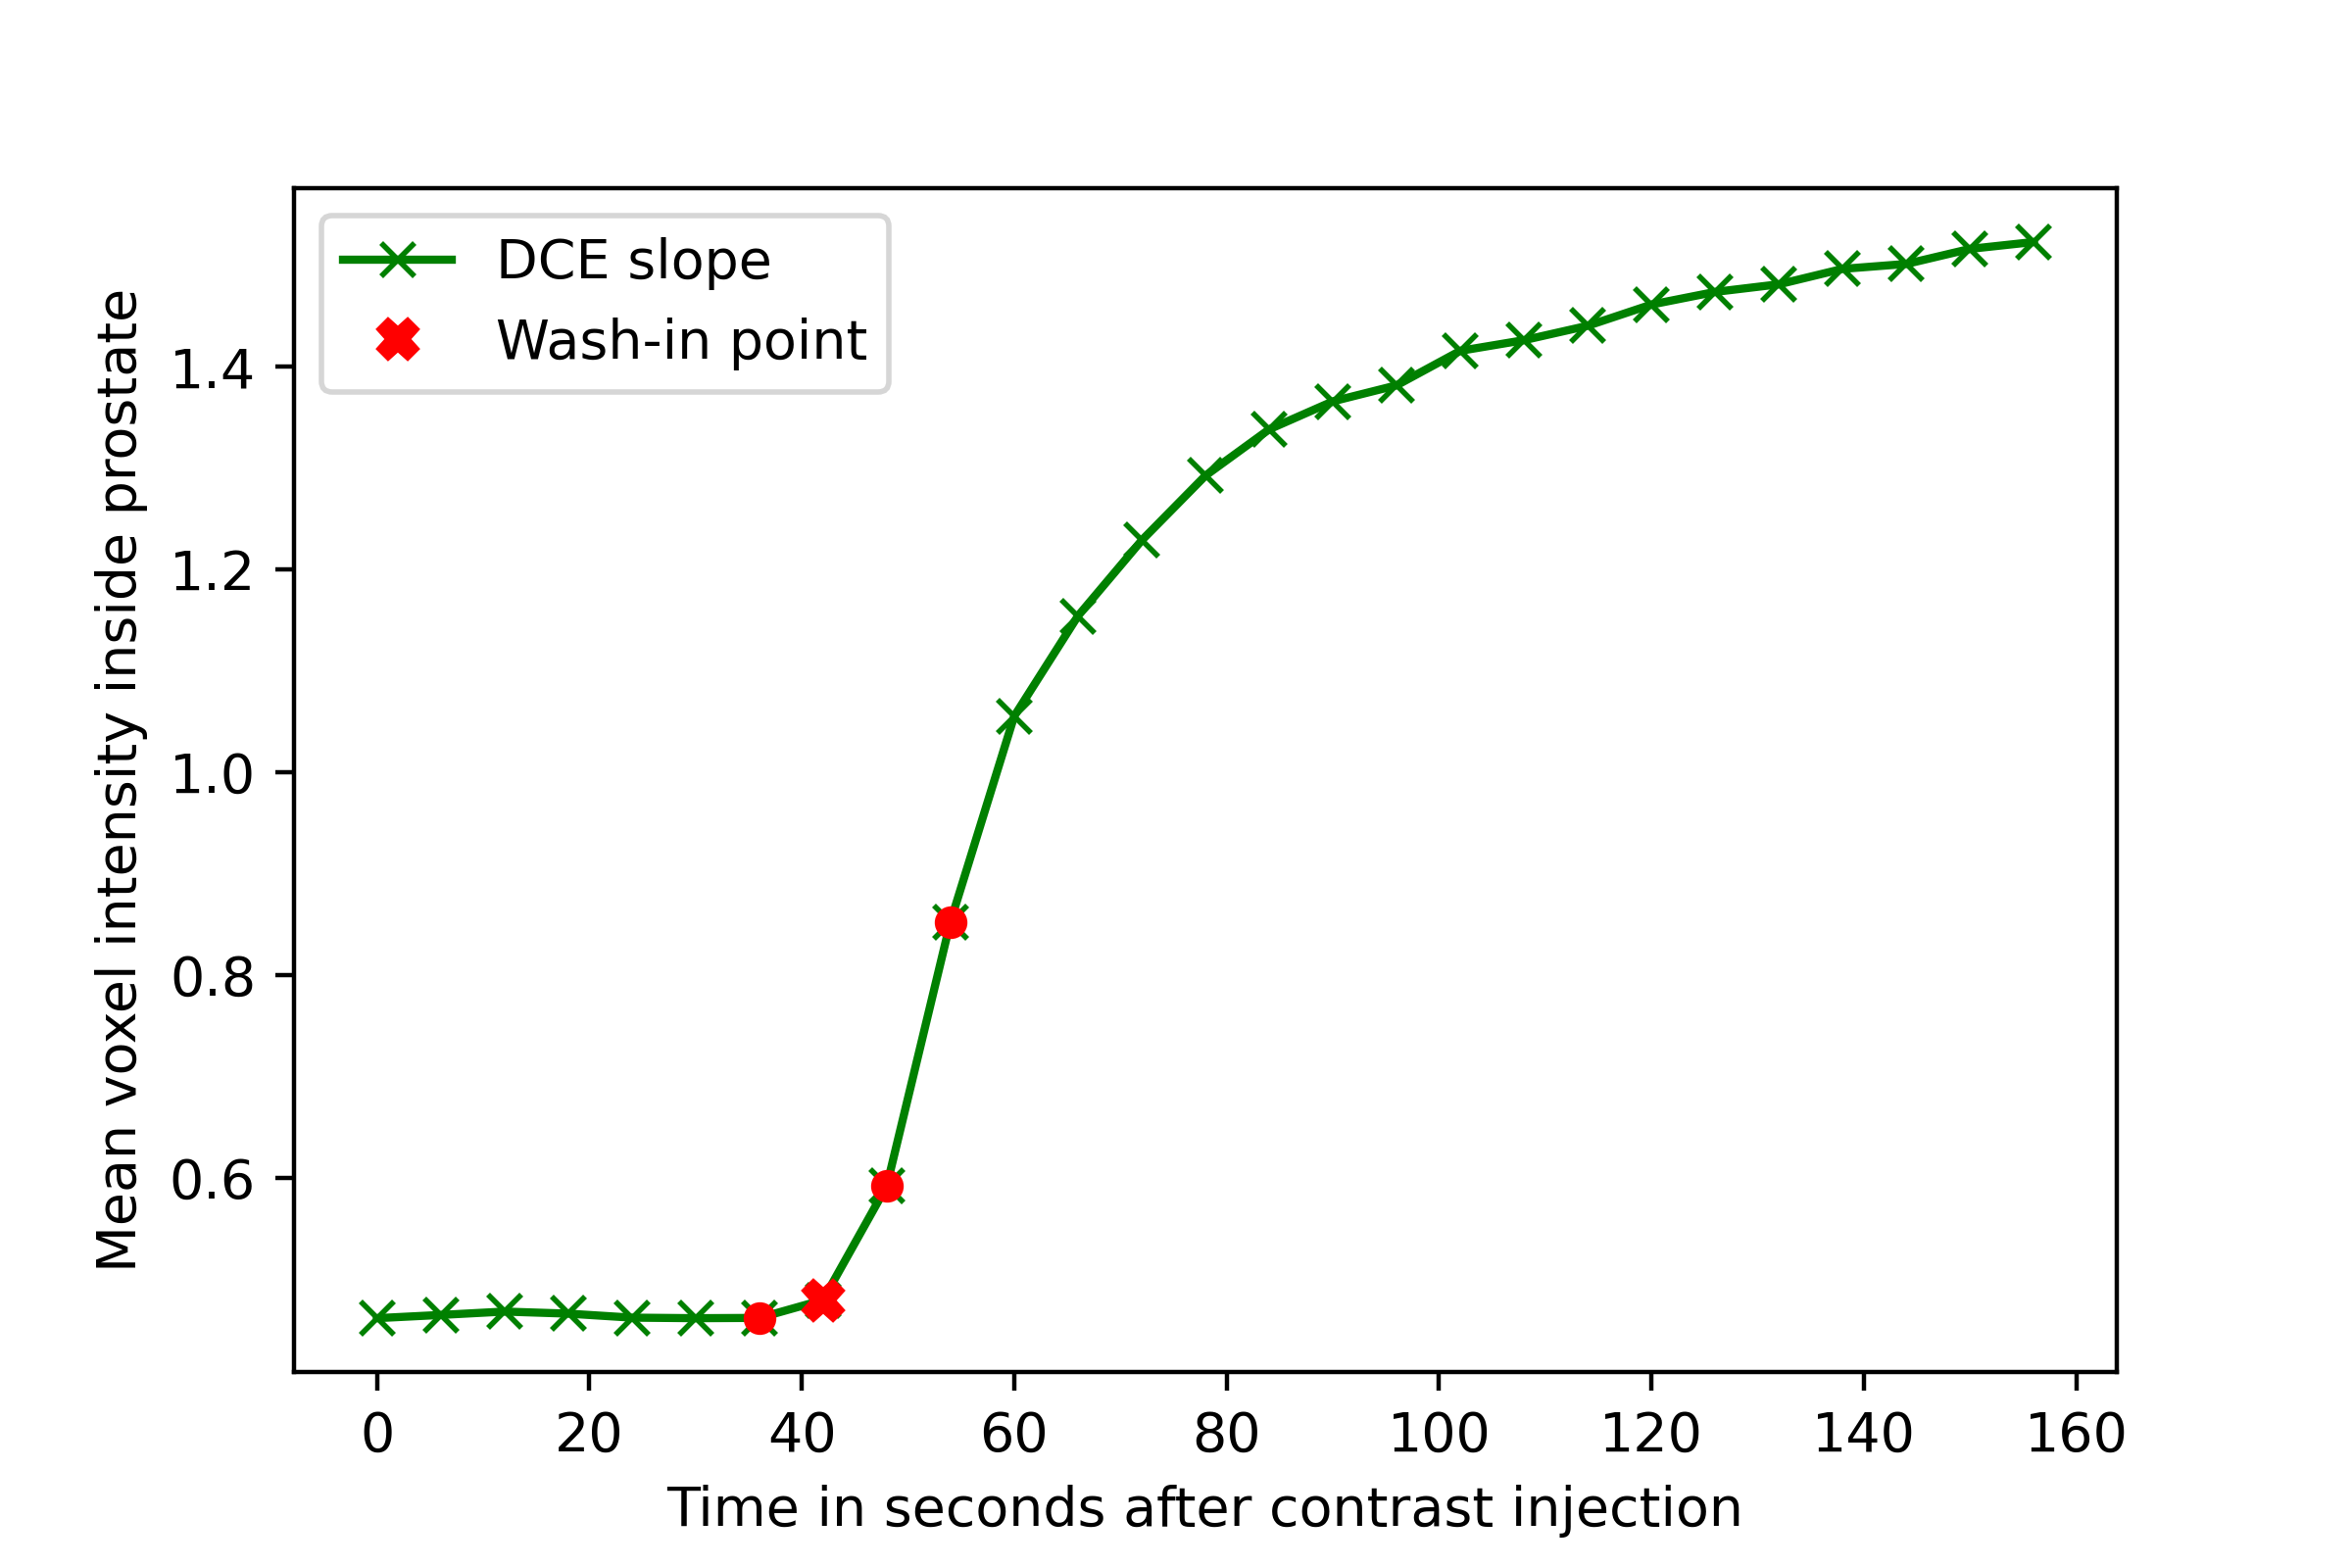
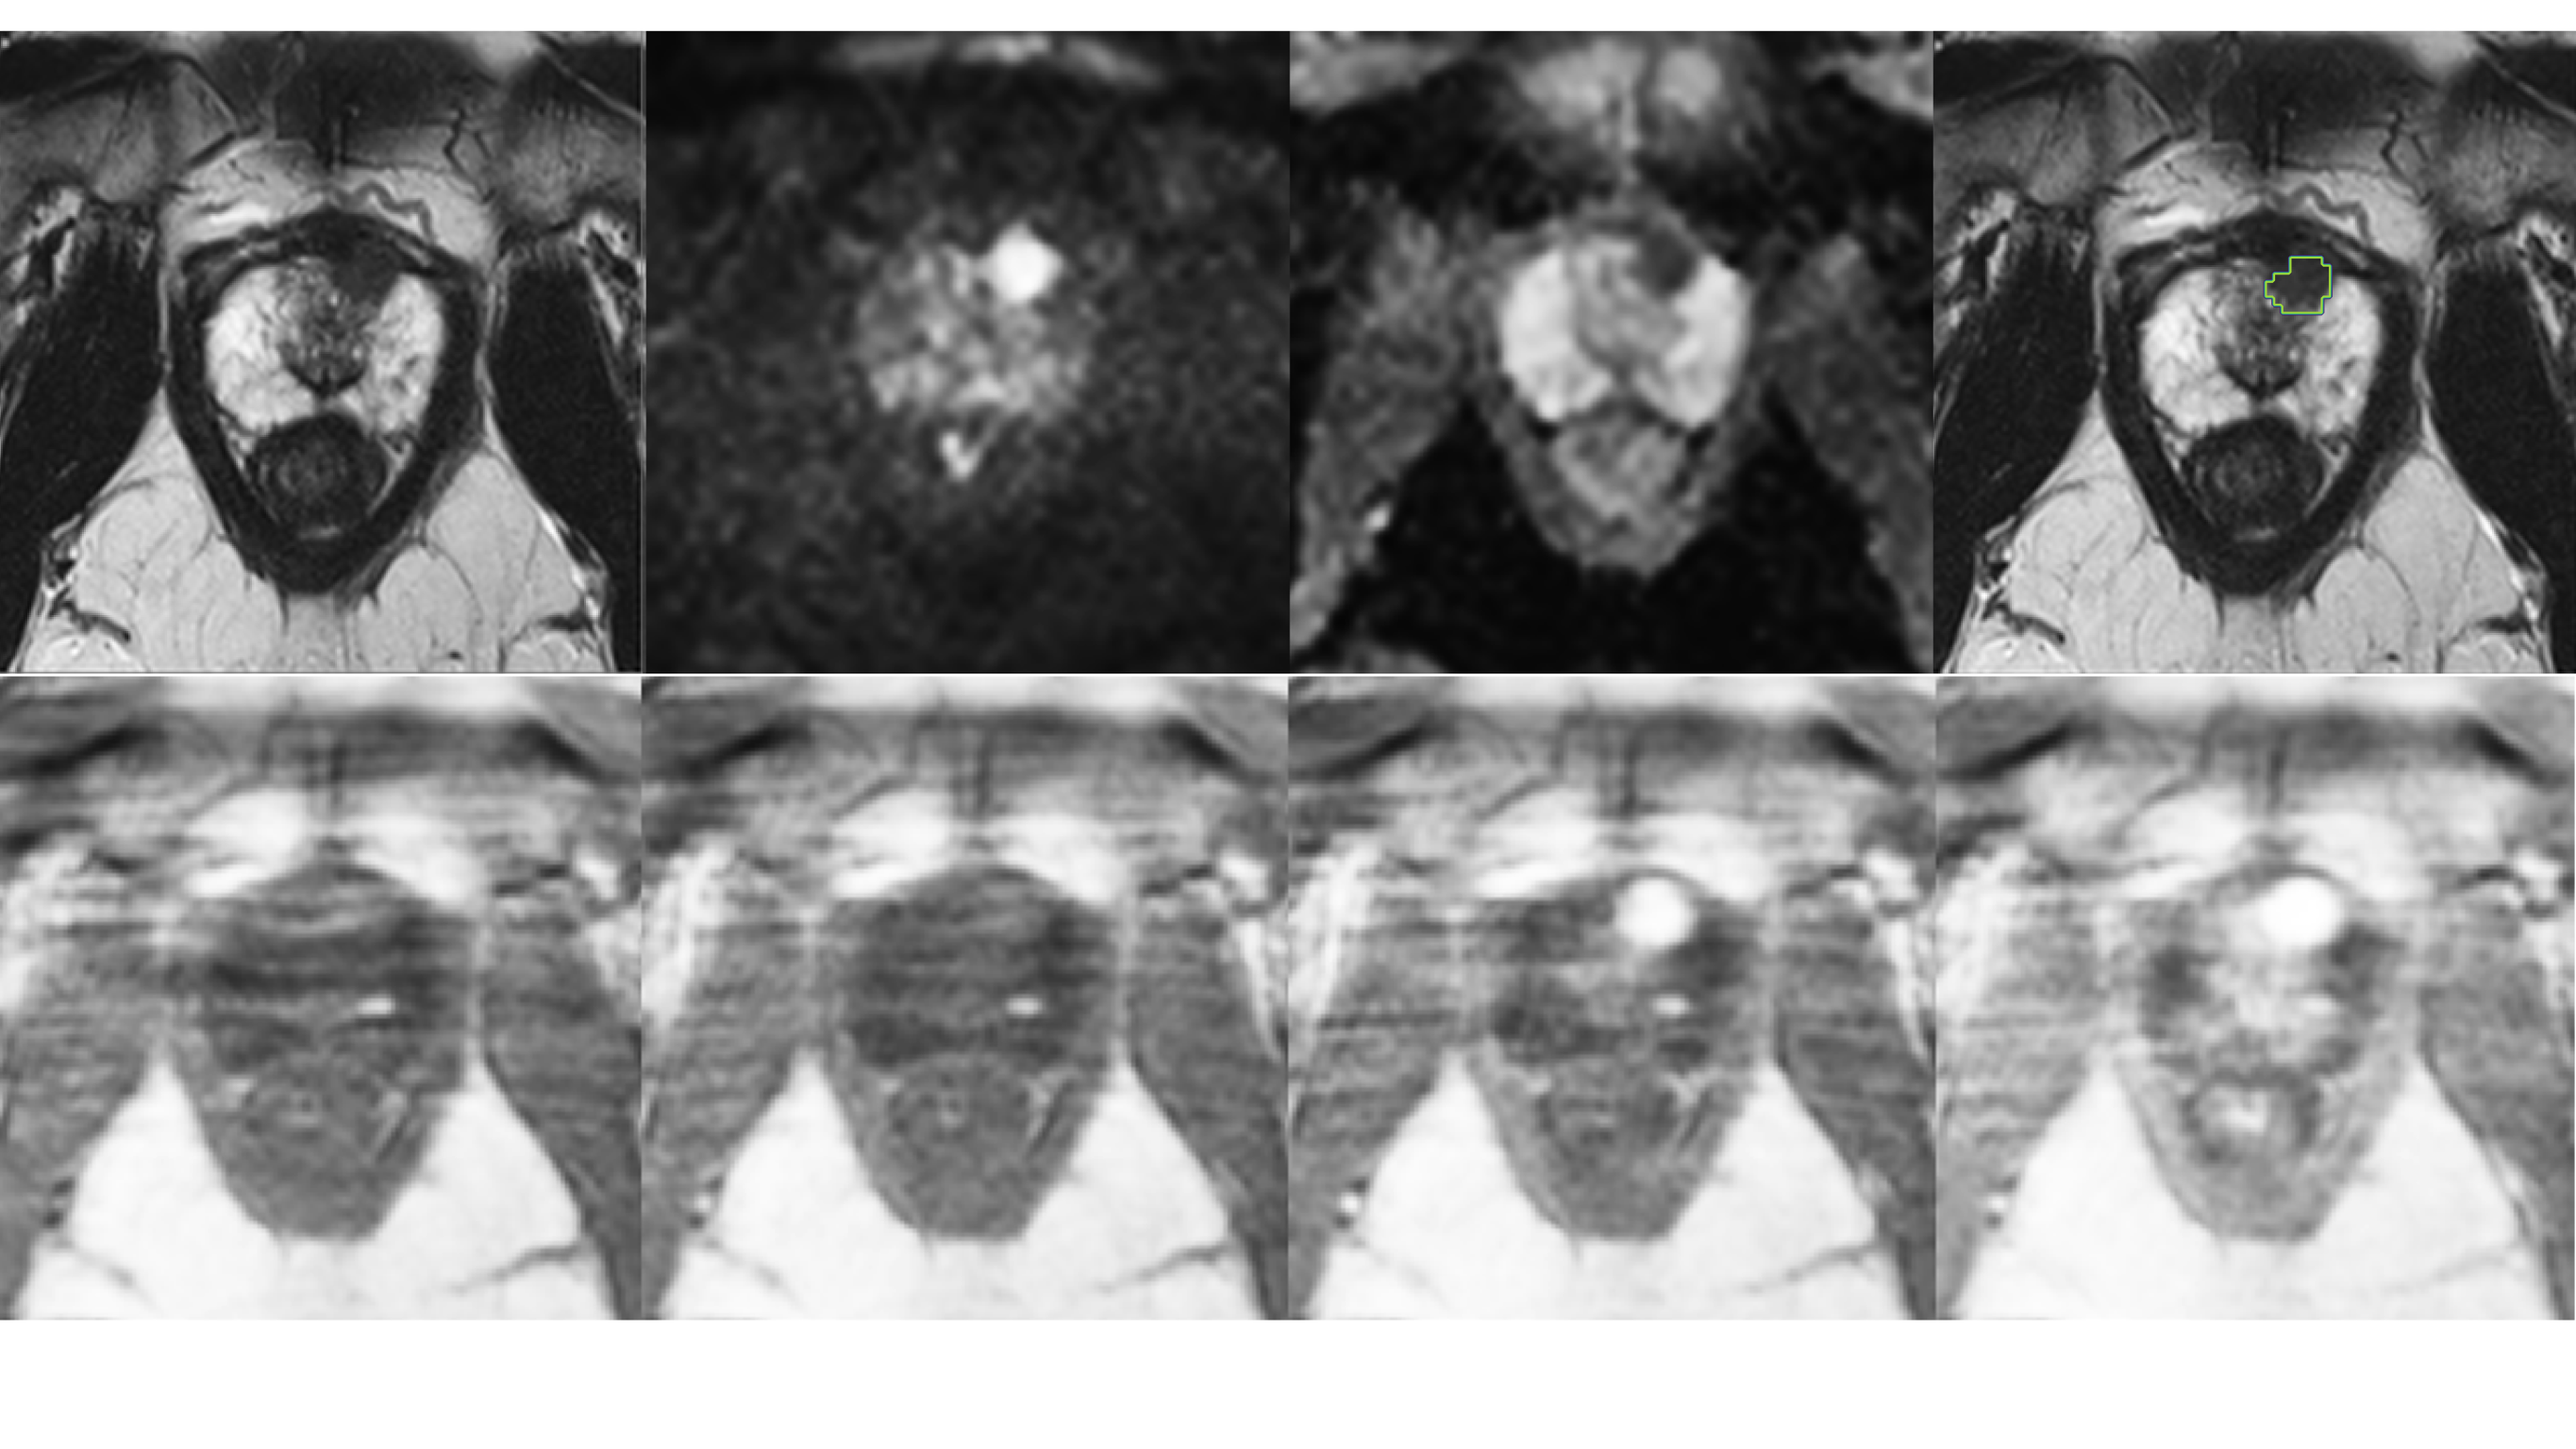
Figure 2:
Top row: T2w, high b-value , ADC map and overlaid ground truth segmentation used to train bpMRI.
Bottom row: DCE images used for training, from left to right early to late timepoints. These images correspond to the selections from Figure 1.