1514
Prostate Cancer Risk Assessment using Fully Automatic Deep Learning in MRI: Integration with Clinical Data using Logistic Regression Models1Division of Radiology, German Cancer Research Center, Heidelberg, Germany, 2Heidelberg University Medical School, Heidelberg, Germany, 3Department of Urology, University of Heidelberg Medical Center, Heidelberg, Germany, 4Department of Pathology, University of Heidelberg Medical Center, Heidelberg, Germany
Synopsis
For patients with clinical suspicion for significant prostate cancer, the decision to undergo prostate biopsy can be supported by calculating the individual risk profile using demographic and clinical information along with multiparametric MRI assessment. We could show that the prediction performance of an established risk calculator remained stable after substituting manual PI-RADS scores for assessments from a fully automated deep learning system. Combining deep learning and PI-RADS resulted in significant improvements over using only PI-RADS. Complementary information that deep learning models are able to extract enable synergies with radiologists to improve individual risk predictions.
Introduction
Targeted prostate biopsies using multiparametric MRI (mpMRI) have been increasingly recommended for men with clinical suspicion of significant prostate cancer (sPC) who are biopsy-naïve or have a previous negative biopsy in their history1. As biopsies carry inherent risks2, the decision when to biopsy can be supported by risk calculators, usually logistic regression models, that stratify patients using demographic and clinical information, recently with the addition of mpMRI assessment3 using the Prostate Imaging Reporting and Data System4 (PI-RADS). Fully automatic deep learning (DL) systems trained on mpMRI have been shown to provide similar sPC detection as PI-RADS5, 6. We hypothesized that risk estimation with logistic regression models based on demographic and clinical data but with the addition of fully automated deep learning mpMRI image assessment would be capable of performing similarly to established risk models using clinical PI-RADS assessment.Methods
806 exams from 2014 to 2017 were used for network training, from which a subset of 648 exams had no previous PC diagnosis and was used for logistic model estimation. 435 subsequent exams from 2018 to 2019 without previous PC diagnosis were available for testing. mpMRI images were clinically assessed before biopsy in accordance with PI-RADS standards4 and then manually segmented. Ground truth was established through combined systematic and targeted MRI/TRUS fusion biopsy using the Ginsburg protocol7. In the subsequent assessment under supervision of a dedicated uropathologist, sPC was defined as Gleason Grade Group ≥28. The Deep Learning architecture was based on the self-configuring nnUNet9 and was recently validated for prostate MRI5. Anisotropic T2w images, diffusion weighted images with high b-value and apparent diffusion coefficient maps (together called biparametric MRI) were used as inputs to predict probability maps which were compared to sPC-positive lesion segmentations. The maximum value of this probability map was used as the risk score for the entire exam (UNet-Score). DL-PIRADS was calculated from the UNet-Score to produce a five-point scale for which sensitivities and specificities of DL-PIRADS receiver operating points matched the operating points of radiologist’s PI-RADS ratings, specifically with sensitivities of 98% for PI-RADS ≥2, 95% for PIRADS ≥3, 90% for PIRADS ≥4 and specificity of 90% for PI-RADS ≥5. These dynamic operating points were determined using a sliding window of the last 300 exams to ensure calibration over time10. A published risk calculator11 (Radtke2017) was used as a baseline for comparison, which uses patient age, logarithm of prostate-specific antigen level, prostate volume, presence of suspicious findings in the digital rectal exam, and PI-RADS mpMRI assessment as input variables. We compared the Receiver Operating characteristic (ROC) of the original Radtke2017 model, the Radtke2017 model where PI-RADS was substituted for DL-PIRADS and a combined logistic regression model, where clinical values from Radtke2017, PI-RADS and DL-PIRADS were used as input variables. DeLong’s test was used to compare ROCs between groups and McNemar’s test for differences in specificity at a fixed sensitivity of 90%. The significance level was set at 5% and Holm method was used to adjust for multiple testing.Results
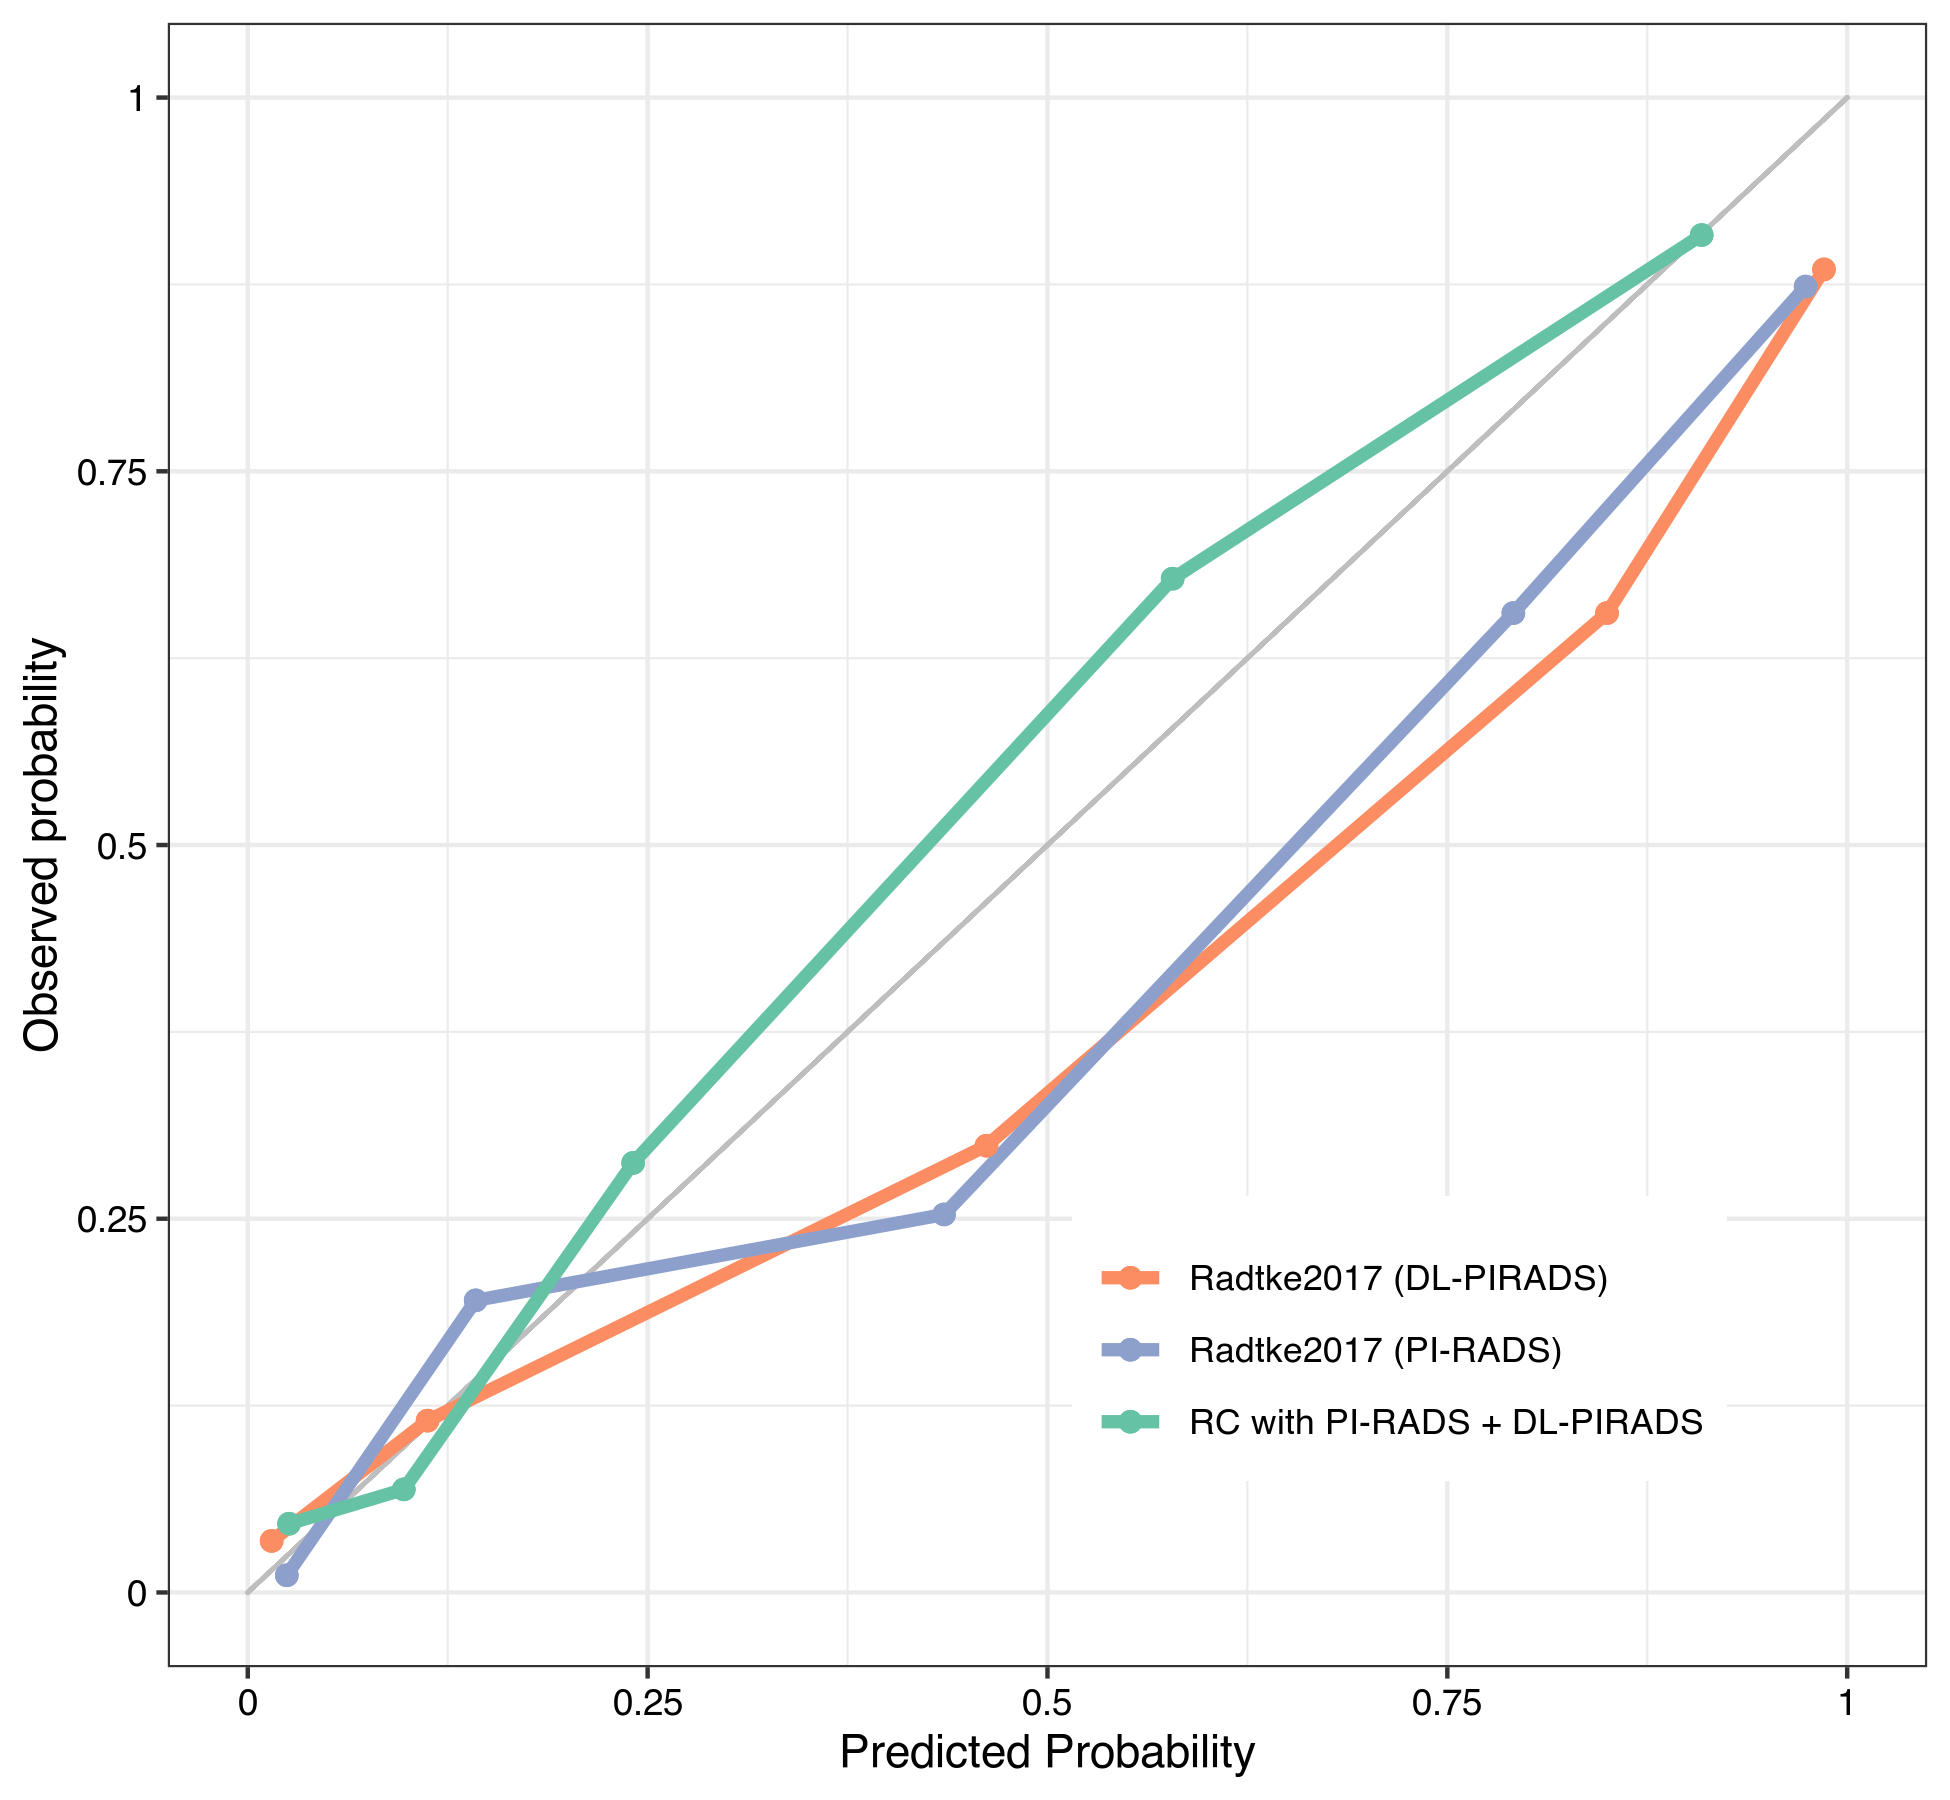
ROC analysis on the test cohort showed an Area under the curve (AUC) of 0.88 (95% CI 0.85-0.91) for standard Radtke2017, 0.89 (95% CI 0.86-0.92) for substituted Radtke2017, and 0.91 (95% CI 0.88-0.94) for the combined model. Compared to the original Radtke2017 model at 90% sensitivity, the higher specificity of the substituted model (58% vs. 68%, p < 0.01) and the combined model (58% vs. 77%, p < 0.001) was statistically significant. Comparing the original model’s ROC using DeLong’s test showed significant differences to the combined model (p < 0.01) but not to the substituted model (p > 0.2).Discussion
There was no significant difference in classification performance for the Radtke2017 risk calculator when substituting manual PI-RADS for automated DL-PIRADS. Utilizing both MRI assessment methods, PI-RADS and DL, yields better classification performance than using PI-RADS alone. ROC improvement from combining both systems is consistent with previous findings12 and shows that independent information is extracted from MRI data by each system. Synergies with PI-RADS are possible by utilizing the additional information from DL to improve predictions.Conclusion
The Radtke2017 risk calculator showed stable prediction performance when substituting PI-RADS for assessments from a fully automated DL system on our institutional dataset. The complementary information provided by DL can significantly improve the specificity of individual prostate cancer risk assessment.Acknowledgements
No acknowledgement found.References
1. Mottet, N., et al., EAU-EANM-ESTRO-ESUR-SIOG Guidelines on Prostate Cancer—2020 Update. Part 1: Screening, Diagnosis, and Local Treatment with Curative Intent. European Urology, 2021. 79(2): p. 243-262.
2. Borghesi, M., et al., Complications After Systematic, Random, and Image-guided Prostate Biopsy. Cochrane Database of Systematic Reviews, 2016(1873-7560 (Electronic)).
3. Radtke, J.P., et al., Prediction of significant prostate cancer in biopsy-naive men: Validation of a novel risk model combining MRI and clinical parameters and comparison to an ERSPC risk calculator and PI-RADS. PLoS One, 2019. 14(8): p. e0221350.
4. Turkbey, B., et al., Prostate Imaging Reporting and Data System Version 2.1: 2019 Update of Prostate Imaging Reporting and Data System Version 2. Eur Urol, 2019. 76(3): p. 340-351.
5. Netzer, N., et al., Fully Automatic Deep Learning in Bi-institutional Prostate Magnetic Resonance Imaging: Effects of Cohort Size and Heterogeneity. Investigative Radiology, 2021. Publish Ahead of Print.
6. Schelb, P., et al., Classification of Cancer at Prostate MRI: Deep Learning versus Clinical PI-RADS Assessment. Radiology, 2019. 293(3): p. 607-617.
7. Kuru, T.H., et al., Definitions of terms, processes and a minimum dataset for transperineal prostate biopsies: a standardization approach of the Ginsburg Study Group for Enhanced Prostate Diagnostics. BJU Int, 2013. 112(5): p. 568-77.
8. Egevad, L., et al., International Society of Urological Pathology (ISUP) grading of prostate cancer - An ISUP consensus on contemporary grading. Apmis, 2016. 124(6): p. 433-5.
9. Isensee, F., et al., nnU-Net: a self-configuring method for deep learning-based biomedical image segmentation. Nature Methods, 2021. 18(2): p. 203-211.
10. Schelb, P., et al., Simulated clinical deployment of fully automatic deep learning for clinical prostate MRI assessment. Eur Radiol, 2021. 31(1): p. 302-313.
11. Radtke, J.P., et al., Combined Clinical Parameters and Multiparametric Magnetic Resonance Imaging for Advanced Risk Modeling of Prostate Cancer—Patient-tailored Risk Stratification Can Reduce Unnecessary Biopsies. European Urology, 2017. 72(6): p. 888-896.
12. Hiremath, A., et al., An integrated nomogram combining deep learning, Prostate Imaging–Reporting and Data System (PI-RADS) scoring, and clinical variables for identification of clinically significant prostate cancer on biparametric MRI: a retrospective multicentre study. The Lancet Digital Health, 2021. 3(7): p. e445-e454.
Figures
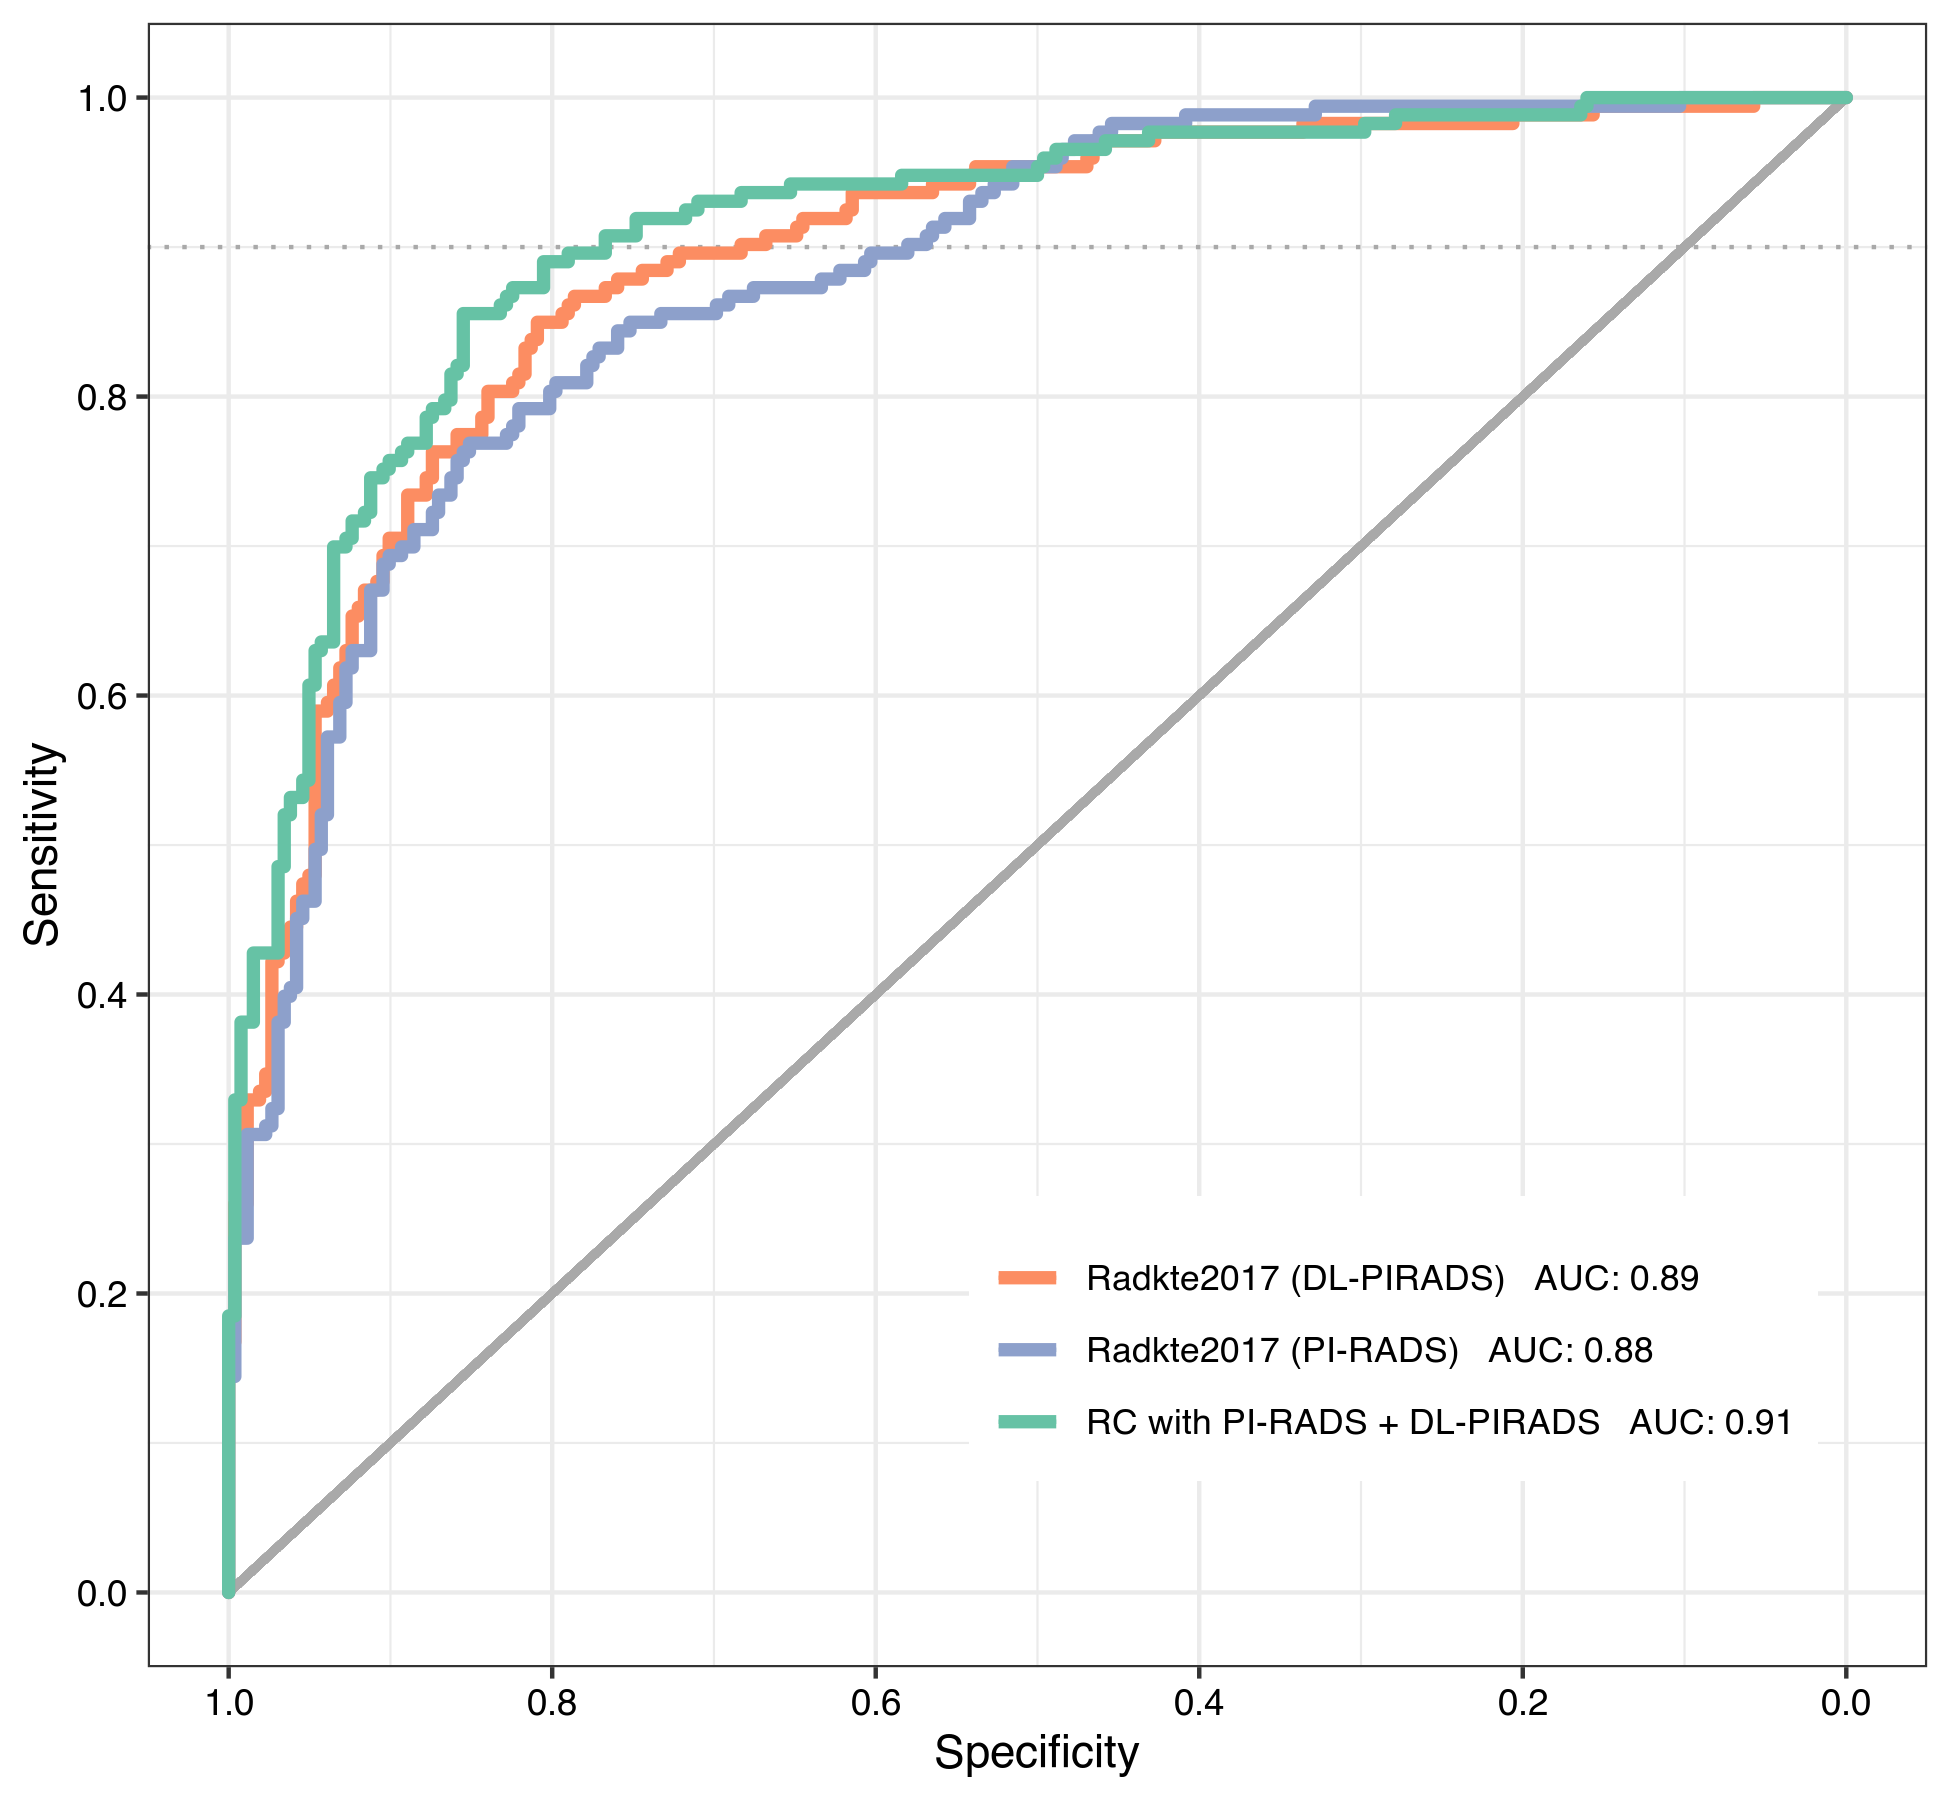
Receiver Operating Characteristic on the test cohort comparing the original Radtke2017 model (blue), the Radtke2017 model with DL-PIRADS substitution (orange) and the risk calculator with a combination of PI-RADS and DL-PIRADS (green). The gray continuous line shows no skill level for comparison. The three models show similar characteristics for very high sensitivities but differentiate themselves at the 90% sensitivity mark (gray dotted line).