1508
How modeling lactate diffusion may inform on its cellular compartmentation? An initial study1Université Paris-Saclay, Commissariat à l'Energie Atomique et aux Energies Alternatives (CEA), Centre National de la Recherche Scientifique (CNRS), Molecular Imaging Research Center (MIRCen), Laboratoire des Maladies Neurodégénératives, Fontenay aux Roses, France
Synopsis
Brain lactate compartmentation in neurons, astrocytes and the extracellular space is presumably of critical importance, but remains impossible to assess non-invasively. DW-MRS of lactate might capture lactate fractions in each compartment, provided these compartments induce different diffusion properties. Here we propose a framework where diffusion of cell-specific metabolites (Ins and NAA) is modeled to predict lactate diffusion in astrocytes and neurons. We use some “realistic” (spheres+cylinders) and simplified (cylinders) models of cell microstructure to show that lactate fractions in each compartment can be accurately estimated, despite inaccurate microstructure modeling. Models are finally tested on in vivo mouse brain data.
Introduction
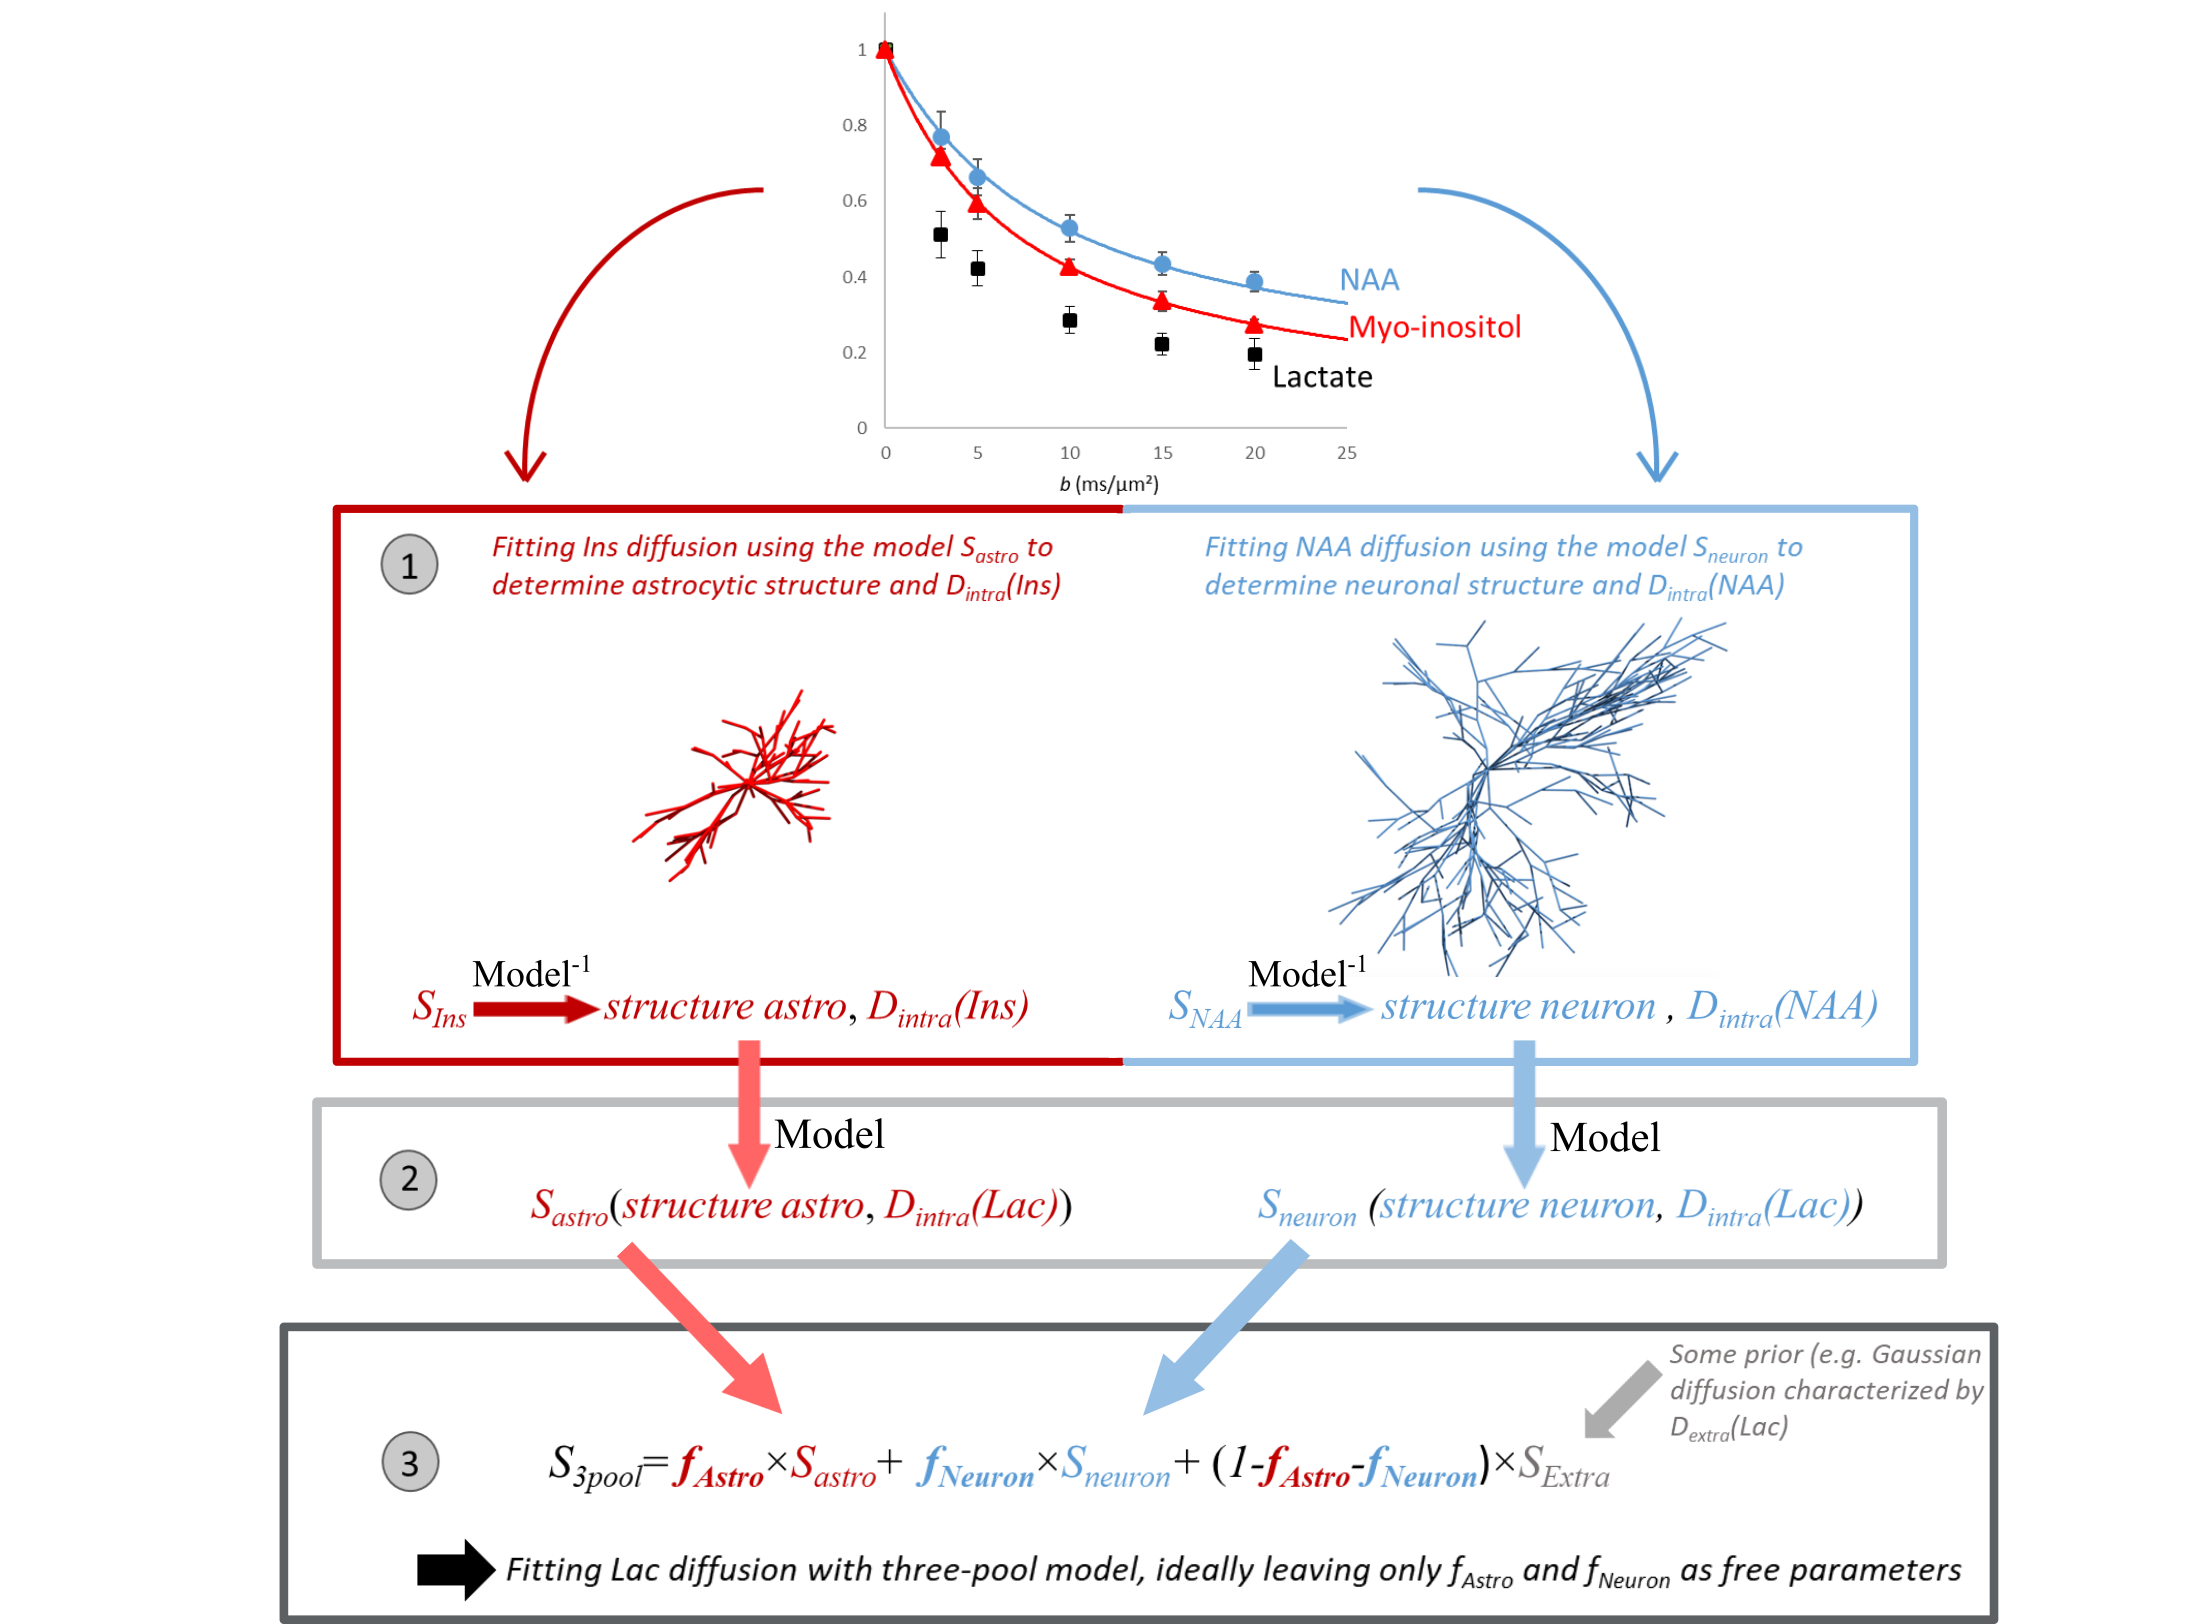
The distribution of brain lactate (Lac) between neurons, glial cells (particularly astrocytes) and the extracellular space (ECS), is presumably of fundamental importance for brain function, via the astrocyte-to-neuron lactate shuttle1, which requires a concentration gradient [Lac]astro>[Lac]ECS>[Lac]neuron2. However, assessing lactate compartmentation is not yet possible using non-invasive techniques. Because diffusion as measured with diffusion-weighted (DW) MRS depends on the surrounding microstructure, lactate diffusion may inform about the compartments where it is diffusing, provided neurons, astrocytes and ECS induce different enough diffusion properties. Such idea guided some semi-quantitative estimation of intracellular-extracellular lactate fractions3 and, more recently, some qualitative discussion about lactate fraction in astrocytes versus neurons4.Here we present initial developments to quantify lactate fraction in neurons, astrocytes and ECS. The general framework is the following (fig.1):
1. DW-signal of astrocytic myo-inositol (Ins) and neuronal NAA and is fitted, using some microstructure models, to extract relevant astrocytic and neuronal and microstructural parameters, and intracellular diffusivities Dintra.
2. DW-signal of lactate within astrocytes (Sastro) and neurons (Sneuron) is predicted, using the models and microstructural parameters estimated in step 1, but with larger Dintra than Ins and NAA, reflecting faster diffusivity of lactate.
3. DW-signal of lactate is fitted using a three-compartment model, by varying the fraction in each compartment, with Sastro and Sneuron precomputed in step 2:
$$S=f_{astro}\times S_{astro}+f_{neuron}\times S_{neuron}+(1-f_{astro}-f_{neuron}) \times S_{ECS}[1]$$
For SECS, prior knowledge is used (e.g. Gaussian diffusion).
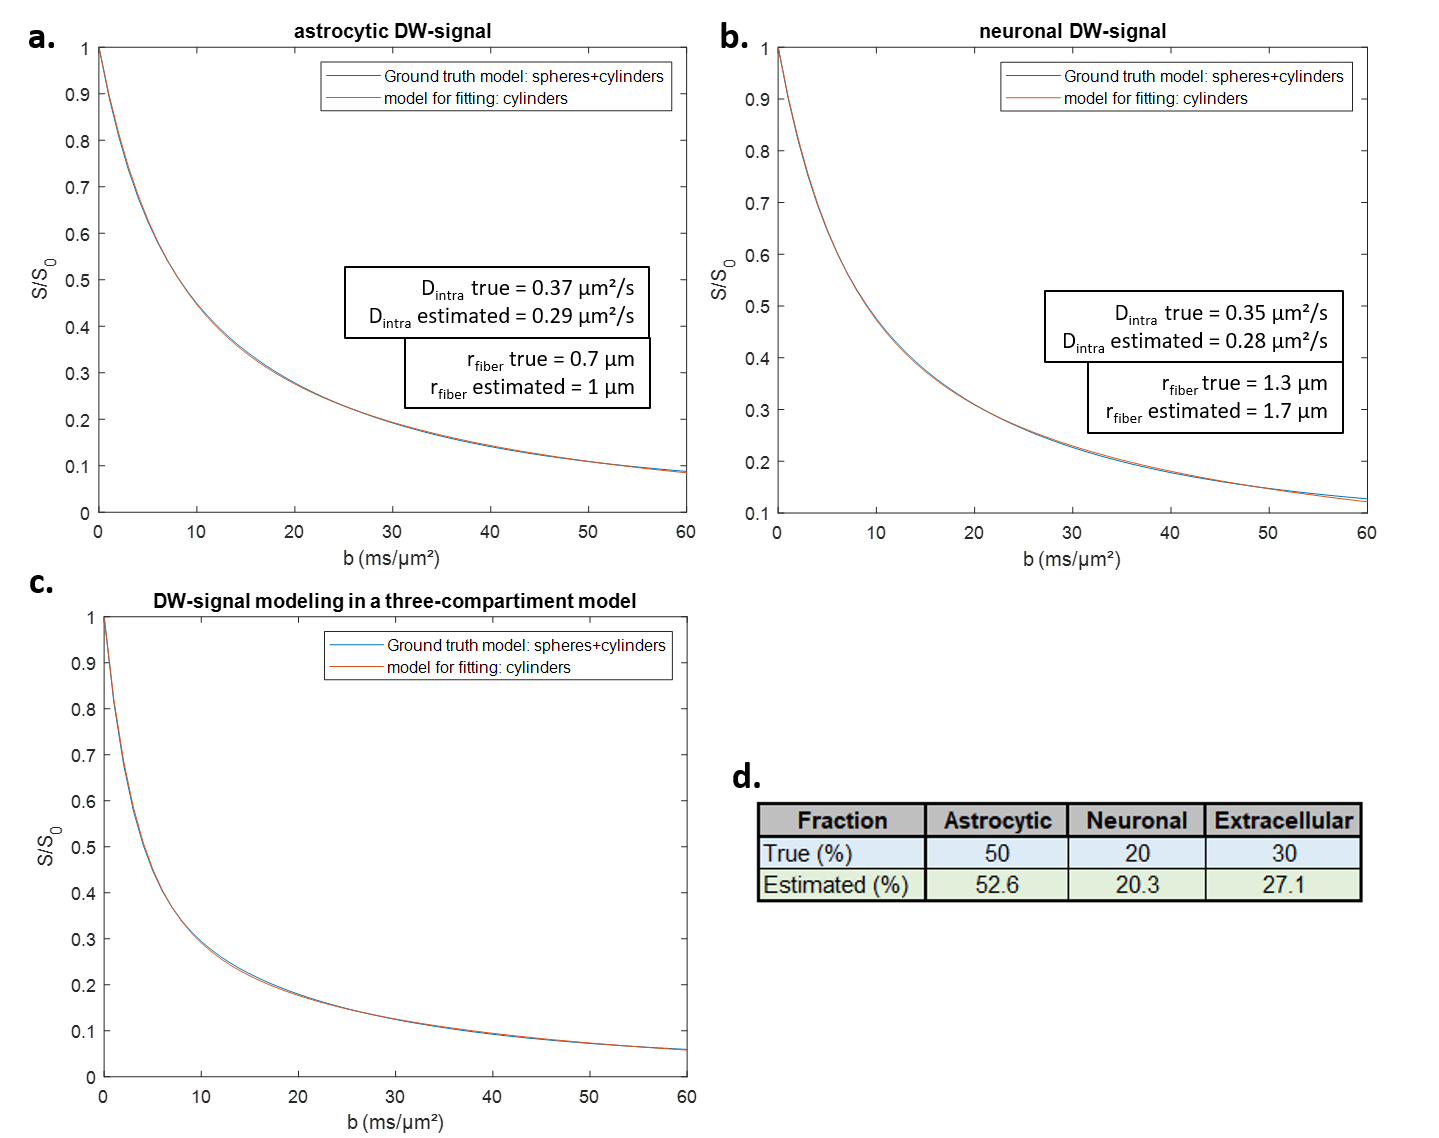
Central to that framework are the microstructure models for neurons and astrocytes. How exact do those models need to be? Are approximate models yielding biased microstructural parameters still good enough to yield accurate lactate fractions? To investigate this question, we simulate DW-signal with a “realistic model” where cells consist of spheres and cylinders (e.g. like the SANDI model5), and fit them using a simplified model consisting of cylinders only6. We then try modeling in vivo data.
Methods
Generating astrocytic Ins and neuronal NAA DW-signal: DW-signal in fibers Sfiber as a function of diffusion-weighting b is computed with equations for isotropically oriented cylinders with radius rfiber and Dintra6,7. DW-signal in soma Ssoma is computed with equations for spheres of radius rsoma and Dintra6. For each cellular compartment, we consider an 80/20 % fiber/soma volume ratio4:$$S(b)=0.8\times S_{fiber}(r_{fiber},D_{intra},b)+0.8\times S_{soma}(r_{soma},D_{intra},b)[2]$$
Eq.2 is used to simulate Ins and NAA DW-signal, with rsoma=3.8 µm, rfiber=1.3 µm and Dintra(Ins)=0.37 µm²/ms in astrocytes, and rsoma=3.8 µm, rfiber=0.7 µm and Dintra(NAA)=0.35 µm²/ms in neurons4. Here we assume 100%-astrocytic specificity for Ins and 100%-neuronal specificity for NAA.
Generating lactate DW-signal with three-compartment model: for lactate, the intracellular diffusivities Dastro and Dneuro are determined as:
$$D_{astro}=D_{free}(Lac)\times\frac{D_{intra}(Ins)}{D_{free}(Ins)}[3]$$
$$D_{neuro}=D_{free}(Lac)\times\frac{D_{intra}(NAA)}{D_{free}(NAA)}[4]$$
Dfree is the free diffusion coefficient as measured in phantoms (Dfree(Ins)=0.76 µm²/ms; Dfree(NAA)=0.75 µm²/ms; and Dfree(Lac)=0.99 µm²/ms). Lactate DW-signal in astrocytes Sastro and in neurons Sneuron is simulated using Eq.2, while in ECS it is simulated by monoexponential attenuation (Dextra=0.49 µm²/ms). Finally, total lactate signal is computed using Eq.1.
Fitting synthetic DW-signals: synthetic Ins and NAA DW-signals are fitted with Sfiber only, leading to effective astrocytic and neuronal rfiber, Dintra(Ins) and Dintra(NAA). Dastro and Dneuro for lactate were estimated according to Eq.3-4 to then compute Sastro and Sneuro using Sfiber, ultimately feeding the three-compartment model to fit lactate DW-signal (Eq.1). For diffusion in ECS, Dextra is left as free parameter, eventually leaving only fneuron, fastro and Dextra as free parameters in Eq.1. Fitting is performed by non-linear least square regression implemented in MATLAB.
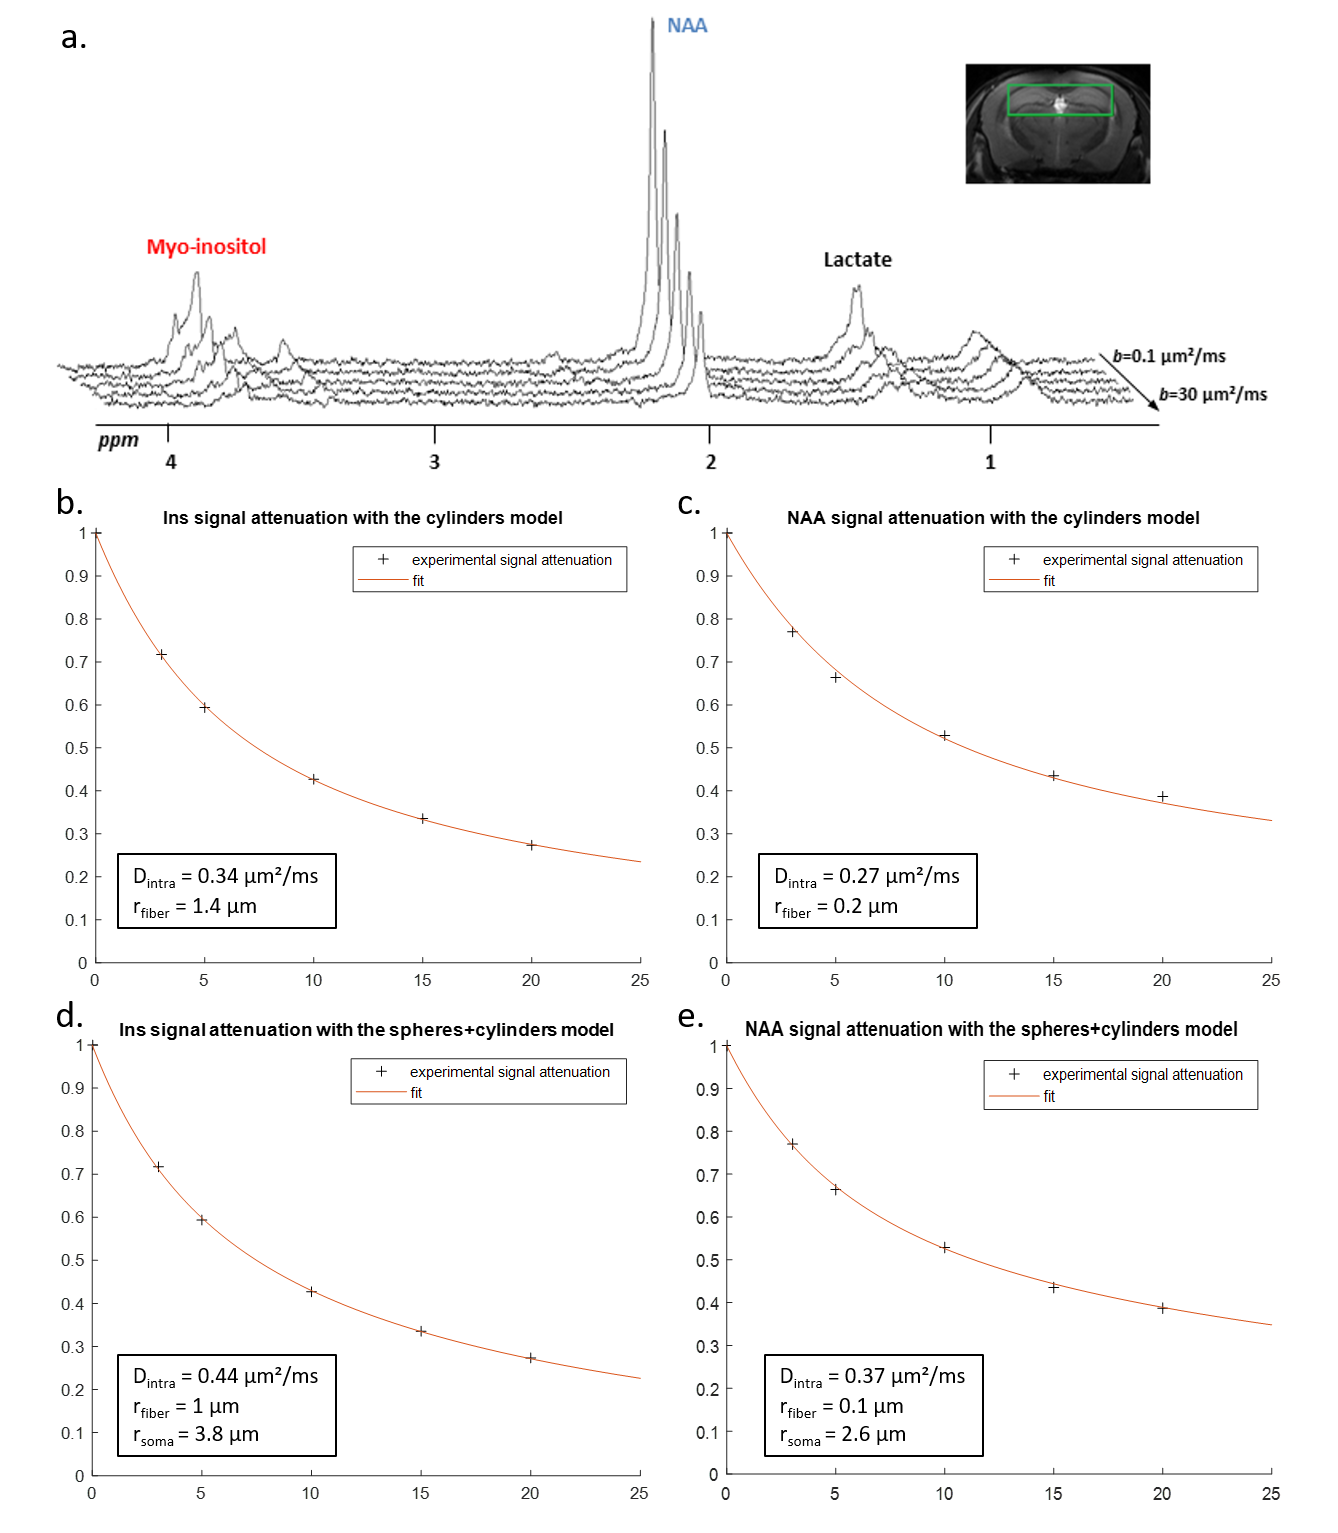
Experimental data: Four mice anesthetized with ~1.5% isoflurane were scanned on an 11.7 T Bruker system with a quadrature surface cryoprobe, using a polychromatic SE-LASER sequence8 (TESE/δ/Δ=58.3/ 3/53.2 ms) at six different b-values (b=0.02, 3.02, 5, 10, 15 and 20 ms/µm², 128 repeats) in a 31.5 µL hippocampal voxel.
Results and discussion
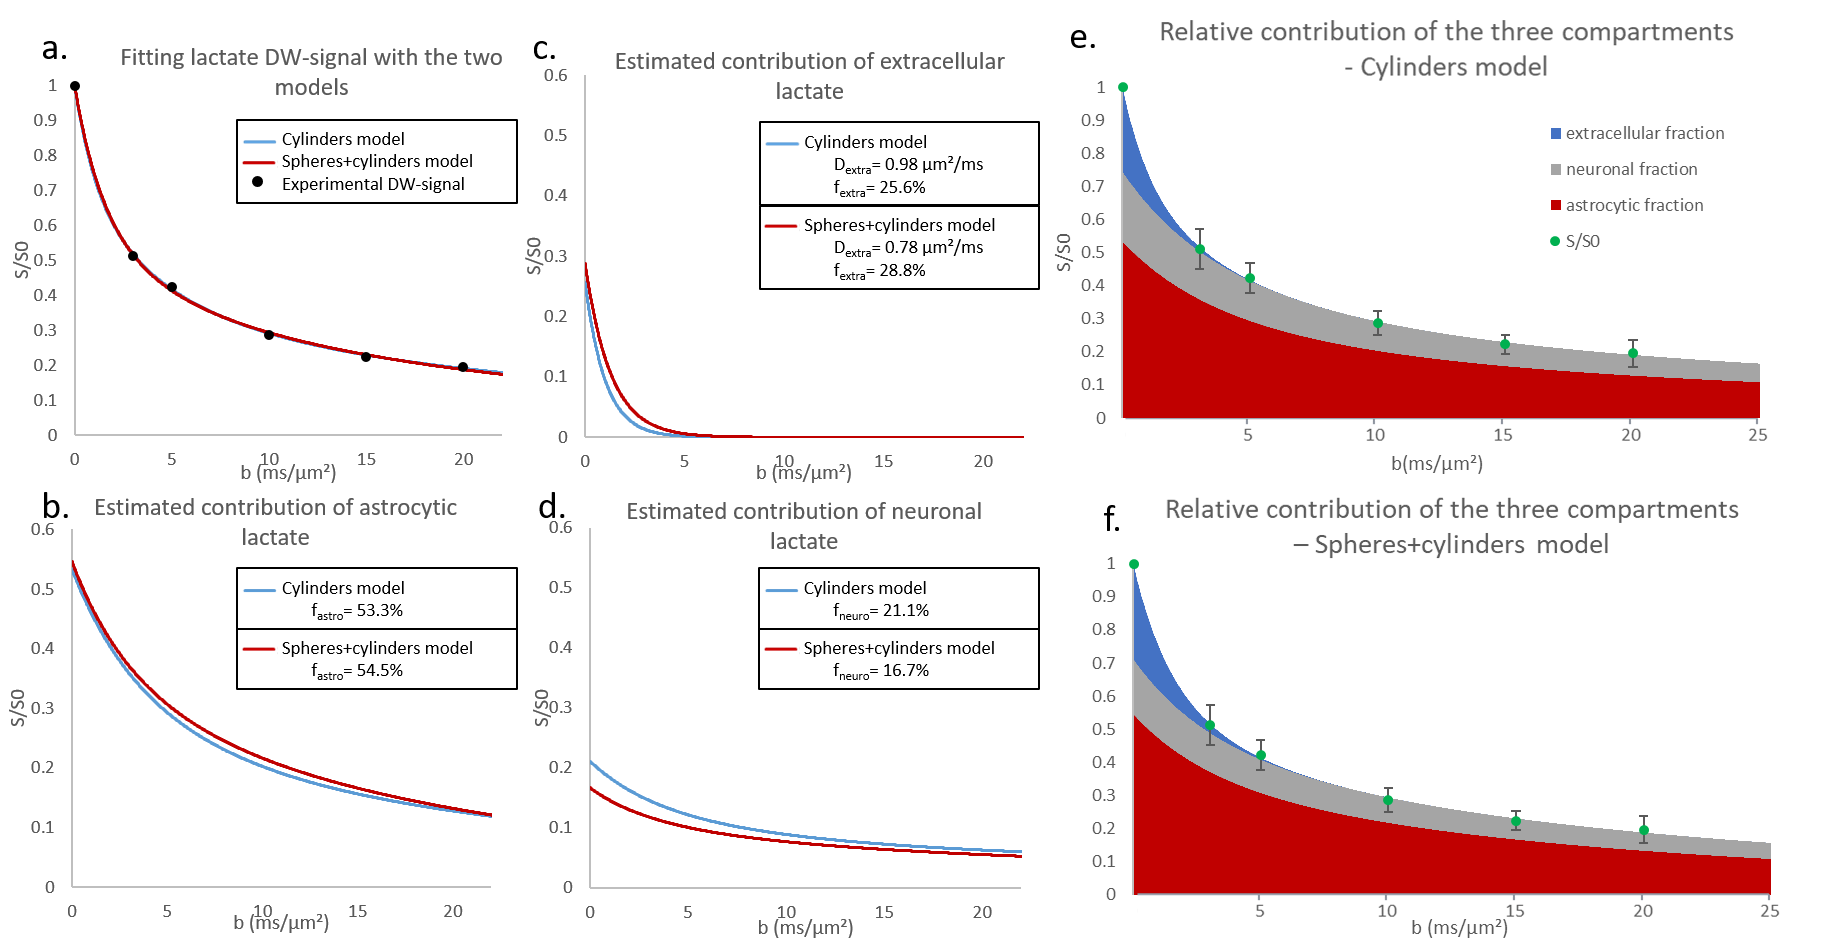
Fiber radii estimated with Sfiber for Ins and NAA were larger than true fiber radii, as expected due to actual soma contribution (with rsoma>>rfiber), and Dintra were smaller (fig.2a-b).Informed by the fiber-only fit of Ins and NAA, we could fit synthetic Lac DW-signal with the three-compartment model, for data generated with the full model using fastro=50%, fneuron=20%, and fECS=1-fastro-fneuron=30% (Fig.2c-d). The fit appears very close to simulated signal up to b=50 ms/µm² (which is extremely challenging to achieve experimentally, due to SNR). Estimated fractions (fastro=53%, fneuron=20%, fECS=27%) are consistent with the nominal ones.
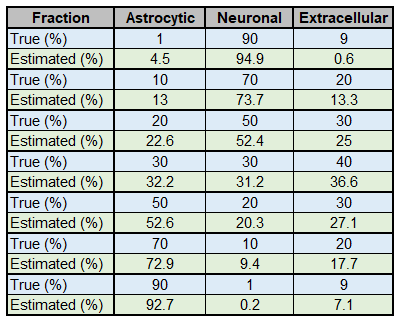
We then decided to simulate different Lac DW-signal for a broad range of fastro and fneuron. Fractions obtained from fitting always remain reasonably accurate (Fig.3).
In vivo data were analyzed with the fiber-only model (like for the synthetic signals), but also with the spheres+cylinders model for comparison. In the latter case, we used the 80/20% fiber/soma volume ratio as priors, but let rsoma, rfiber and Dintra as free parameters when fitting Ins and NAA data. Results for Ins and NAA are reported in Fig.4. Results for Lac are shown in Fig.5. Estimated fractions are quite close for both models, pointing towards lactate being predominantly in astrocytes.
Conclusion
This work shows that even simplistic models, providing biased microstructural parameter values, may actually be used to estimate lactate volume fractions with good accuracy. Such robustness gives confidence in the general framework proposed here to estimate brain lactate compartmentation.Acknowledgements
This project has received funding from the European Research Council (ERC) under the European Union’s Horizon 2020 research and innovation programmes (grant agreement n° 818266)
References
1.Barros LF, Weber B. CrossTalk proposal: an important astrocyte-to-neuron lactate shuttle couples neuronal activity to glucose utilisation in the brain. J Physiol. 2018;596(3):347-350.
2. Mächler, P., Wyss, M. T., Elsayed, M., Stobart, J., Gutierrez, R., Von Faber-Castell, A., Kaelin, V., Zuend, M., San Martín, A., Romero-Gómez, I., Baeza-Lehnert, F., Lengacher, S., Schneider, B. L., Aebischer, P., Magistretti, P. J., Barros, L. F., & Weber, B. In Vivo Evidence for a Lactate Gradient from Astrocytes to Neurons. Cell Metabolism, 2016, 23(1), 94–102.
3. Pfeuffer J, Tkáč I, Gruetter R. Extracellular–Intracellular Distribution of Glucose and Lactate in the Rat Brain Assessed Noninvasively by Diffusion-Weighted 1H Nuclear Magnetic Resonance Spectroscopy In Vivo. Journal of Cerebral Blood Flow & Metabolism. 2000;20(4):736-746.
4. Ligneul C, Palombo M, Hernández-Garzón E, et al. Diffusion-weighted magnetic resonance spectroscopy enables cell-specific monitoring of astrocyte reactivity in vivo. Neuroimage. 2019 May 1;191:457-469.
5. Palombo M, Ianus A, Guerreri M, Nunes D, Alexander DC, Shemesh N, Zhang H. SANDI: A compartment-based model for non-invasive apparent soma and neurite imaging by diffusion MRI. Neuroimage. 2020 Jul 15;215:116835.
6. Palombo, M., Ligneul, C. and Valette, J. Modeling diffusion of intracellular metabolites in the mouse brain up to very high diffusion-weighting: Diffusion in long fibers (almost) accounts for non-monoexponential attenuation. Magn. Reson. Med. 2017; 77: 343-350.
7. P. Linse, O. Soderman, The Validity of the Short-Gradient-Pulse Approximation in NMR Studies of Restricted Diffusion. Simulations of Molecules Diffusing between Planes, in Cylinders and Spheres, Journal of Magnetic Resonance, 1995, Series A, Volume 116, Issue 1, 77-86
8. Malaquin, S., Mougel, E., Vincent, M., & Valette, J. Evaluation of a spectroscopy sequence using polychromatic refocusing to suppress J-modulation and measure lactate diffusion in the rodent brain. Proc. Intl. Soc. Mag. Reson. Med. 2021, 29, 2199.
Figures