1507
Understanding T1 in heterogeneous systems: Extending the two-pool model to fractional order1Physics & Astronomy, University of British Columbia, Vancouver, BC, Canada, 2Radiology, University of British Columbia, Vancouver, BC, Canada, 3UBC MRI Research Centre, University of British Columbia, Vancouver, BC, Canada
Synopsis
Reliably quantifying longitudinal relaxation in heterogenous systems like white matter is challenging because measured parameters are sensitive to details of the measurement technique. In particular, cross-relaxation/magnetization exchange between aqueous and non-aqueous tissue components may lead to multi-exponential relaxation during inversion recovery, depending on the difference in the pools’ initial magnetizations. We use a generalization of the Bloch equations to fractional order to show that the additional component stemming from this exchange is better described by a stretched Mittag-Leffler function than a standard exponential in heterogenous systems. This approach may provide additional information about the material structure.
Introduction
Analyzing longitudinal relaxation using the two-pool model has successfully demonstrated magnetization transfer’s potential role in white matter relaxation1-11. When the pools’ initial bulk magnetizations are prepared in different non-equilibrium states, exchange equalizes the spin polarizations, and appears as an additional T1 component of ~10ms.Recently, a fractional-order generalization of the Bloch equations used to describe spin relaxation has been developed with fractional calculus, labeled SHIFT: stretched time-fractional order12-14. Usual exponential relaxation is replaced by a stretched Mittag-Leffler function, Eβ(-(t/T1)β) with stretching parameter, β, between 0 and 1. When β=1, a standard exponential is recovered.
Our analysis combines the two-pool model and this fractional generalization by fitting inversion recovery (IR) data to a sum of a standard exponential, attributed to the equilibration of magnetization with the lattice, and stretched Mittag-Leffler function, attributed to the magnetization exchange component. We performed IR experiments on three multi-compartment materials: Douglas Fir sapwood, chicken egg yolk, and bovine costal cartilage using solid-state NMR to demonstrate that the SHIFT+exponential model better fits relaxation resulting from selective and adiabatic inversion than standard or stretched exponential functions. We report β<1 in each sample, exhibiting deviation from exponential form. We then consider the hypothesis that β may reflect fractal dimension15, or structural heterogeneity16, at the magnetization exchange interface.
Methods
Samples: A 61mg sample of Douglas Fir (Pseudotsuga menziesi) sapwood was taken from a ~3cm diameter branch, air dried, then soaked in distilled water. Chicken egg yolks were separated and extracted from the whites in large white eggs after boiling for 0-15min. A 155.6mg bovine costal cartilage sample was excised from the meat of a mature cow (Hopcott Farms, Pitt Meadows, BC) after dry aging for 14d and refrigeration in phosphate buffered saline for 24h. Samples were sealed in 5mm NMR tubes with proton-free o-rings and caps.Experiments: Experiments were performed in a 200MHz (4.7T) Oxford Instruments magnet using a home-built spectrometer. An IR sequence was applied with FID acquisition (180°–TI–90°) and 40 inversion times, 10ms - 10s, logarithmically spaced. Each point was repeated 8 times with recycle delay 10s. Four types of inversion pulse were used. A ‘hard’ ~8μs rectangular pulse inverted all proton populations. A 7.5ms three-lobe sinc pulse inverted the aqueous protons with minimal effect on the non-aqueous. A 500ms rectangular pulse with 64Hz amplitude saturated the aqueous population. An adiabatic hyperbolic secant (AHS) pulse was matched to clinically relevant parameters: 10ms, 750Hz maximum amplitude, cutoff β=730s-1 17, and 4kHz bandwidth.
Analysis: IR data were fit using a non-linear least-squares algorithm (‘lsqnonlin’, MATLAB) to four relaxation models: mono-, bi-exponential, stretched Mittag-Leffler (SHIFT)+exponential, and stretched exponential+exponential.
Results
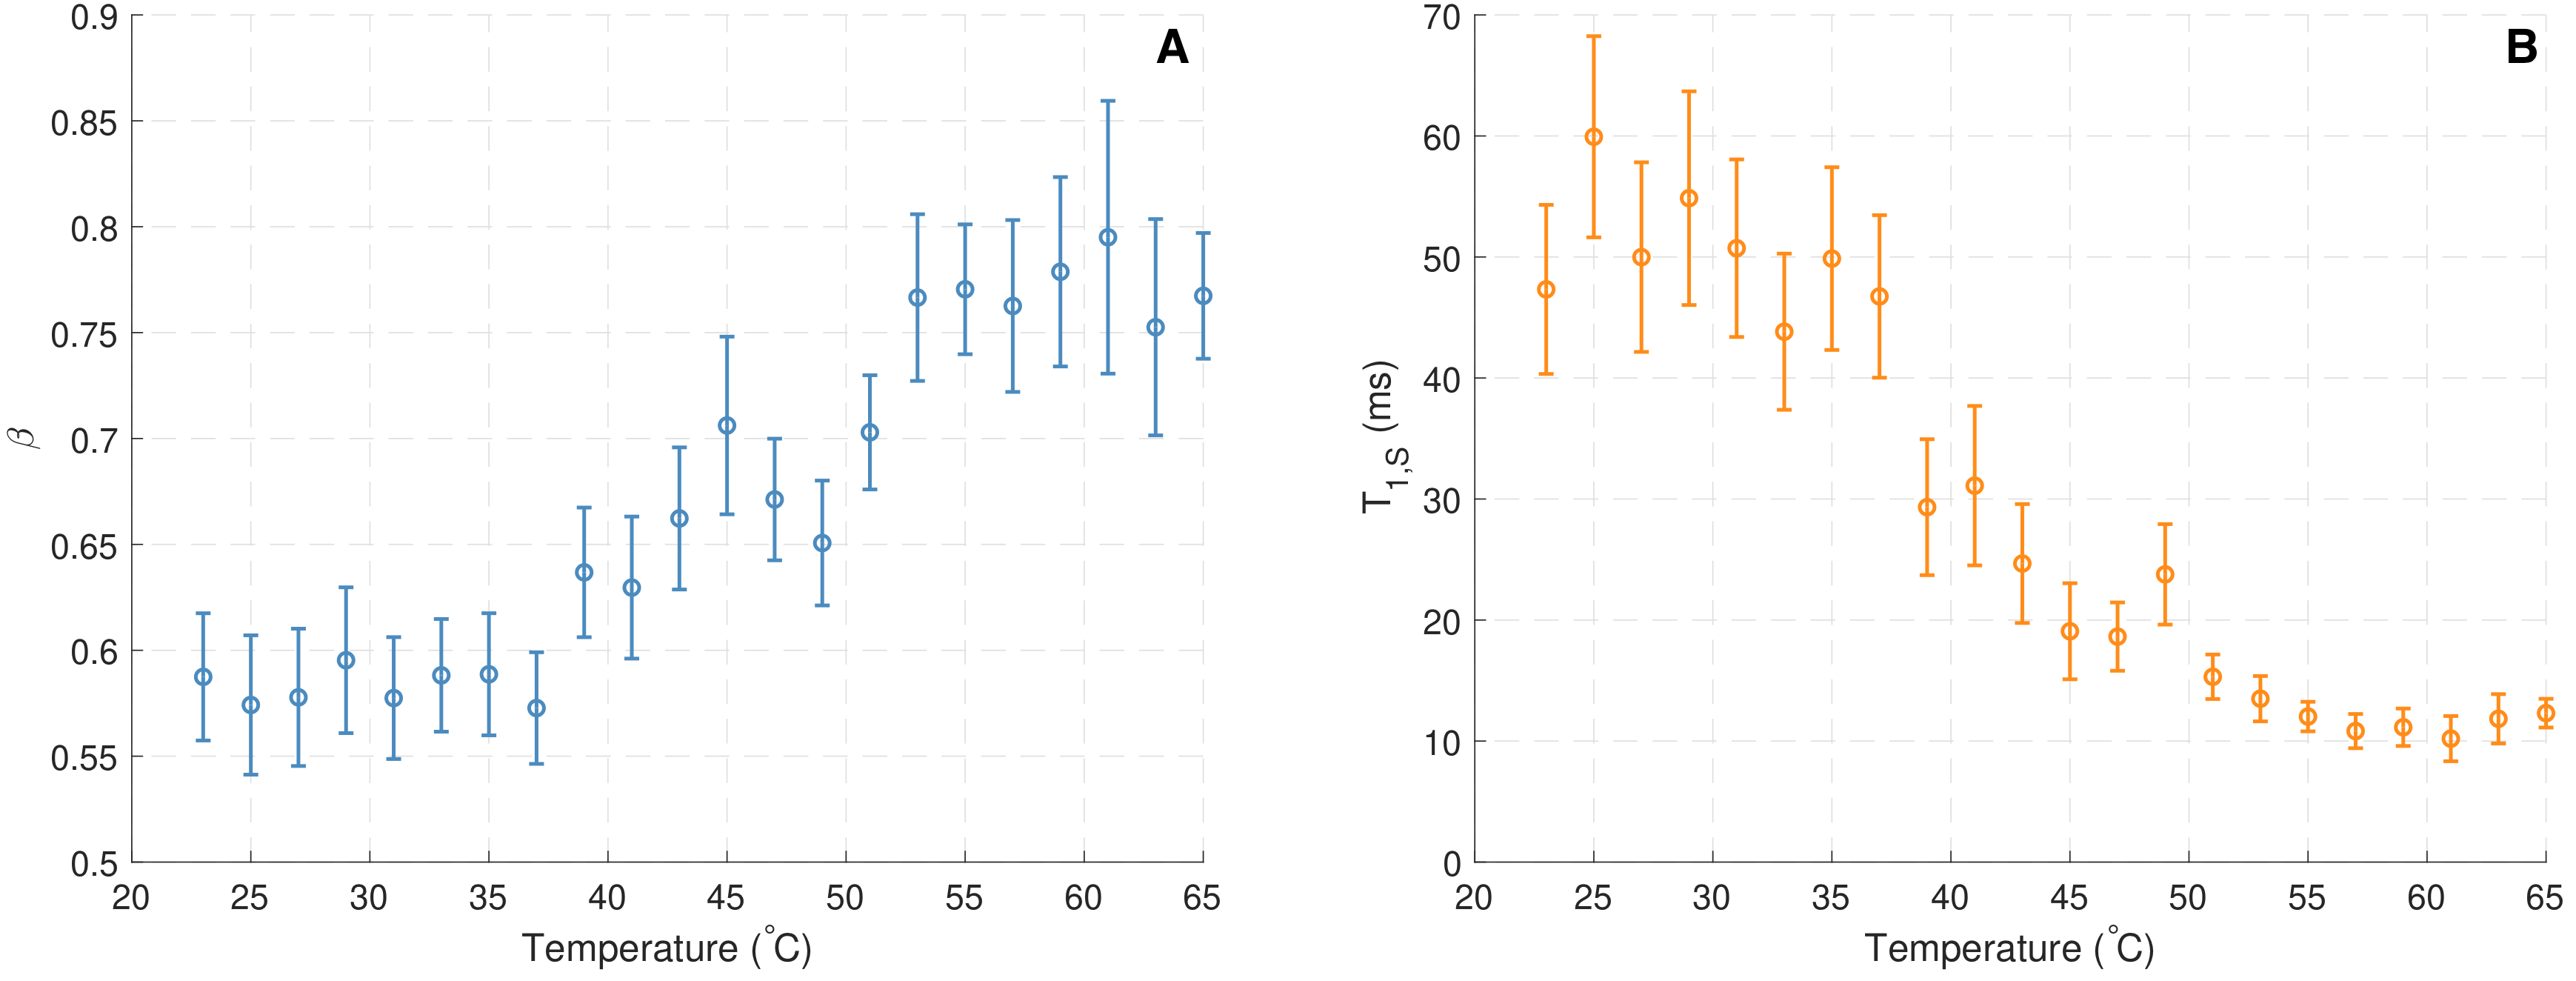
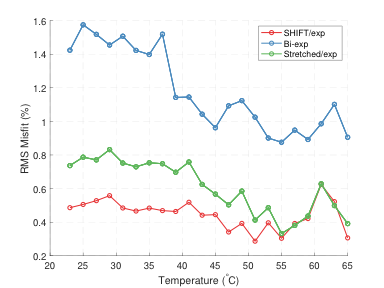
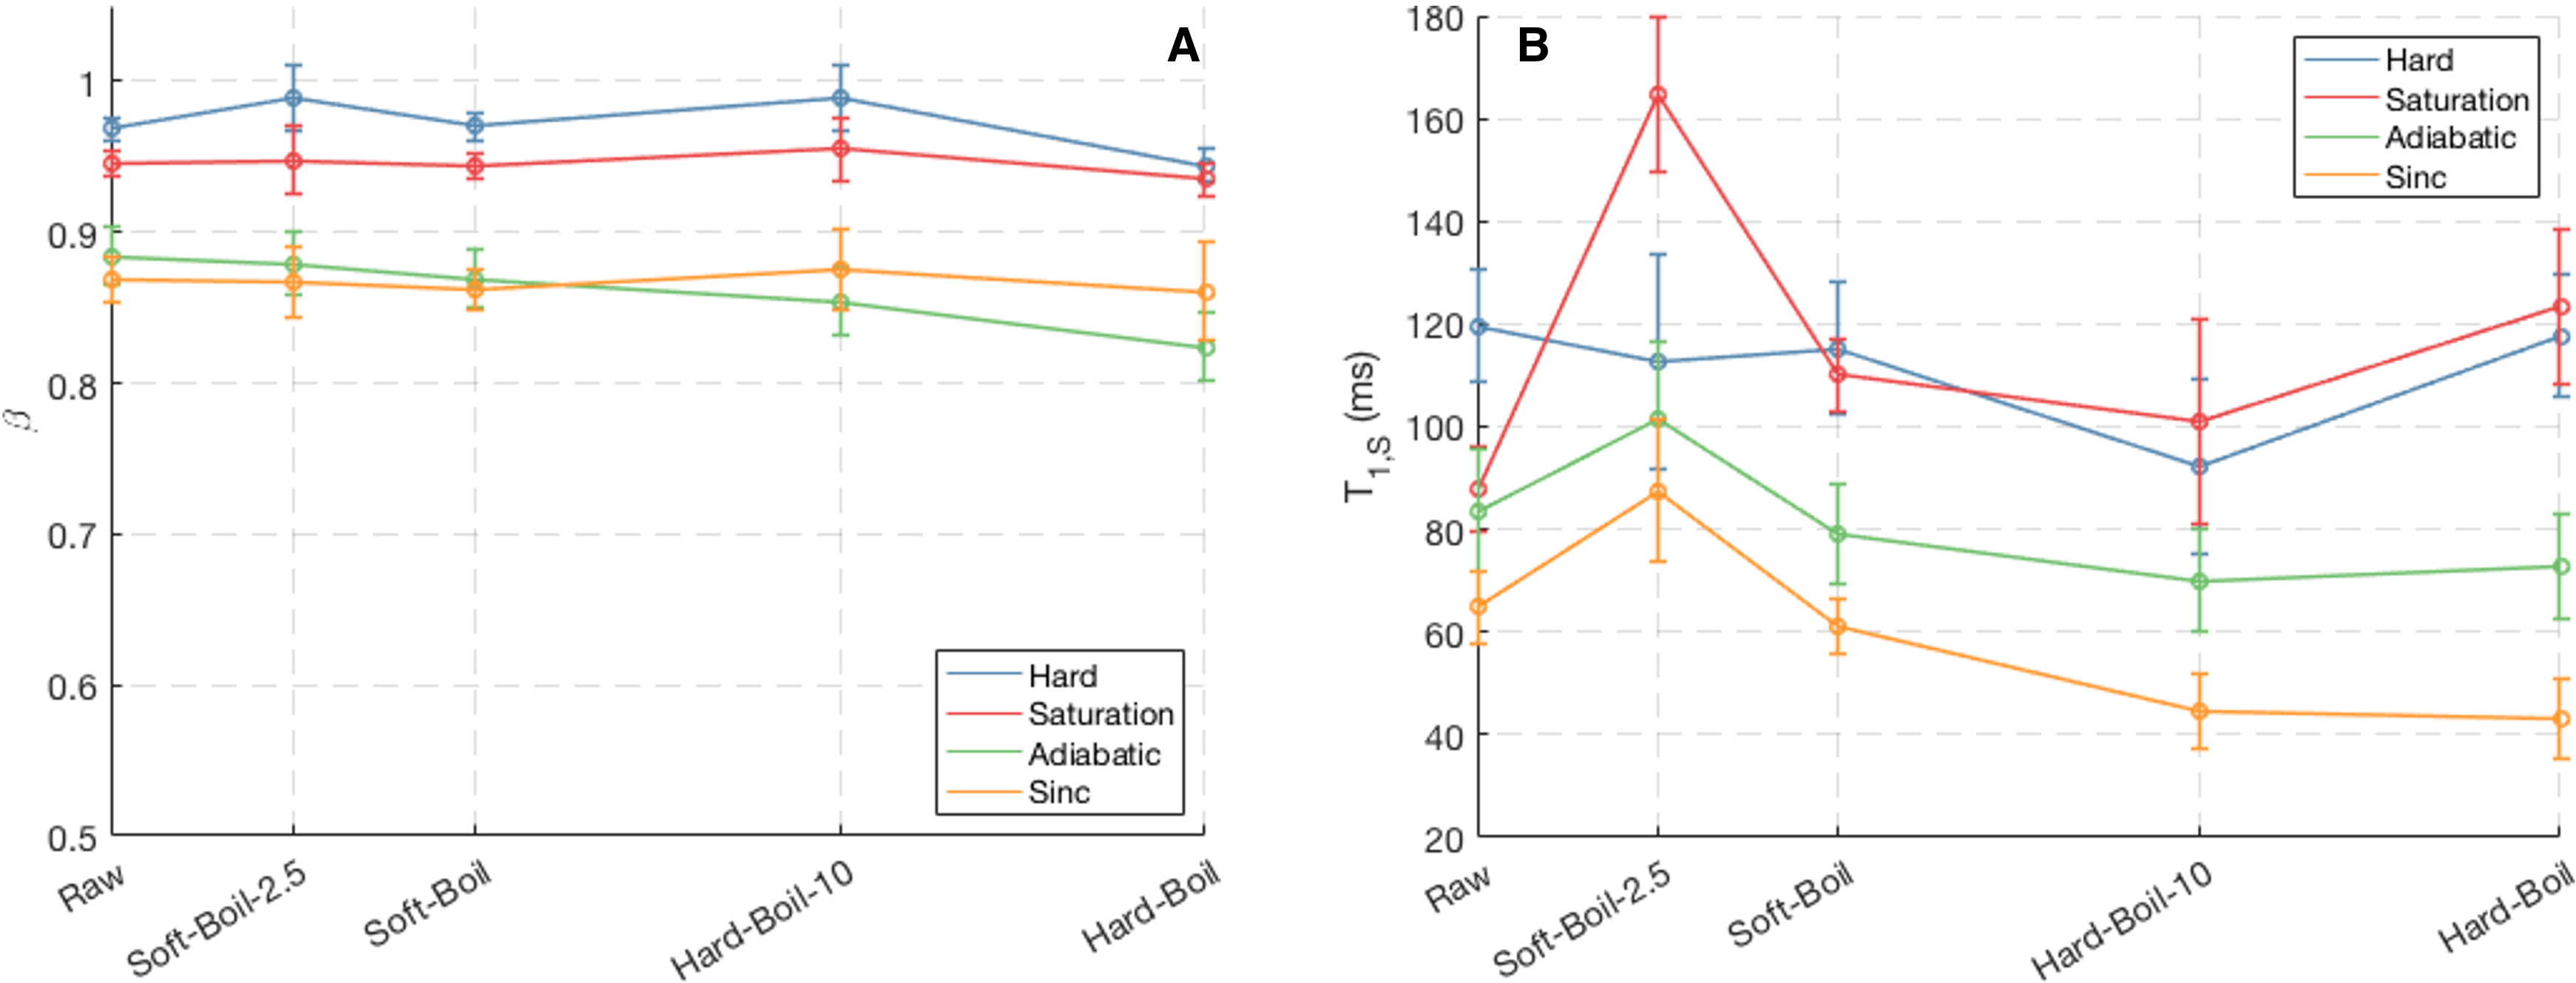
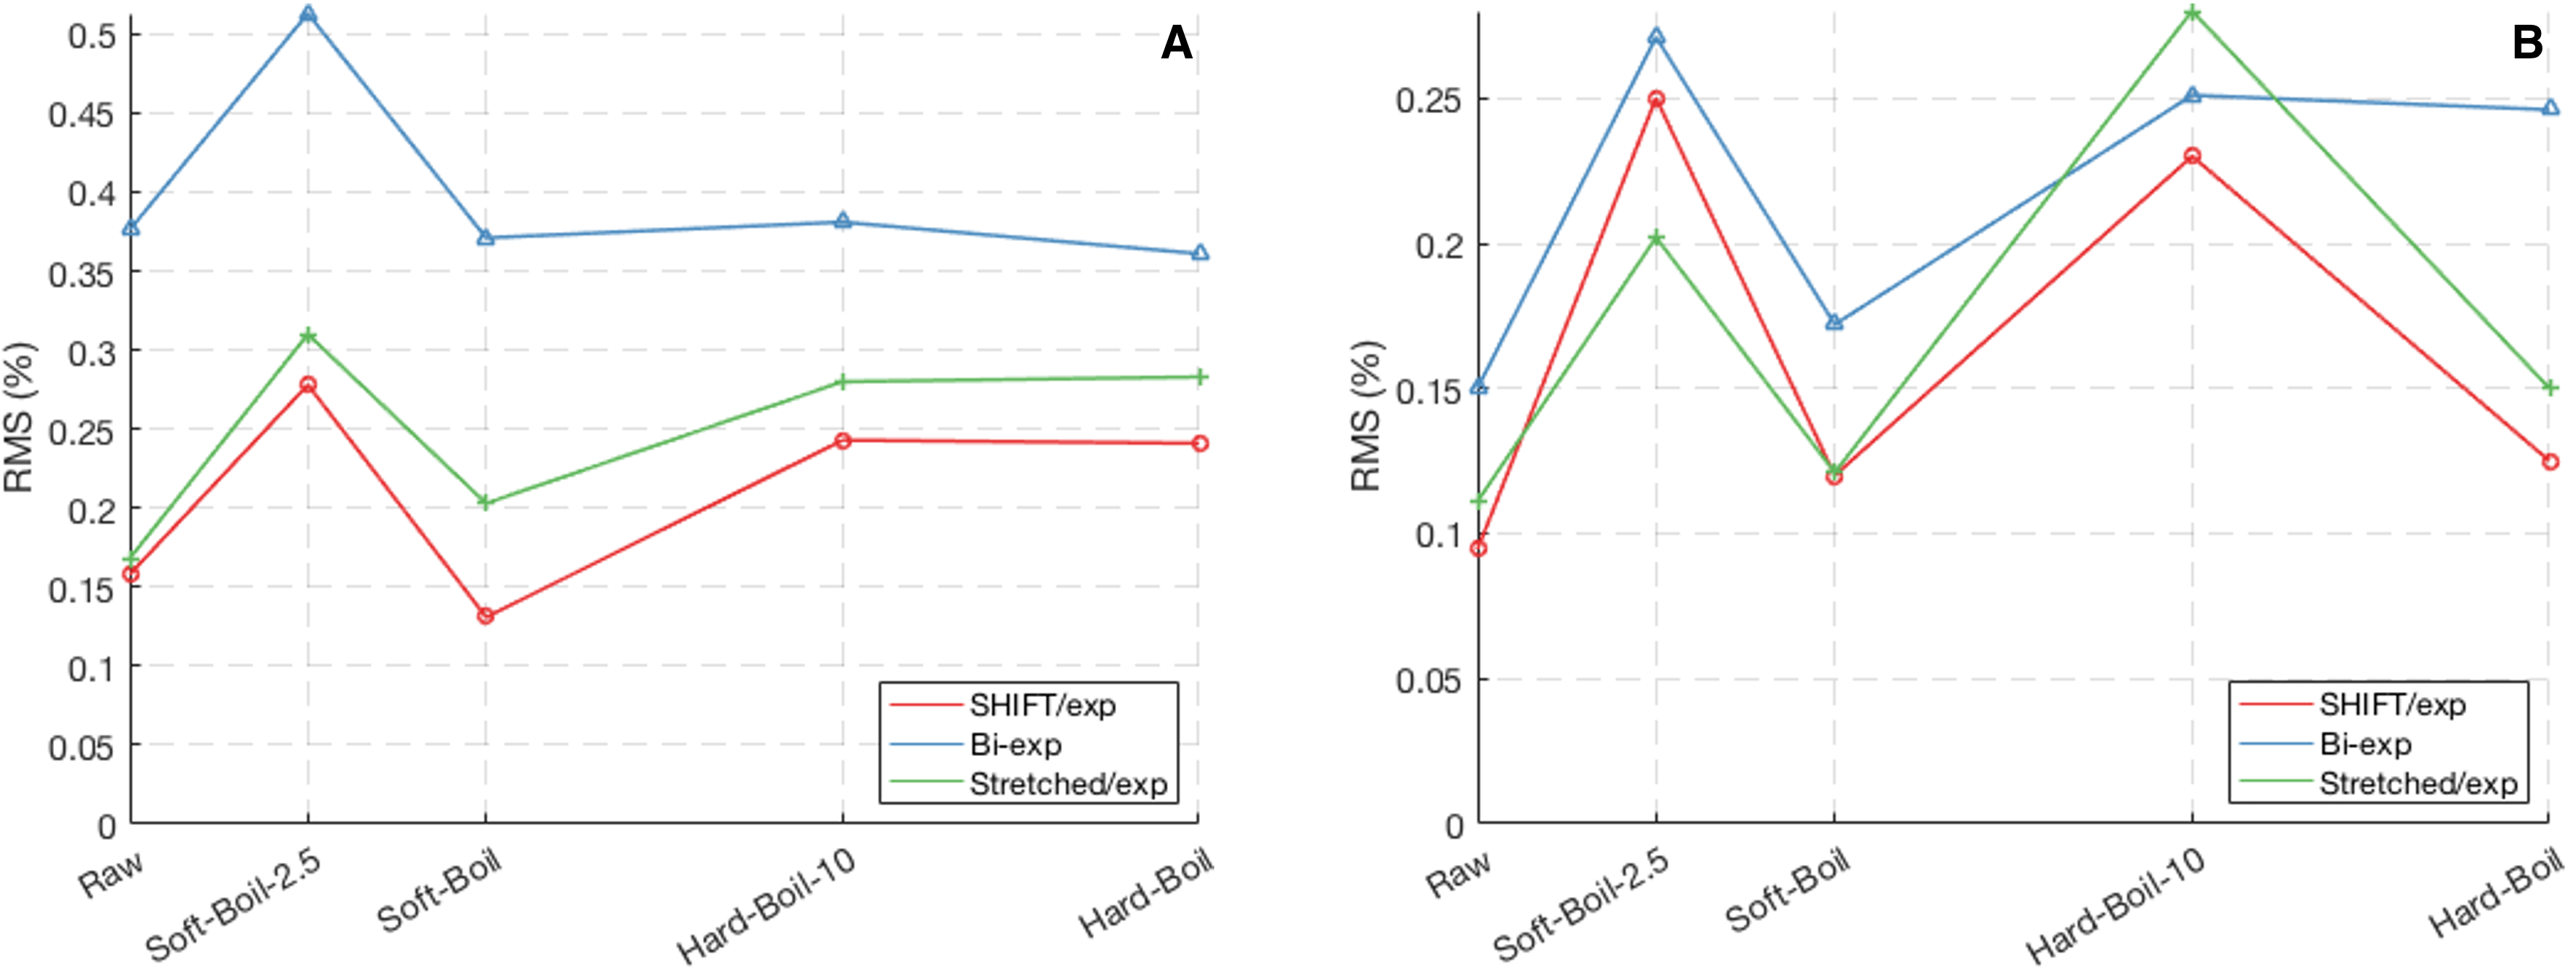
Fit parameters β and T1,S from the SHIFT+exponential model in the Douglas Fir sample following sinc (selective) inversion varied with temperature (Fig. 1). β was significantly less than 1 but increased with temperature while T1,S decreased with temperature. The SHIFT+exponential model decreased misfit over standard and stretched exponentials (Fig. 2). β<1 occurred in all egg samples, especially following sinc and adiabatic inversions. β stayed relatively constant across boil time, while T1,S decreased marginally (Fig. 3). This model again decreased misfit compared to sums of standard or stretched exponentials in all inversion cases but the hard pulse (Fig. 4). In the bovine cartilage sinc IR experiments (Fig. 5) β<1 was found in the sinc and adiabatic inversion cases, but β=1.00(5) and 1.00(2) in the hard inversion and saturation recovery cases. Contrary to the egg and wood samples, the SHIFT+exponential model showed no improvement to a stretched exponential model in the cartilage sample as computed by the difference in Bayesian Information Criteria18.Discussion
Selectively inverting the aqueous proton population (i.e. sinc pulse) creates a difference in polarizations between non-aqueous and aqueous protons. As the pools relax to the lattice, the magnetization exchange-induced (‘short’) T1 component is apparently better described using the SHIFT model than a standard exponential in these multi-compartment systems. Interpretation of the fractional order in diffusion MR19-21 and T2 relaxation12,13,22 is currently a point of debate. Typically, a stretched exponential model is interpreted as a distribution of relaxation times, and the SHIFT model can be interpreted similarly, albeit with a different distribution. Mathematically, the fractional order of a derivative is related to the fractal dimension of the defining space for a variety of functions16. Here though, this understanding is complicated because the Bloch equations incorporate time, rather than spatial derivatives, suggesting a more complex description related to diffusion.β’s increase with temperature in the wood sample may suggest sensitivity to aqueous/non-aqueous surface complexity that is homogenized with faster water diffusion. However, β’s relative immunity to the egg boiling, a dramatic change in microscopic structure for non-aqueous lipids and proteins with exchangeable protons, indicates a less straightforward explanation.
The SHIFT model has not previously shown utility in T1 analysis of cartilage12,23. We demonstrate that β=1 for hard inversion, but when magnetization exchange is important, the SHIFT model becomes applicable.
Conclusion
We introduce an extension to the typical two-pool model of longitudinal relaxation in multi-compartmental systems and show its effectiveness in samples where magnetization exchange is significant. We speculate that the additional parameter, β, may be useful in improving the interpretation of in-vivo T1 mapping in white matter.Acknowledgements
No acknowledgement found.References
1. Rioux JA, Levesque IR, Rutt BK. Biexponential longitudinal relaxation in white matter: Characterization and impact on T1 mapping with IR-FSE and MP2RAGE. Magn. Res. Med. 2016;75(6):2265–2277.
2. van Gelderen P, Jiang X, Duyn JH. E ects of magnetization transfer on T1 contrast in human brain white matter. NeuroImage 2016;128:85–95.
3. Manning AP, Mackay AL, Michal CA. Understanding aqueous and non-aqueous proton T1 relaxation in brain. Journ. Magn. Res. 2020:106909.
4. Does MD. Inferring brain tissue composition and microstructure via MR relaxometry. NeuroImage 2018;182(October 2017):136–148.
5. Harkins KD, Xu J, Dula AN, Li K, Valentine WM, Gochberg DF, et al. The microstructural correlates of T1 in white matter. Magn. Res. Med. 2016;75(3):1341–1345.
6. Barta R, Kalantari S, Laule C, Vavasour IM, MacKay AL, Michal CA. Modeling T1 and T2 relaxation in bovine white matter. Journ. Magn. Res. 2015;259:56–67.
7. Mossahebi P, Yarnykh VL, Samsonov A. Analysis and correction of biases in cross-relaxation MRI due to biexponential longitudinal relaxation. Magn. Res. Med. 2014;71(2):830–838.
8. Prantner AM, Bretthorst GL, Neil JJ, Garbow JR, Ackerman JJH. Magnetization transfer induced biexponential longitudinal relaxation. Magn. Res. Med. 2008;60(3):555–563.
9. Bjarnason TA, Vavasour IM, Chia CLL, MacKay AL. Characterization of the NMR behavior of white matter in bovine brain. Magn. Res. Med. 2005;54(5):1072–1081.
10. Gochberg DF, Gore JC. Quantitative imaging of magnetization transfer using an inversion recovery sequence. Magn. Res. Med. 2003;49(3):501–505.
11. Gochberg DF,Gore JC. Quantitative magnetization transfer imaging via selective inversion recovery with short repetition times. Magn. Res. Med. 2007;57(2):437–441.
12. Magin RL, Li W, Pilar Velasco M, Trujillo J, Reiter DA, Morgenstern A, Spencer RG. Anomalous NMR relaxation in cartilage matrix components and native cartilage: Fractional-order models. Journ. Magn. Res. 2011;210(2):184–191.
13. Zou L, Liang D, Ye H, Su S, Zhu Y, Liu X, Zheng H, Wang H. Quantitative MR relaxation using MR fingerprinting with fractional-order signal evolution. Journ. Magn. Res. 2021;330:107042.
14. Magin RL, Hall MG, Karaman MM, Vegh V. Fractional Calculus Models of Magnetic Resonance Phenomena: Relaxation and Diffusion. Crit. Rev. Biomed. Eng. 2020;48(5):285–326.
15. Magin RL, Karani H, Wang S, Liang Y. Fractional order complexity model of the diffusion signal decay in MRI. Mathematics. 2019;7(4).
16. Liang Y, Su W. Connection between the order of fractional calculus and fractional dimensions of a type of fractal functions. Anal. Theory Appl.. 2007;23(4):354–362.
17. Tannús A, Garwood M. Adiabatic Pulses. NMR in Biomed. 1997;10:423-434.
18. Kass RE, Raftery AE. Bayes factors. Journ. Am. Stat. Assoc. 1995;90(430):773–795.
19. Magin RL, Ingo C, Colon-Perez L, Triplett W, Mareci TH. Characterization of anomalous diffusion in porous biological tissues using fractional order derivatives and entropy. Micro. Meso. Mat. 2013;178:39–43.
20. Yu Q, Reutens D, O’Brien K, Vegh V. Tissue microstructure features derived from anomalous diffusion measurements in magnetic resonance imaging. Human Brain Mapping. 2017;38(2):1068–1081.
21. Magin RL, Abdullah O, Baleanu D, Zhou XJ. Anomalous diffusion expressed through fractional order differential operators in the Bloch-Torrey equation. Journ. Magn. Res. 2008;190(2):255–270.
22. Qin S, Liu F, Turner IW, Yu Q, Yang Q, Vegh V. Characterization of anomalous relaxation using the time-fractional Bloch equation and multiple echo T2*-weighted magnetic resonance imaging at 7 T. Magn. Res. Med. 2017;77(4):1485–1494.
23. Reiter, D. A., Magin, R. L., Li, W., Trujillo, J. J., Pilar Velasco, M., & Spencer, R. G. Anomalous T2 relaxation in normal and degraded cartilage. Magn. Reson. Med. 2016;76(3):953–962.
Figures