1504
Isometric Contractions of the Quadriceps muscle: Strain and Strain Tensor Mapping using Velocity Encoded Phase Contrast Imaging.
Shantanu Sinha1, Ryan Hernandez2, Vadim Malis1, T Oda3, and Usha Sinha2
1Radiology, UC San Diego, San Diego, CA, United States, 2Physics, San Diego State University, San Diego, CA, United States, 3Hyogo University of Teacher Education, Kato, Hyogo, Japan
1Radiology, UC San Diego, San Diego, CA, United States, 2Physics, San Diego State University, San Diego, CA, United States, 3Hyogo University of Teacher Education, Kato, Hyogo, Japan
Synopsis
The quadriceps muscle plays an extremely critical role in various aspects of human locomotion. Changes in its function from various disease such as aging, muscular disuse or modified gait can degrade mobility. VE-PC imaging provides a convenient way to study muscle motion and assess the relative contribution of the thigh muscles to force production. This study is focused on deriving the strain and strain rate tensors to explore patterns along the fiber direction and cross-section. We were able to successfully obtain strain tensor images as well as to follow the temporal variation of these indices in different muscle compartments.
Introduction
Velocity encoded phase contrast imaging of the thigh muscle can provide important information on the relative contribution of the thigh muscles to force generation. If muscle fibers run in the plane of the image, then the fiber end points can be tracked using the velocity data to track the fiber points through the dynamic cycle and fiber strains can be calculated. However, the fibers in the thigh are not conveniently imaged in-plane of the image so that calculation of strains becomes difficult. Strain and strain rate tensors can be derived from the velocity data and the eigenvalues of these tensors provide a convenient way to obtain the involvement of the different thigh muscles during isometric contraction and contribution to force production.Methods
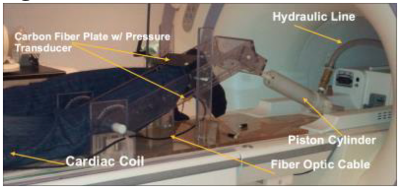
Seven healthy subjects (Mean Age: 27.0+7.1yr), were recruited after IRB consent and scanned on a 1.5T GE scanner. A foot pedal device developed for dynamic studies of the lower leg was modified [1] (Fig.1), to image the thigh during isometric contractions (at 40% MVC),with the subject lying feet-first, prone, and a multi-channel cardiac coil positioned on the center of the femur. The tibia rested on a carbon- fiber plate held by acrylic arms whose inclination could be changed to vary the knee joint angle, held at 20 o for these experiments. A fiber-optic pressure sensor glued on its lower side sensed the pressure exerted by the subject, this signal was visually displayed superposed on the target force pattern. This ensured that the force level was constant through the multiple (~75 contractions) required to complete the acquisition. VE-PC scans were collected at three axial sections at the middle of the thigh and17.5% proximal and distal to the mid-point. The VE-PC scans were velocity encoded in all 3 directions (VENC=10cm/s), with TE/TR: 6.3/24.2ms, 256x256 matrix, 4 views per segment, 5 mm slice thickness,20x14cm FOV, gated with 22 phases per cycle of ~3 sec.2D strain and SR tensors were calculated for the acquired slice. Prior to the analysis, the phase-contrast images were corrected for phase shading artifacts and denoised using a 2D anisotropic diffusion filter [2]. Voxels in the entire volume were tracked to obtain displacements and locations in subsequent temporal frames. The 2D strain and SR images were generated from the spatial gradients of the velocity and displacement images and diagonalized to yield Eulerian, E, strains and SR in the principal basis. The maximum shear strain and shear strain rate maps were calculated from the principal normal strains. Temporal plots were performed in ROIs placed in thigh muscle compartments (33).Results
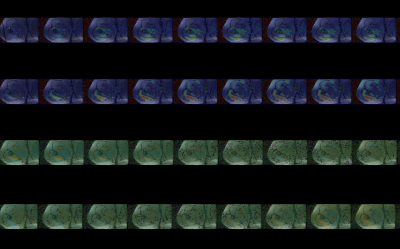
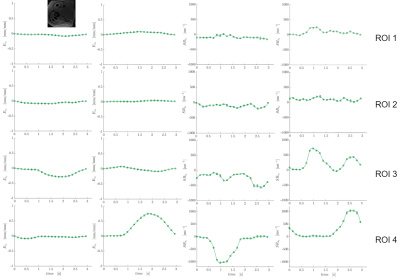
Figure 1 shows the modified leg pedal device used for mapping thigh muscle motion during isometric contraction. All subjects were able to follow the visual clue and maintain consistent contractions at 35% MVC for the duration of the acquisition. Figure 2 shows the maps of displacement and velocity in the x and y directions as a function of the dynamic cycle (select frames with the maximum changes are shown).This figure shows that velocity and displacement vary significantly across the thigh muscles. Figure 3 shows the strain components: negative strain eigenvalue along the fiber direction, positive strain eigenvalue in the fiber cross-section, an out of plane component derived from the other two eigenvalues and the incompressibility of muscle tissue. The maximum shear strain images are also shown in this figure. Similar images of the eigenvalues of the strain rate tensor and maximum shear strain rate were obtained. Figure 5 is a plot of strains and strain rate tensor components in four different ROIs placed in different compartments of the thigh muscle to illustrate the heterogeneity of strain and strain rates with the inset showing the locations of the ROIs.Discussion
We were successfully able to acquire images of the thigh with the modified foot pedal device at 40% MVC. The calculated strain tensor maps and strain rate tensor maps extracted from these velocity images had sufficient signal to noise; these tensor maps are sensitive to noise since the processing involves taking spatial gradients. The application of the anisotropic diffusion filter reduced noise enabling the acquisition of strain and strain rate tensors. Heterogeneity of strain and strain rate eigenvalues are seen in the temporal plots in 4 ROIs and shows that the involvement of the different thigh muscles vary.Conclusion
Strain tensor mapping extends the applicability of the VE-PC technique to study features like transverse anisotropy of deformation ,shear strains, and indices related to lateral force transmission that will enable a better understanding of the physiology of thigh muscles.Acknowledgements
This work was supported by the National Institute on Aging Grant No. R01AG056999.References
[1] Oda et al. Proc ISMRM 2017,49.
[2] Sinha S, et al. J Magn Reson Imaging. 2012; 36(2): 498–504.
Figures

Figure
1: Servo-Motor Driven, MR compatible Hydraulic Device for Dynamic Imaging of
thigh muscles, during leg extension and curl, with
isometric,
concentric and eccentric contractions, with the force exerted by the thigh
muscles being monitored with a Fabry-Perot fiber-optic
cavity
transducer glued to a carbon-fiber plate on which the tibia rests. For isometric
contractions, the lower leg is fixed at a desired angle of
the knee
joint. The patient is positioned so that he can see both a video
target-force-level cue, as well as the force he is exerting in real time,
projected on to a screen.

Figure 2: Displacement images (dx and dy- top two rows) and Velocity
Images (vx and vy- bottom two rows) during the temporal cycle. Only a few select frames are shown here—the
maximum changes in velocity and displacement take place in the frames shown
here. Heterogeneity of velocity and
displacement across the muscle compartments can be readily visualized.

Figure 3: Strain tensor images: Rows from top to bottom: Negative
eigenvalue, Positive Eigenvalue, Out-plane eigenvalue and Shear strain images.
As in Figure 2, a few select frames are displayed. Heterogeneity of strain tensor components
across the muscle compartments can be readily visualized.

Figure 4: Temporal plot of strain and strain rate components in 4 ROIs
placed in different thigh muscle compartments.
The inset and red dots show the location of the ROIs. The heterogeneity can be seen in the large
strain and strain rate values in ROIs 3 and 4.
DOI: https://doi.org/10.58530/2022/1504