1502
Characterizing exchange dynamics in a urea phantom via T2-T2 relaxometry using a non-linear least squares fitting method1Neuromuscular investigation center, Institute of Myology, Paris, France, 2NMR Laboratory, CEA/DRF/IBFJ/MIRCen, Paris, France
Synopsis
The multiexponential T2 of water in biological tissue is known to reflect microscopic anatomical compartmentation. T2-T2 correlation relaxometry allows characterizing compartmental sizes, intrinsic T2 values and exchange rates, which are of upmost clinical relevance. However, inversion of relaxation data into T2 spectra is an ill-posed problem. Regularized Inverse Laplace transform (rILT) provides stable solutions, but these are penalized by low spectral resolution and relatively high computational complexity. Here we do T2-T2 relaxometry of a urea solution and show that, for such bi-compartment system, non-linear least squares fitting provides solutions that are more accurate while avoiding the difficulties related to rILT.
Introduction
The T2 relaxation of water in skeletal muscle is multiexponential.1 Most studies suggest that this behavior reflects some level of the microscopic anatomical compartmentation of water in the tissue.2-4 Furthermore this multiexponential behavior has been recently shown to allow distinguishing between inflammatory and dystrophic muscular diseases,5 suggesting that it contains potentially specific physiological and morphological information, which highlights the clinical relevance of assessing compartments’ intrinsic T2 values and relative fractions. However, in order to asses such parameters from the 1D T2 spectra, compartmental exchange rates must be known. 2D relaxation-exchange methods, such as the T2-T2 relaxometry, could provide such information.6 Inversion of 2D relaxation data into 2D spectra is an ill-posed problem. Although stable solutions can be obtained via regularized Inverse Laplace Transform (rILT),7 these are penalized by relatively low spectral resolution and require relatively high computational complexity. We have recently proposed a simple non-linear least squares (NLLS) fitting approach that provides more precise and accurate results, in simulated data.8 Here, we describe the continuation of this previous work, and demonstrate the proof of concept by presenting the results of an in vitro study using an urea solution that mimics a bi-compartment system characterized by exchange rates and T2 values comparable to those observed in skeletal muscle.Methods
Urea phantom An 8-molar urea solution was prepared by dissolving urea powder (SIGMA-ALDRICH, MO, USA) in phosphate buffered saline (SIGMA-ALDRICH, MO, USA), yielding a ratio of 42/58% for urea/water protons. In order to accelerate proton exchanges, the pH was increased to 8.6 by addition of a sodium hydroxide solution (SIGMA-ALDRICH, MO, USA). Finally, T2 was reduced by addition of chloride manganese (SIGMA-ALDRICH, MO, USA) at 0.13 mM. NMR System and sequence Experiments were done on a pre-clinical 7 T system. The CPMG-storage-CPMG sequence (Fig. 1) for 2D T2-T2 relaxometry was parametrized as follows: inter-echo-spacing (IES) = 2ms; number of echoes in the 1st CPMG (n1) 2, …, 750 (in 35 pseudo-logarithmic spaced steps); number of echoes in the second CPMG (n2) = 750; storage time (TS) = 20, …, 2000ms (in 10 logarithmically spaced steps); and TR = 10s. Keeping only the even echoes, this resulted in a 35x375 2D relaxation data per TS value. A 2-step phase-cycling scheme was applied, resulting in a total acquisition time of 1h47min. Data processing Two methodologies for data processing were applied. The reference one, based on rILT is described as follows: T2-T2 spectra were obtained from rILT9 of each 2D relaxation data; the diagonal and off-diagonal peaks were identified in each spectrum, taking care to exclude spurious artifactual peaks; finally, the relative fractions of each peak were calculated. For our proposed approach, each 2D relaxation data was directly fitted, via NLLS, using the following model:$$S(n_1,n_2) = P_{11}e^{-(n_1+n_2)IES/T2_1}+P_{22}e^{-(n_1+n_2)IES/T2_2}+P_{12}(e^{-(n_1/T2_1+n_2/T2_2)IES}+e^{-(n_1/T2_2+n_2/T2_1)IES}) $$(1)
Where $$$P_{11}$$$, $$$P_{22}$$$, $$$P_{12}$$$, $$$T2_1$$$ and $$$T2_2$$$ are the adjustable variables; $$$P_{11}$$$ and $$$P_{22}$$$ are the fractions of magnetization that did not exchange during the TS interval (equivalent to the diagonal peaks in the T2-T2 spectrum), and $$$P_{12}$$$ represents the fraction that did exchange (off-diagonal peaks), and $$$T2_1$$$ and $$$T2_2$$$ are the apparent T2 values. Finally the intrinsic parameters $$$m_0^{a}$$$,$$$τ_a$$$, $$$T2_a$$$ and $$$T2_b$$$, defined in figure 2, were estimated by fitting the experimental curves for the peak amplitudes as functions of TS, obtained from both processing methods (rILT and NLLS), to the theoretical model derived from the analytical solutions of the Bloch-McConnell equations6. The coefficient of determination (R2) was calculated in order to evaluate the quality of the fits. The time taken for data processing was also measured.
Results
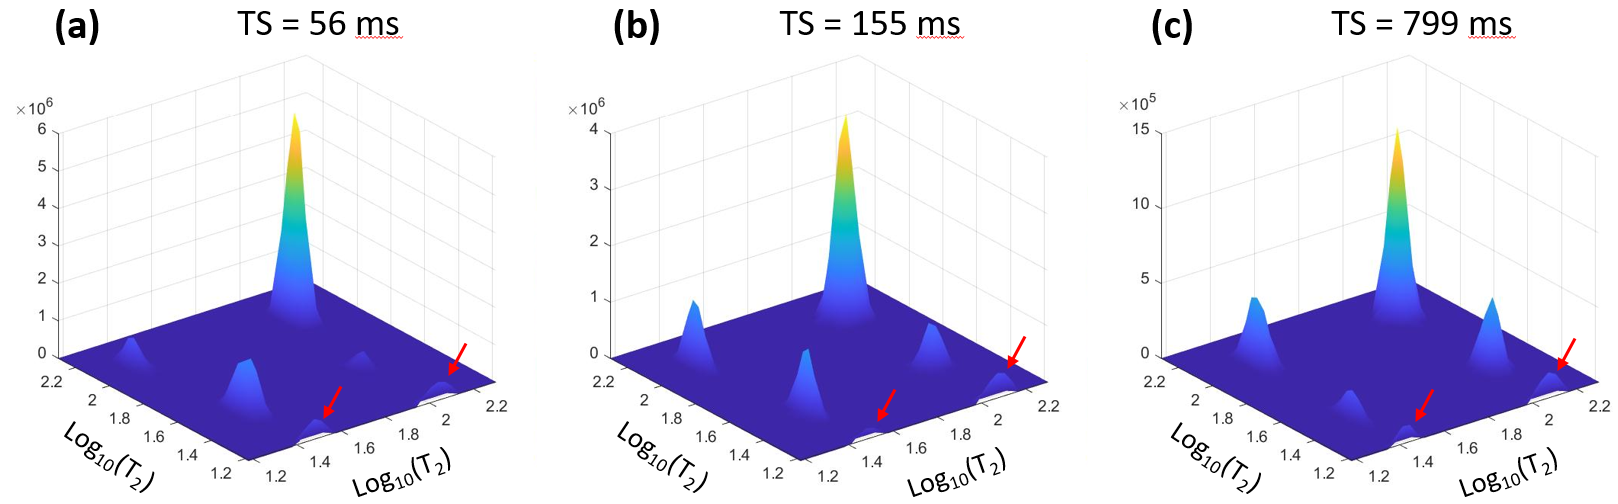
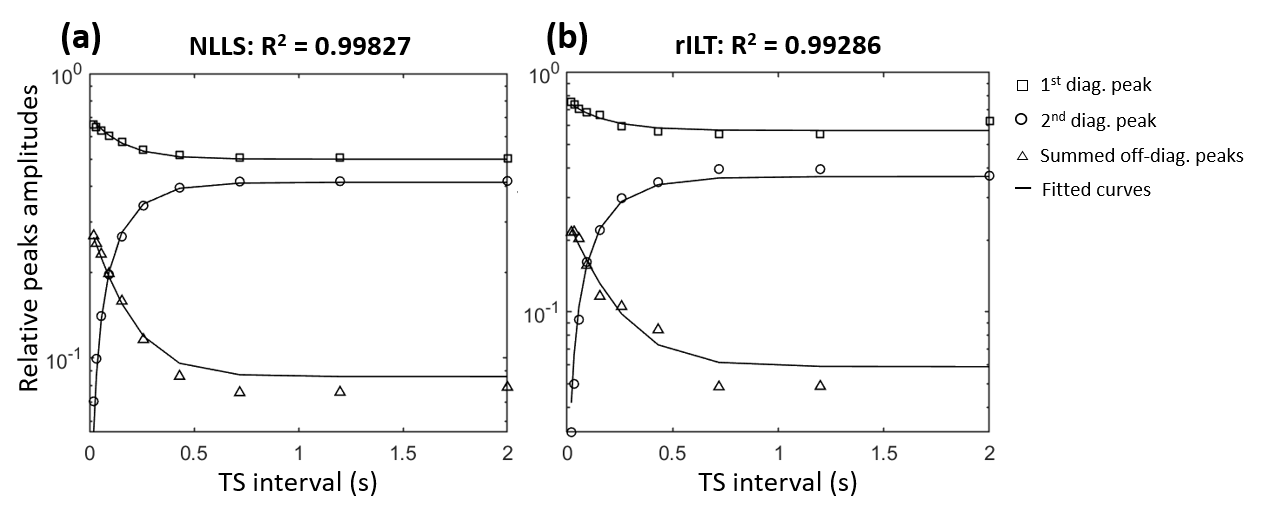
Examples of T2-T2 spectra obtained by rILT are presented in figure 3. One can clearly identify two diagonal and two off-diagonal peaks; note the increase in the relative amplitudes of the off-diagonal peaks for longer TS values. Figure 4 shows the plots of the relative peak amplitudes as functions of TS, obtained from both data processing methods as well as the corresponding fitted curves. The estimated intrinsic parameters of the compartments using both methods are presented in Table 1. The estimated relative fractions of urea protons with the NLLS- and the rILT-based processing methods were 41% and 33%, respectively, and the NLLS derived data was systematically better fitted (higher R2, Fig. 3). Furthermore, the NLLS-based data processing took 33 seconds, against 12 minutes for the rILT-based methodology.Discussion
The NLLS fitting of T2-T2 relaxation data seems to provide a more accurate quantification of the diagonal and off-diagonal peaks in the T2-T2 spectra. Not only the estimated relative fraction of urea protons was closer to the stoichiometric value, but also the superior quality of the fit suggests a better agreement between the observed relative peak amplitudes as a function of TS, and the theoretical prediction from the Bloch-McConnell equations. Taking into account its simplicity and superior time-efficiency, the NLLS approach provides an interesting method for fitting T2-T2 relaxation data when the number of compartments is known. A bi-component T2 relaxation behavior has been observed in skeletal muscle tissue.4,5 In the future, we intend to apply the methodology described in the present work for investigating such behavior.Acknowledgements
No acknowledgement found.References
1. Hazlewood C F, Chang D C, Nichols B L, et al. Nuclear Magnetic Resonance Transverse Relaxation Times of Water Protons in Skeletal Muscle. Biophys J. 1974;14(8):583-606.
2. Le Rumeur E, De Certaines J, Toulouse P et al. Water Phases in Rat Striated Muscles as Determined by T2 Proton NMR Relaxation Times. Magn Reson Imaging. 1987;5(4):267-272.
3. Bertram H, Karlsson A, Rasmussen M, et al. Origin of Multiexponential T2 Relaxation in Muscle Myowater. J Agric Food Chem. 2001;49(6):3092-3100.
4. Araujo E C A, Fromes Y and Carlier P G. New Insights on Human Skeletal Muscle Tissue Compartments Revealed by In Vivo NMR Relaxometry. Biophys J. 2014;106(10):2267-2274.
5. Araujo E C A, Marty B, Carlier P G, et al. Multiexponential Analysis of the Water T2-Relaxation in the Skeletal Muscle Provides Distinct Markers of Disease Activity Between Inflammatory and Dystrophic Myopathies. J Magn Reson Imaging. 2021;53(1):181-189.
6. Dortch R D, Horch R A and Does M D. Development, simulation, and validation of NMR relaxation-based exchange measurements. J Chem Phys. 2009;131(16):164502
7. Whittall K and MacKay A. Quantitative Interpretation of NMR Relaxation Data. J Magn Reson. 1989;84:134–152
8. Araujo E C A, Baudin PY, Reyngoudt H, et al. An alternative least squares method for fitting 2D T2-T2 relaxometry data. Proc. 38th ESMRMB Scientific Meeting (2021); Abstract 145.
9. Venkataramanan L, Song YQ, Hürlimann M D. Solving Fredholm integrals of the first kind with tensor product structure in 2 and 2.5 dimensions. IEEE Trans Signal Process. 2002 ; 50(5):1017-1026
Figures