1501
MRI Monitoring of Changes in Kidney Size during Pathophysiological Intervention1Berlin Ultrahigh Field Facility (B.U.F.F.), Max Delbrueck Center for Molecular Medicine in the Helmholtz Association, Berlin, Germany, 2Institute of Physiology, Charité - Universitätsmedizin Berlin, Berlin, Germany, 3Experimental and Clinical Research Center, a joint cooperation between the Charité - Universitätsmedizin Berlin and the Max Delbrueck Center for Molecular Medicine, Berlin, Germany
Synopsis
Several renal pathologies are associated with changes in kidney size, offering an opportunity for magnetic resonance imaging (MRI) biomarkers of disease. An automated bean-shaped model was developed for kidney size measurements in rats using parametric MRI (T2, T2* mapping). The ABSM approach was applied to longitudinal renal size quantification during pathophysiologically relevant interventions affecting kidney size. A precision and accuracy similar to manual segmentation was achieved allowing size changes of 2% to be detected reliably. This can potentially be instrumental for developing MRI-based diagnostic tools for various kidney disorders and for gaining new insight into mechanisms of renal pathophysiology.
Introduction
Kidney diseases are a major health issue, with increasing incidence and an estimated 5 to 10 million deaths per year worldwide1-2. Whilst several biomarkers are currently being investigated for diagnosis of renal diseases, to date, clinical point‐of‐care biomarkers are still lacking for major renal diseases3-4. An increasing body of literature outlines the potential of non-invasive imaging in evaluating renal size as a clinical parameter in the diagnosis, treatment and determination of prognosis in major renal diseases5-7. Recognizing this opportunity and the crucial importance of monitoring kidney size changes in the context of renal disease and for gaining new insight into mechanisms of renal pathophysiology, we applied a new, automated geometry-based bean-shaped model (ABSM) in dynamic MRI for longitudinal quantification of pathophysiologically relevant changes in kidney size in rats.Methods
The mid-slice cross-sectional area (hereafter referred to as ‘renal size’) was determined from T2- and T2*-maps of the rat kidney using a bean-shaped model. An analytic function describing the shape of the kidney was used and fitted to the edges found in the MR images. The function in equation 1 was found to describe the shape of a coronal slice of rat kidneys very well:$$$ r = A (a sin³(θ-θ0) + b cos³(θ-θ0) +0.1 sin5(θ-θ0+π/4) $$$ Equation 1
r, curve describing the kidney border as a function of the polar angle θ; A, kidney size parameter; a, b, kidney anisotropy parameters b²=2-a²; θ0, rotation angle.
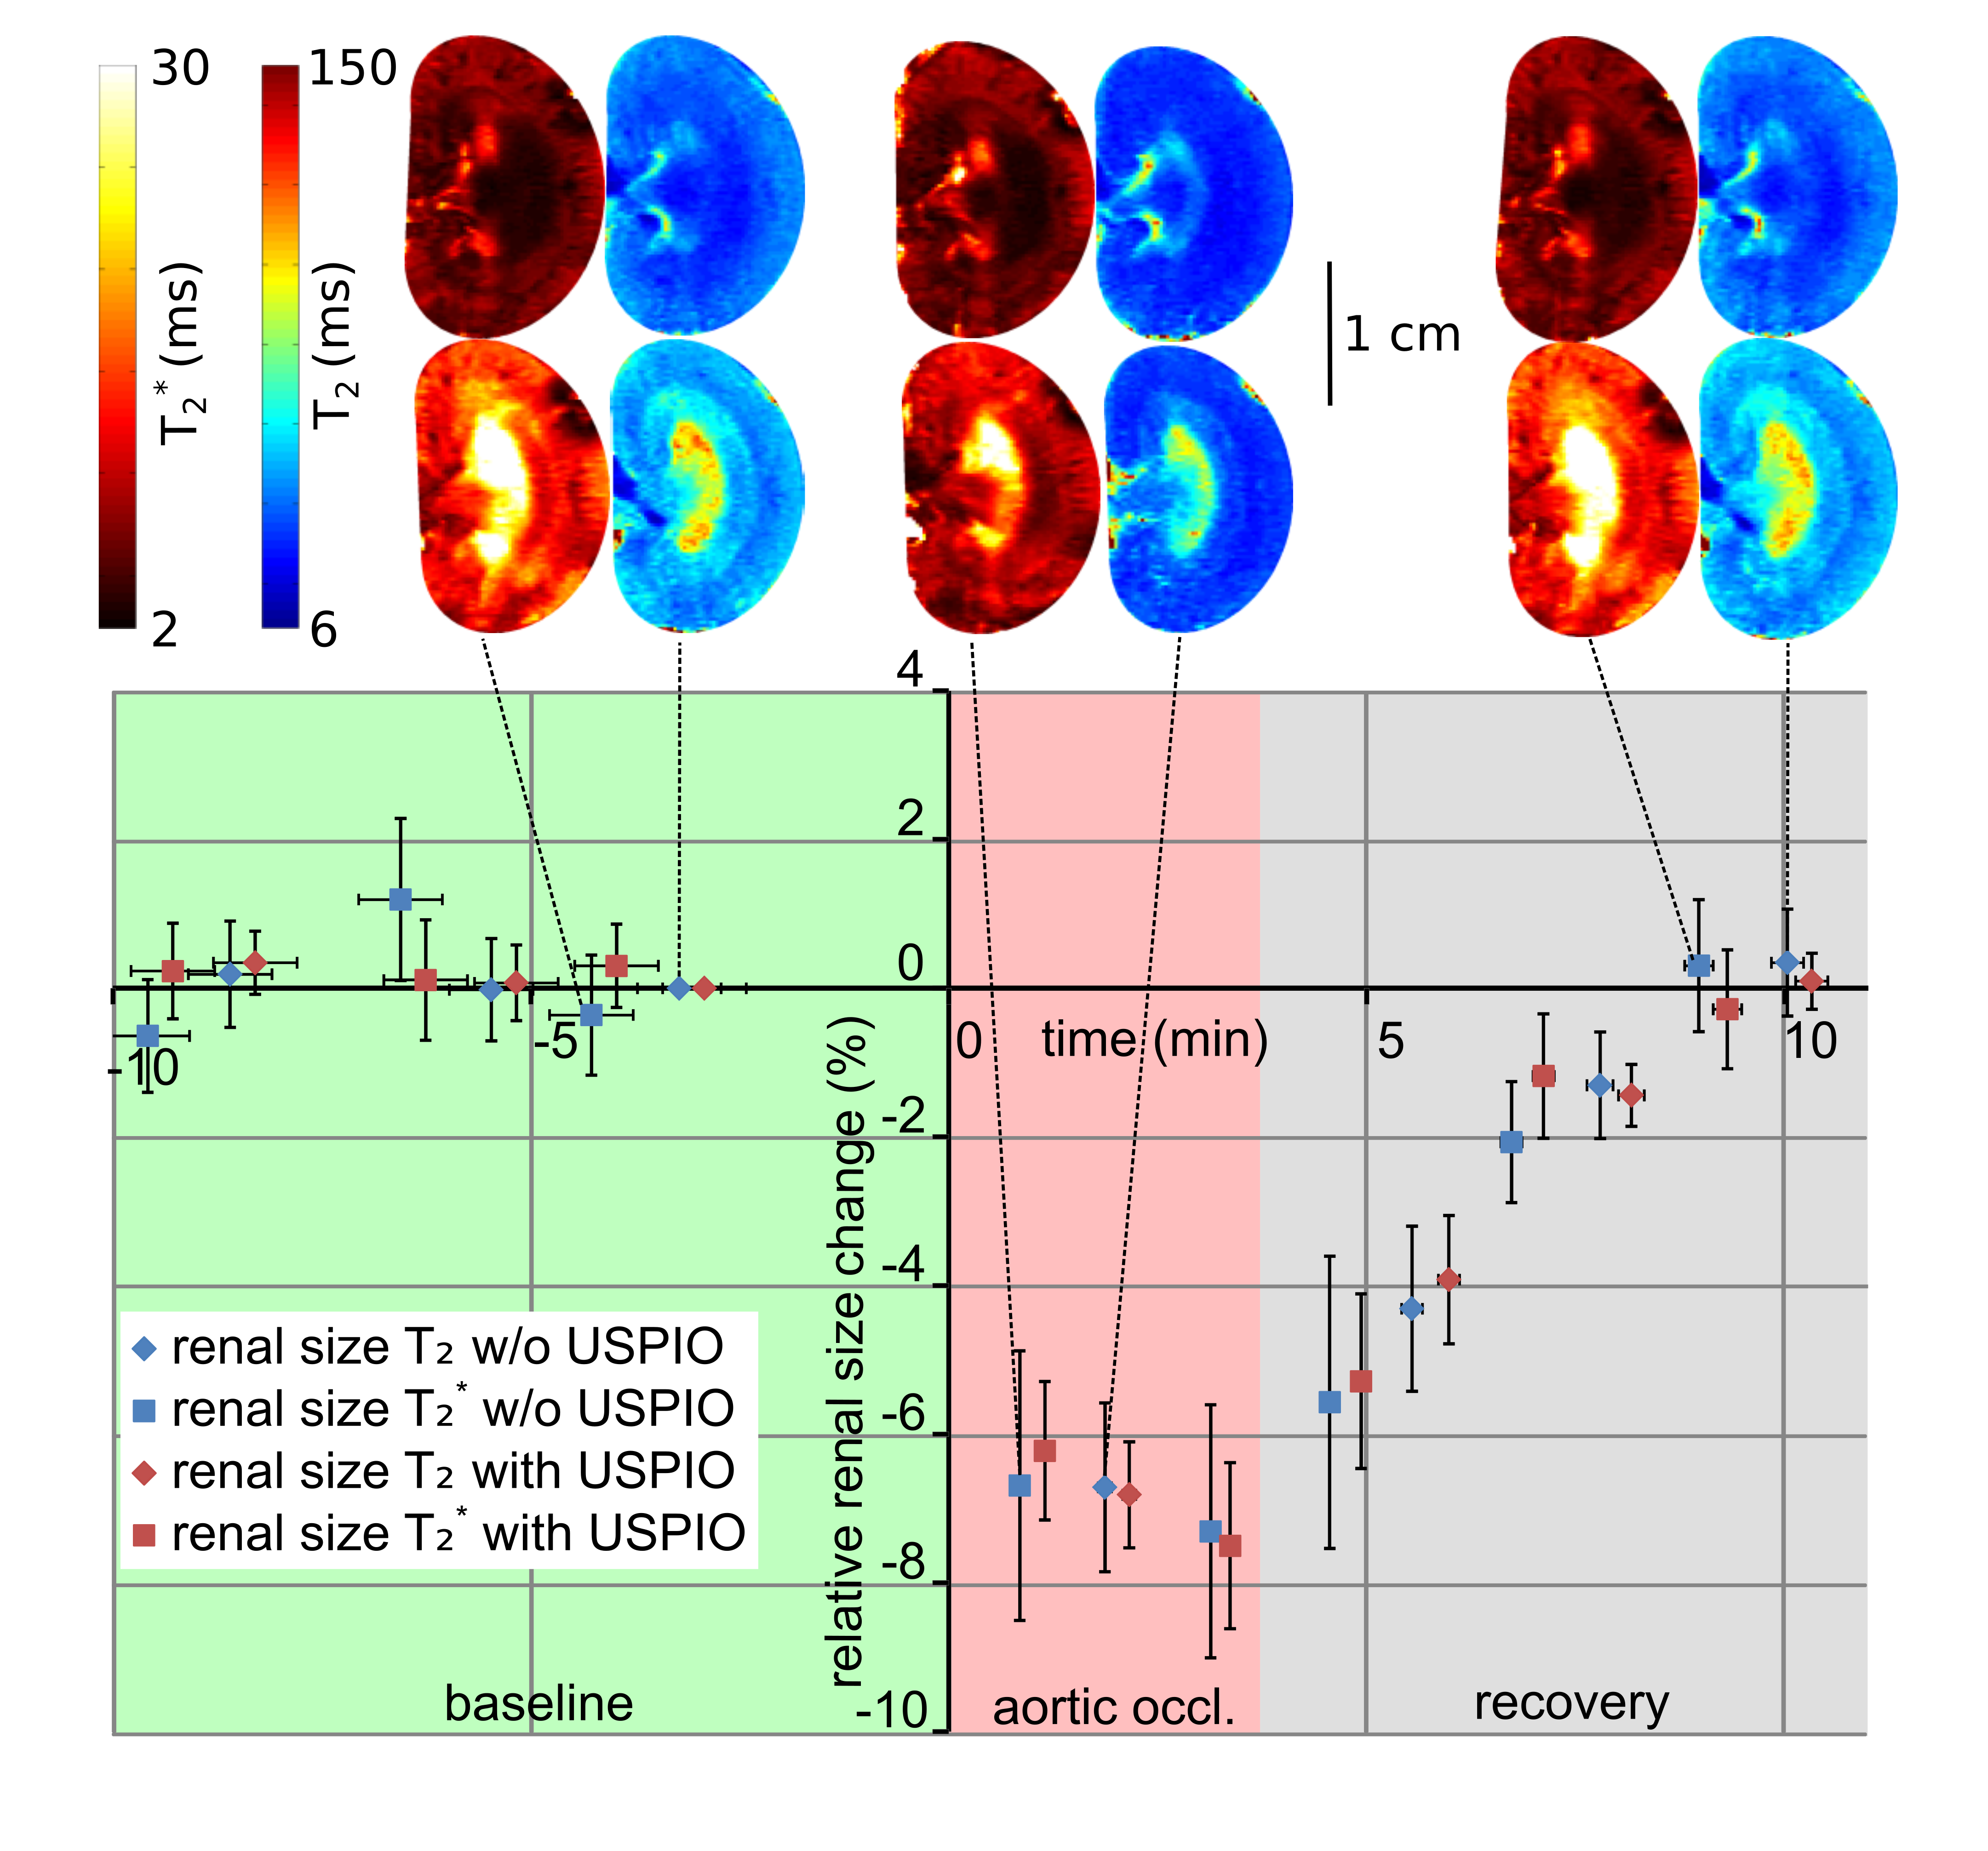
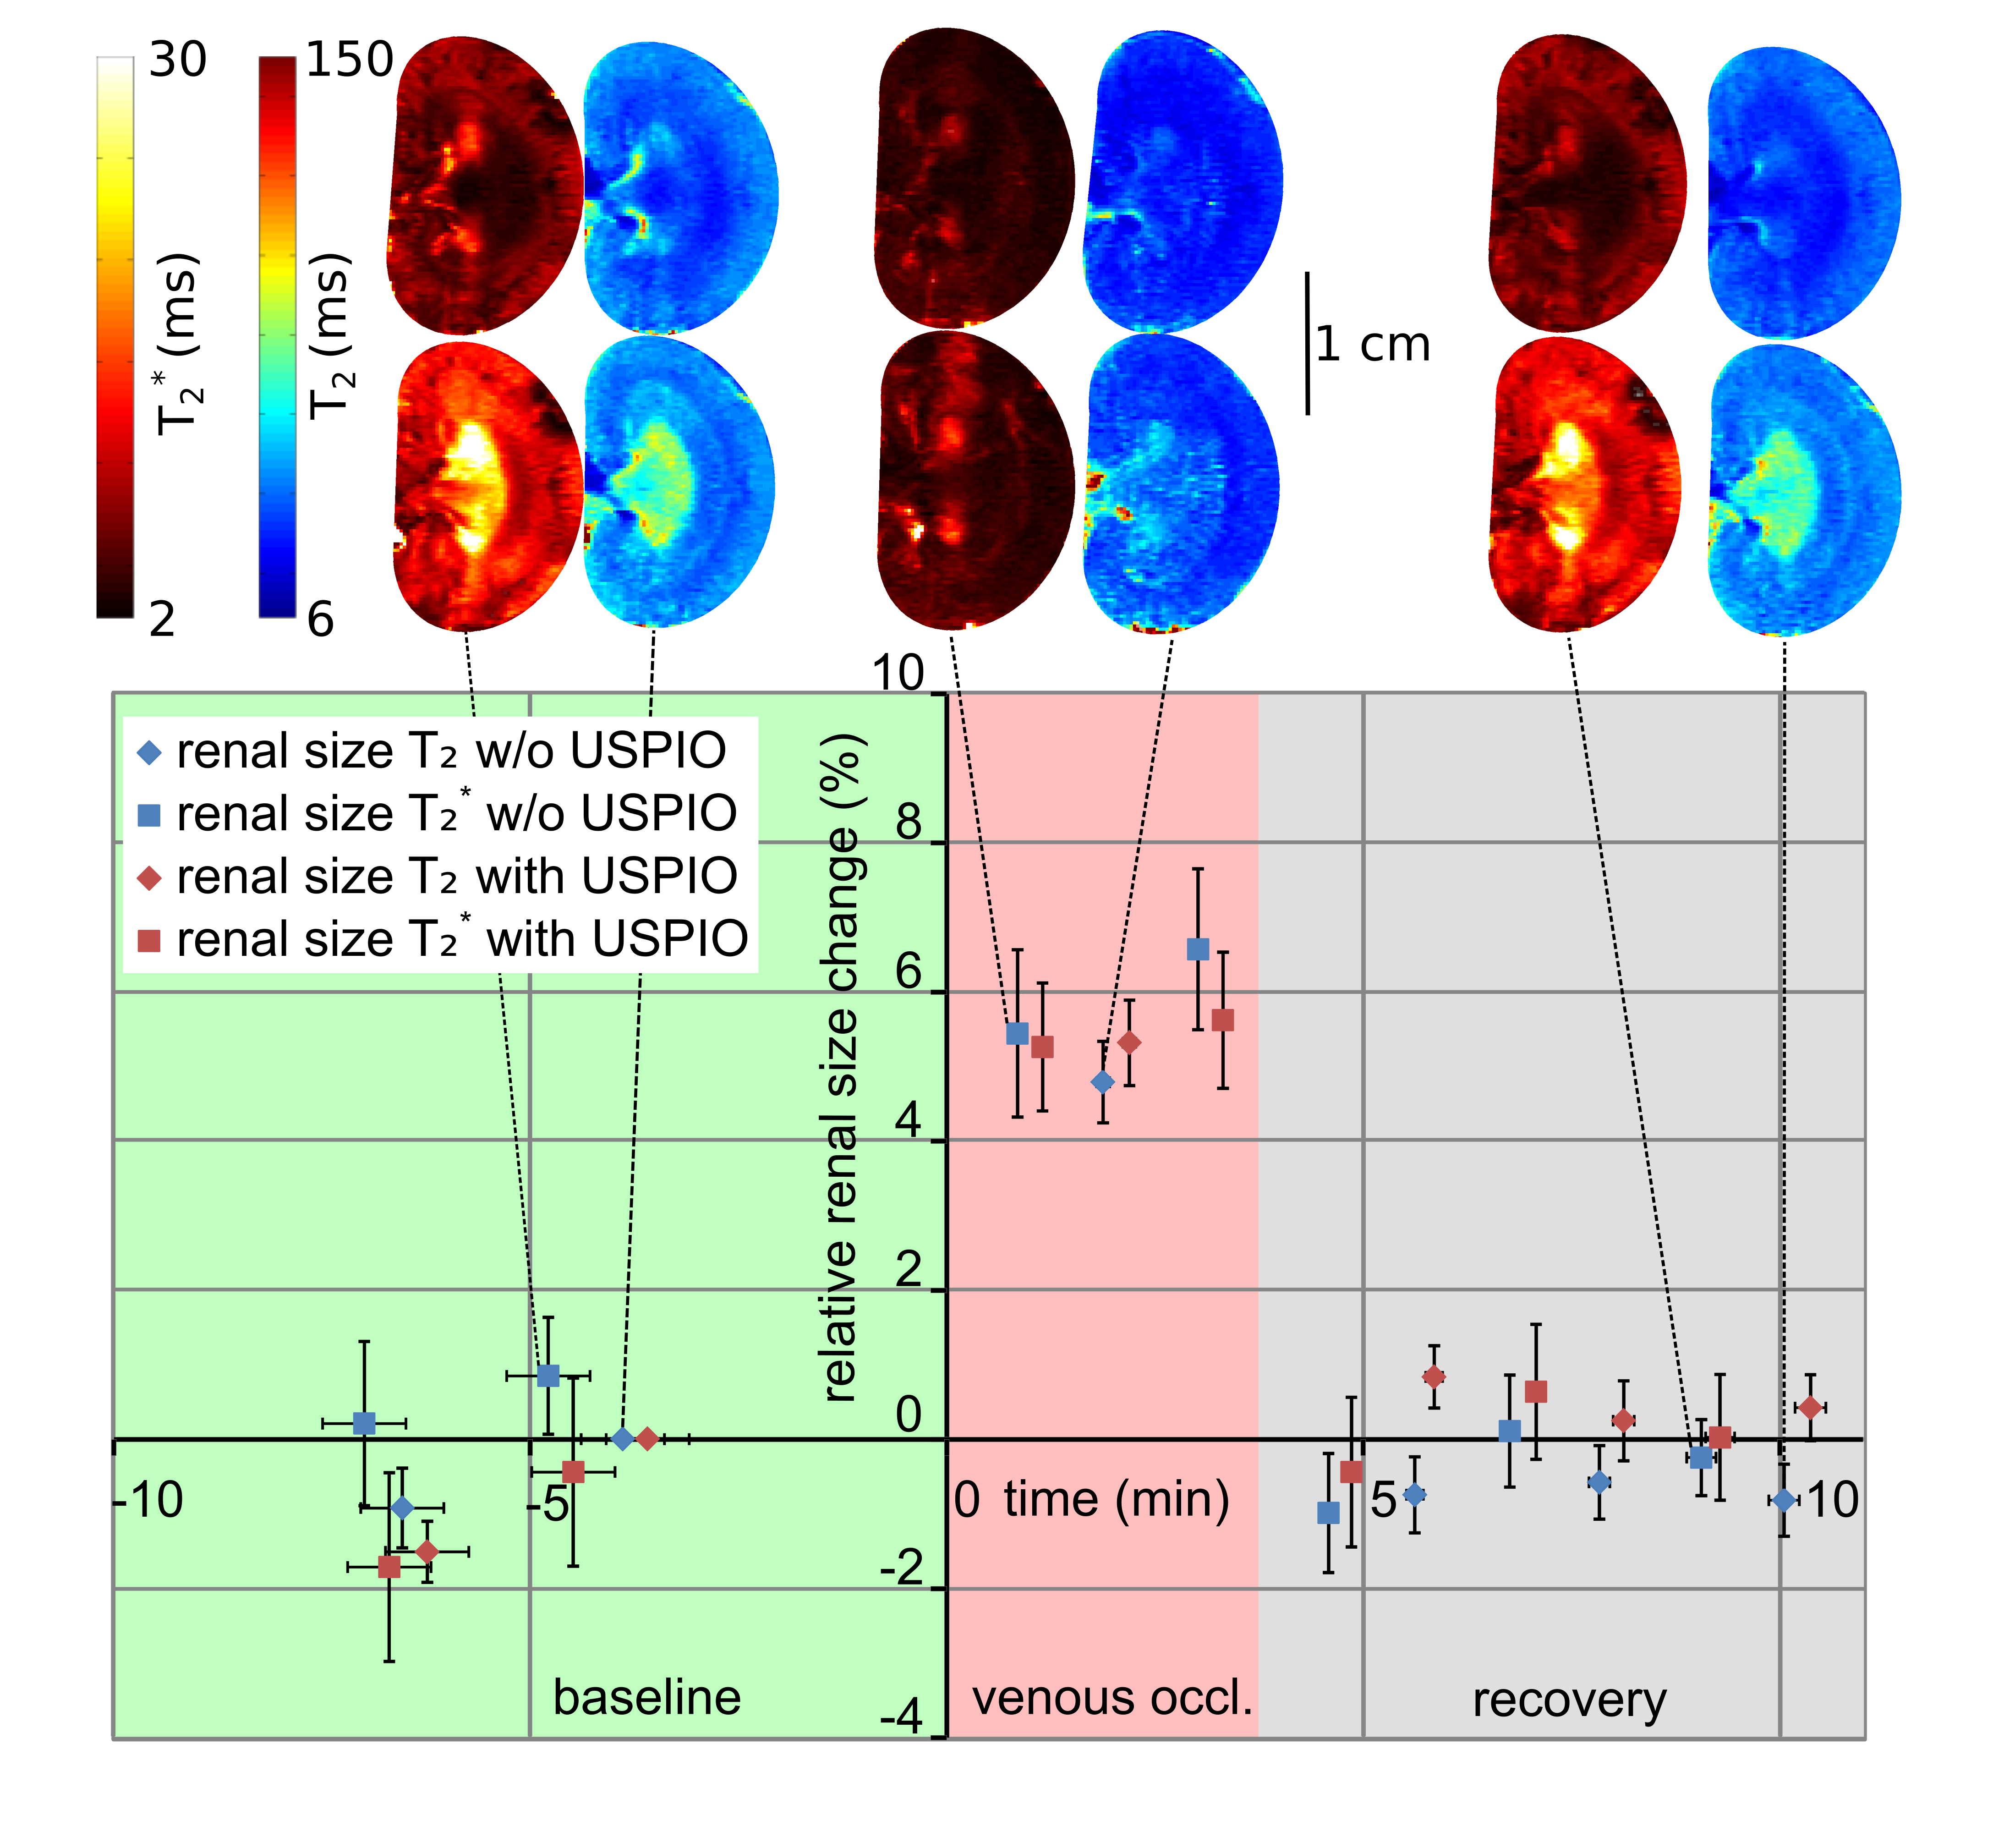
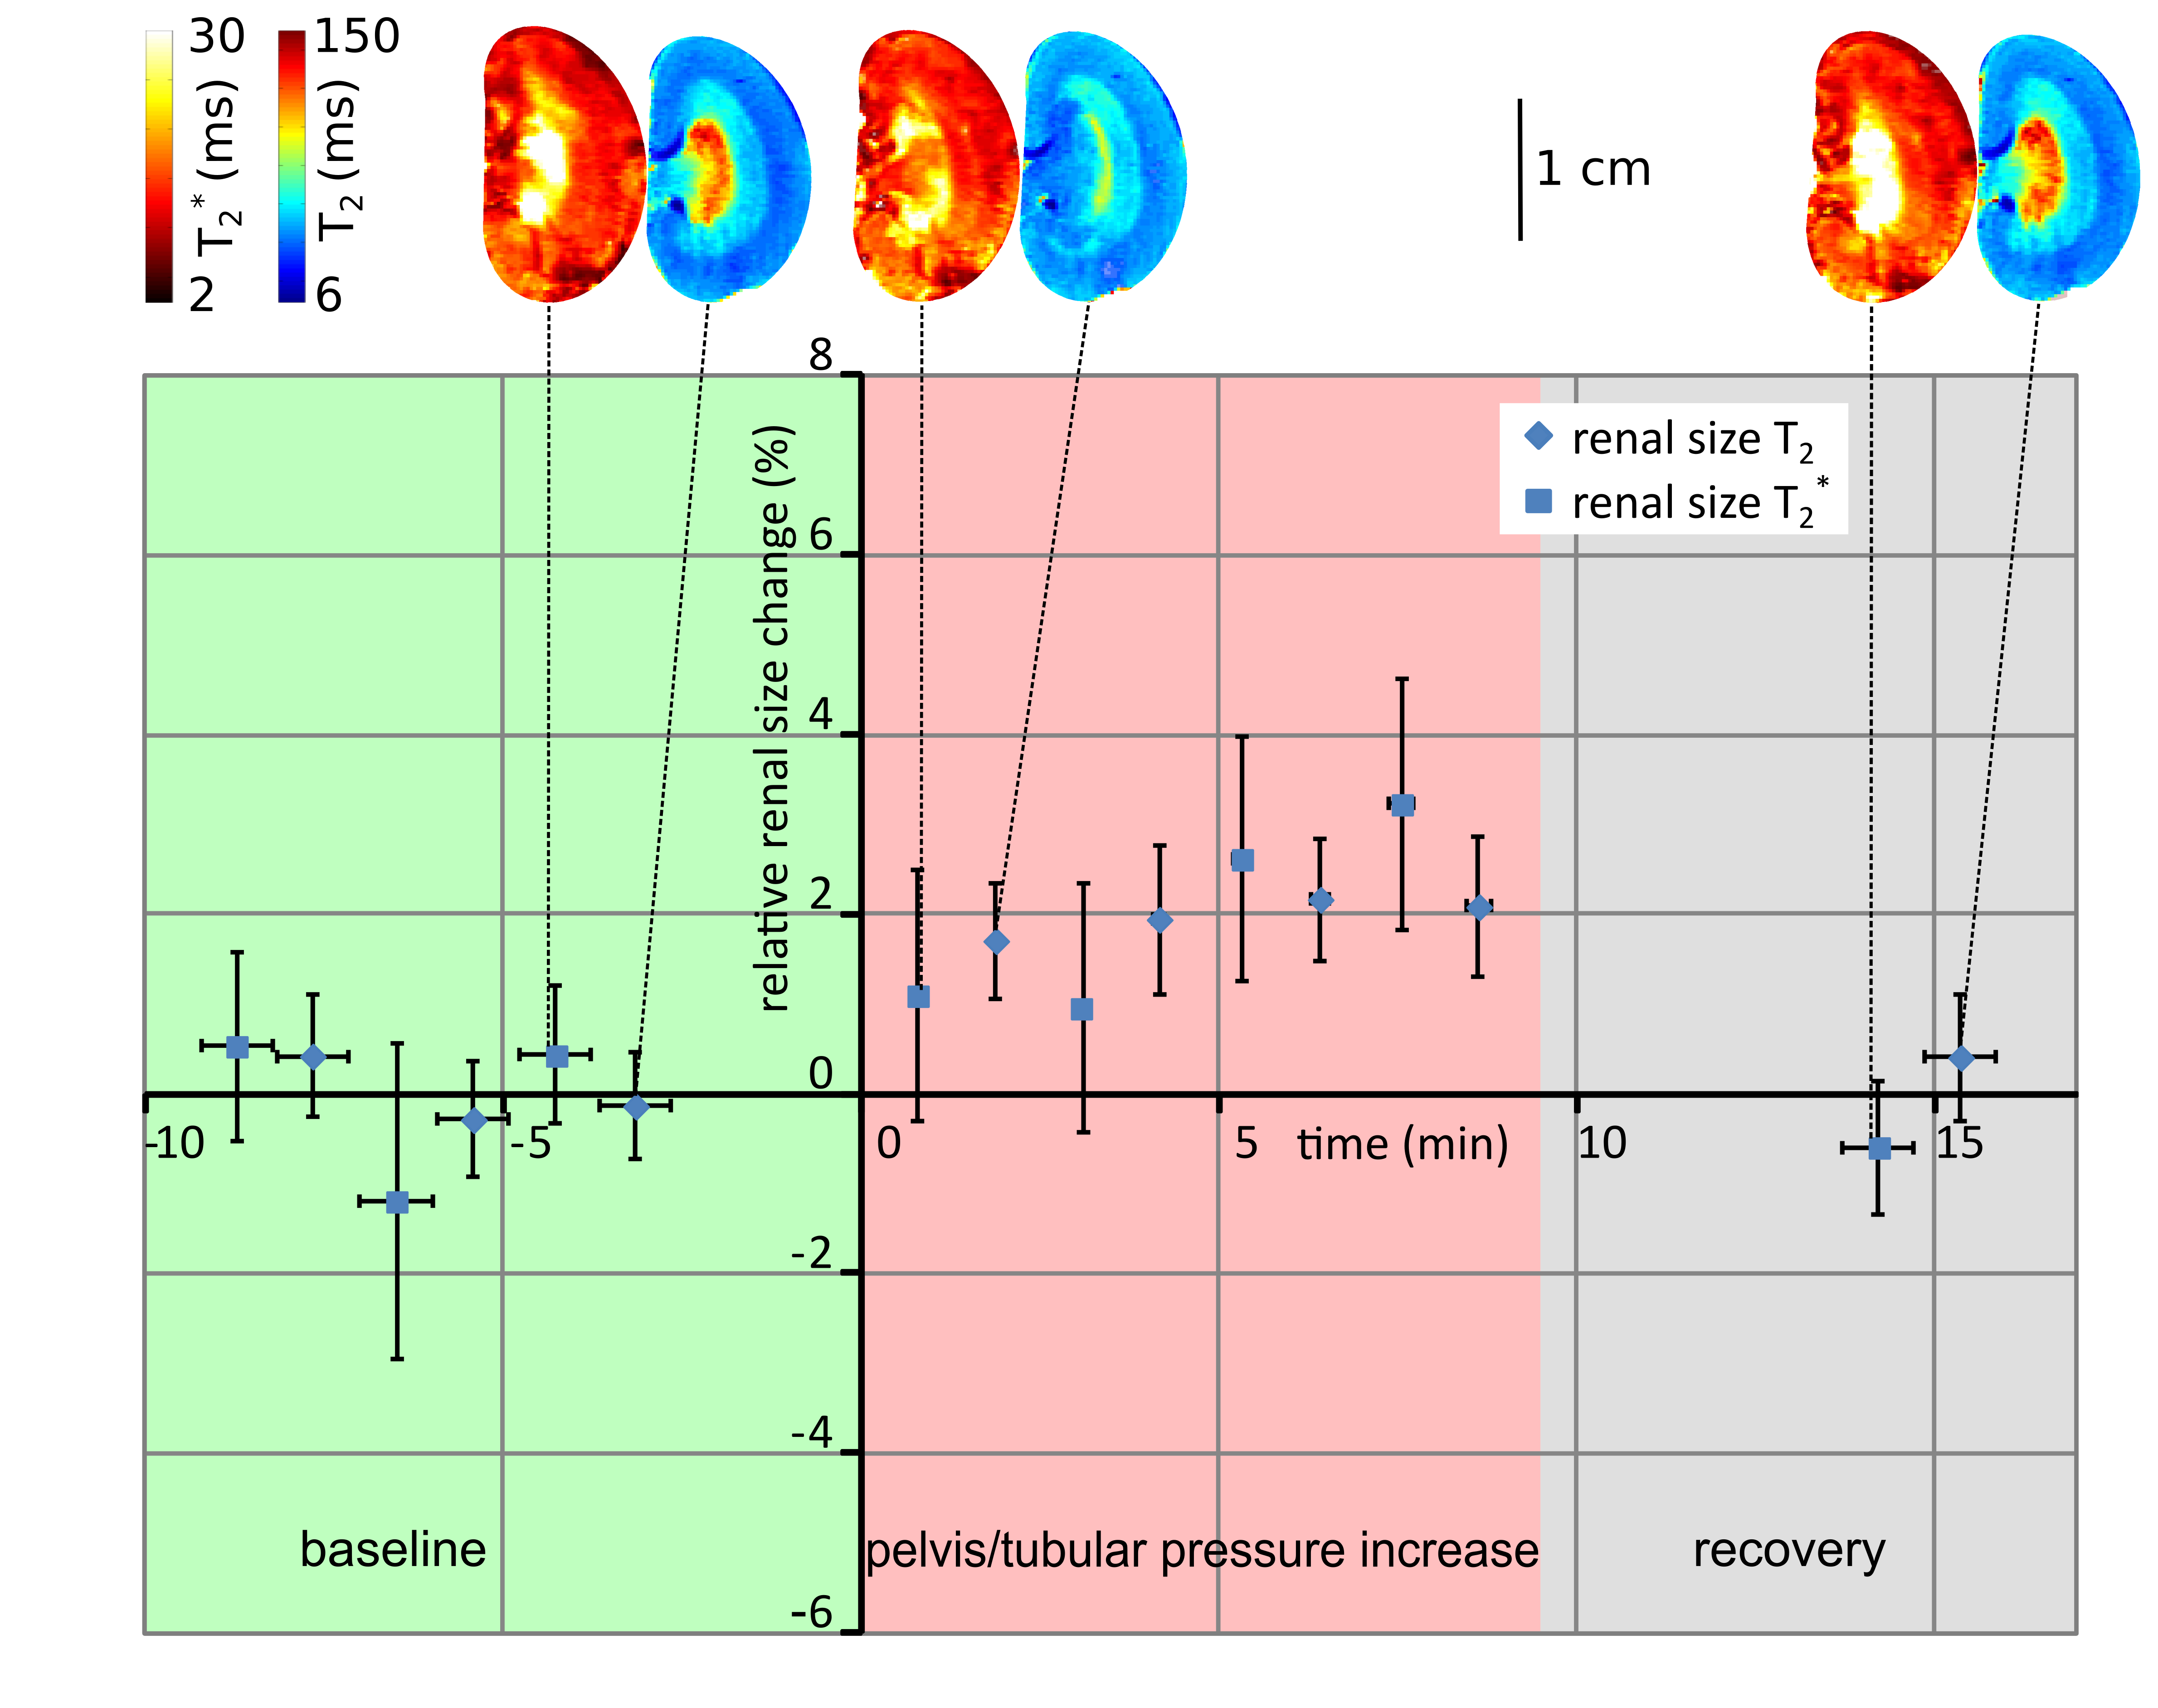
This approach was applied for renal size quantification in longitudinal experiments using (a) short‐term occlusions of the suprarenal aorta, (b) short‐term occlusion of the left renal vein (both lasting 3.8±0.3 min) and (c) increase in renal pelvis and intratubular pressure (30 mm Hg, 9.2±0.4 min) to induce pathophysiologically relevant changes in kidney size. Furthermore a bolus i.v. injection of the ultrasmall superparamagnetic iron oxide (USPIO, Feraheme 2mg Fe/kg BM) was administered in order to detect a potential bias of the size determination resulting from significant contrast changes.
Results
The ABSM-based kidney segmentation achieved a quick (14s per image) and accurate (r²=0.97 compared to a consensus of manual segmention from five independent raters) renal size quantification. Upon occlusion of the suprarenal aorta there was a significant decrease in renal size (−7.2%, P < .0001, Dunnett’s post hoc test following ANOVA) sustained throughout the occlusion (Figure 1). After cessation of the occlusion the renal size recovered slowly to the baseline within approx. 5 minutes. Occlusion of the left renal vein induced an increase in renal size (+4.5%, P < .001, Figure 2) which recovered quickly within 1 minute after reperfusion. During the intervention that increased pressure in the renal pelvis and tubules, renal size was elevated slightly (+2%, P < .001) and recovered to baseline levels when normal pressure was restored (Figure 3). Substantial reduction in MR signal intensity and changes in image contrast in T2 or T2* due to administration of the USPIO preparation did not have a significant effect on renal size, obtained by either T2 or T2* maps (p=0.67, p=0.77, respectively, repeated measures ANOVA, Figure 4).Discussion
To demonstrate the value and relevance of MR‐based longitudinal renal size assessment for research into renal pathophysiology, experimental interventions mimicking realistic clinical scenarios were employed to induce alterations in kidney size in rats. Renal size monitoring revealed a reduction in kidney size during the short‐term occlusions of the suprarenal aorta. With the onset of this occlusion, inflow of blood into the kidney is abruptly stopped. At the same time, outflow via the renal vein continues, until pressures in intrarenal vessels and in the vena cava are equalized. This results in a reduction in intrarenal blood volume and manifests as an immediate drop in kidney size. Upon cessation of the occlusion the whole lower body downstream of the occluder has to be reperfused, leading to a temporary drop in blood pressure and a delayed recovery of renal size. For occlusion of the left renal vein, we detected a swelling of the kidney. With the onset of renal venous occlusion, outflow of blood is abruptly stopped. The inflow of blood via the renal artery does not cease until the arterial pressure‐induced distension of intrarenal vessels and the associated swelling of the kidney is counterbalanced by the resistance of the entire renal tissue including the relatively tough renal capsule. The increase in tubular pressure resulted in a minor increase in kidney size caused by the dilation of the tubular system, again counteracted by the blood pressure and the resistance of the renal tissue.Conclusion
Kidney size quantification using the automated bean-shaped model proved to yield accurate and reproducible results for images with various contrasts (T2 or T2* maps both with and without USPIO) comparable to manual segmentation in greatly reduced time. Our results demonstrate the feasibility of MRI‐based renal size assessment in longitudinal experiments in rats, and supports preclinical studies aimed at how changes in renal size are associated with renal pathology. This approach will enable systematic analysis of the relationships between renal size, hemodynamics and oxygenation probed with parametric MRI and physiological measurements, yielding new insight into the mechanisms of renal pathophysiology.Acknowledgements
This work was funded in part (TN, ES, SW, TG, KC) by the German Research Foundation (Gefördert durch die Deutsche Forschungsgemeinschaft (DFG), Projektnummer 394046635, SFB 1365, RENOPROTECTION. Funded by the Deutsche Forschungsgemeinschaft (DFG, German Research Foundation), Project number 394046635, SFB 1365, RENOPROTECTION). The authors wish to thank A. Pohlmann, K. Zhao and B. Flemming for outstanding support.References
1 Luyckx VA, Tonelli M, Stanifer JW. The global burden of kidney disease and the sustainable development goals. Bull World Health Organ. 2018;96(6):414- 422D.
2 Levin A, Tonelli M, Bonventre J, et al. Global kidney health 2017 and beyond: a roadmap for closing gaps in care, research, and policy. Lancet. 2017;390(10105):1888- 1917.
3 Luft FC. Biomarkers and predicting acute kidney injury. Acta Physiol. 2020;231:e13479.
4 Schrezenmeier EV, Barasch J, Budde K, Westhoff T, Schmidt-Ott KM. Biomarkers in acute kidney injury — pathophysiological basis and clinical performance. Acta Physiol. 2017 ;219(3):554- 572.
5 Selby NM, Blankestijn PJ, Boor P, et al. Magnetic resonance imaging biomarkers for chronic kidney disease: a position paper from the European Cooperation in Science and Technology Action PARENCHIMA. Nephrol Dial Transplant. 2018;33(suppl_2):ii4- ii14.
6 Grantham JJ, Torres VE. The importance of total kidney volume in evaluating progression of polycystic kidney disease. Nat Rev Nephrol. 2016;12(11):667- 677.
7 Buchanan CE, Mahmoud H, Cox EF, et al. Quantitative assessment of renal structural and functional changes in chronic kidney disease using multiparametric magnetic resonance imaging. Nephrol Dial Transplant. 2020;35(6):955- 964
Figures