1499
Application of Two Denoising Methods to the Diffusion-Weighted 129Xe MRI and Dynamic Ventilation 19F/129Xe MRI Data Obtained from Normal Rats1Physics and Astronomy, Western University, London, ON, Canada, 2New York University Grossman School of Medicine, New York, NY, United States, 3Lawson Health Research Institute, London, ON, Canada
Synopsis
In this study, we demonstrate the effectiveness of two de-noising methods on diffusion-weighted and dynamic lung imaging in healthy rats using 129Xe and 19F. While the results showed a insignificant difference for denoising method 1 (MP-PCA), de-noising method 2 (MP-PCA preceded by hard-thresholding over a nuclear norm in k-space) showed significant difference in the overall mean Lm and LmD values for ventilation and r (fractional ventilation estimate) for ventilation images.
Summary of Main Findings
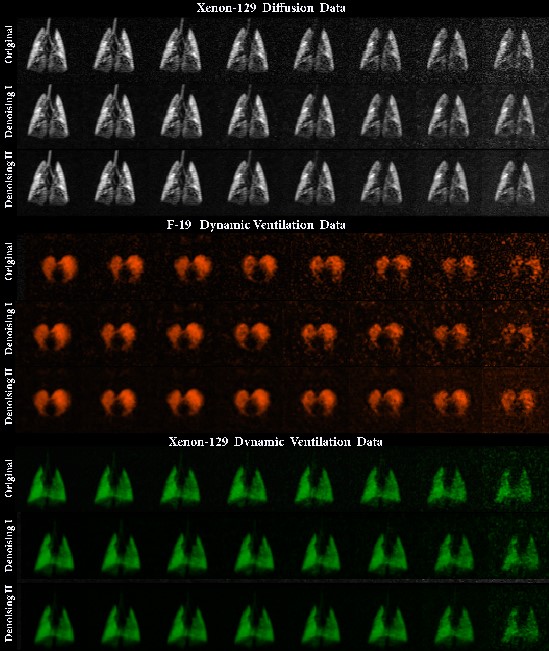
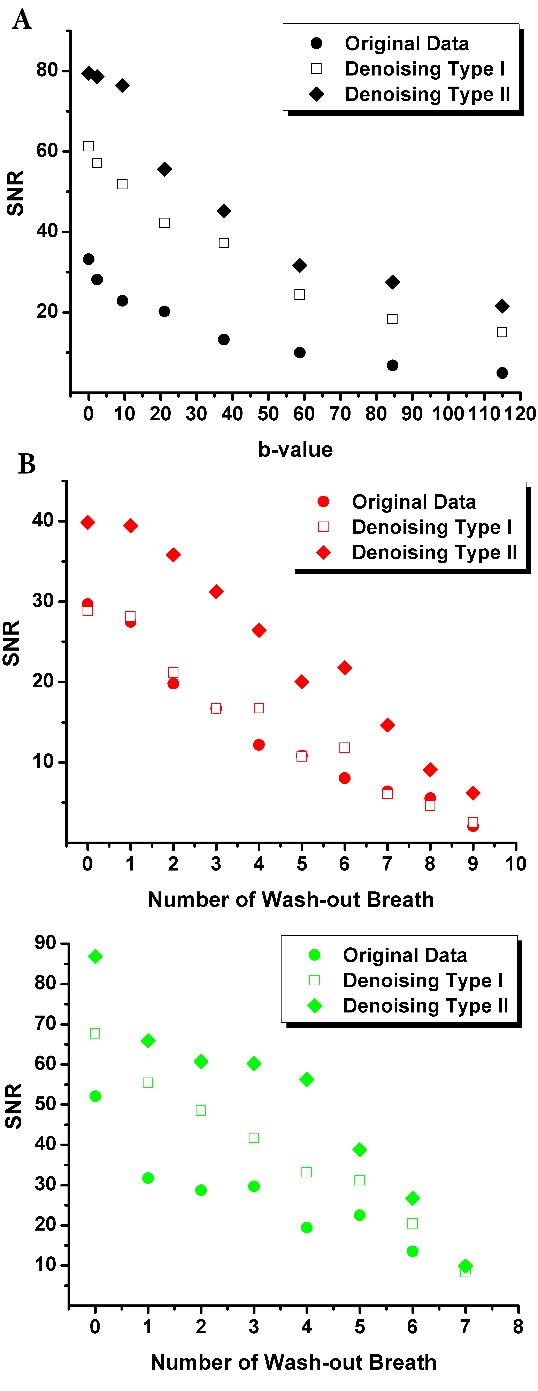
Introduction: Inhaled-gas (129Xe/19F) MRI has been proven to be useful for diffusion-weighted and dynamic-lung-imaging.1-3 Diffusion-weighted-pulmonary 129Xe MRI4,5 provides physiologically relevant biomarkers (specific diffusion length scale estimate (LmD) and mean-linear-intercept-estimate (Lm)) of obstructive lung-disease including emphysema, bronchopulmonary dysplasia, congenital lobar emphysema and alpha-1-antitrypsin-deficiency.6-8 MRI-based techniques permit the acquisition of regional-fractional-ventilation (r)9-11 which can be very useful as a radiation-free alternative to CT for detecting gas-trapping in lung-diseases such as lung, fibrosis and COPD.1 Thus, free-breathing 19F dynamic-lung-imaging has been recently demonstrated in human lungs 12. Clearly, each new wash-out breath of air replaced some volume of the 19F gas in lung, so the signal intensity of the resulting images was gradually attenuated. Similarly, the large b-values cause diffusion-decay, so the noisy (SNR<5) large b-value or low 129Xe/19F density images “accelerates” the decay that leads to over-estimation of the diffusion/ventilation decay-rate-constants. We hypothesize that denoising of the diffusion/ventilation data will permit extracting accurate diffusion/ventilation regional-biomarkers. In this proof-of-concept study, our objective was to demonstrate the feasibility of this method using the diffusion-weighted and dynamic-ventilation data in a small animal cohort.Methods: Four normal-animals (Sprague Dawley rats) were studied (ethics board approved protocol). 129Xe MR was performed at 3.0T (MR750, GEHC, WI) using a high-performance insert-gradient-coil (G=500mT/m, slew-rate=2000T/m/s)13 and a commercial, xenon-quadrature-rat-sized 129Xe RF coils14 (Morris Instruments, Canada). Pulse-sequence details and the breathing protocol were previously described.11 In all xenon measurements the diffusion-sensitization gradient pulse ramp up/down time was 500μs, constant time=2ms, Δ=5.0ms, providing eight b-values 0, 2.35, 9.39, 21.1, 37.6, 58.7, 84.5 and 115s/cm2. A single breath-hold, interleaved (eight interleaves) centric 2D FGRE diffusion-weighted sequence was acquired for a coronal slice (TE/TR=10.3ms/14.5ms, BW=8kHz, matrix size=64x64, and FOV=50x50mm2, variable flip angle, 10sec breath-hold).15 Hyperpolarized 129Xe (83%) gas was provided by turn-key, spin-exchange-polarizer systems (Polarean-9800, polarization range: 7-15%; Xemed XeBox-E1016, polarization range: 20-35%). 19F MRI ventilation measurements were performed using a 3.0T Philips Achieva scanner with maximum gradient strengths of 4G/cm and a home-built rat-sized quadrature transmit/receive coil tuned to the 19F resonance frequency of 120.15MHz. Pulse sequence details and the breathing protocol were previously described.17 Two denoising methods (Method-1: MP-PCA18 and Method-2: MP-PCA preceded by hard-thresholding over a nuclear norm in k-space, in order to suppress noise-correlations from the reconstruction) were applied to the 129Xe diffusion-attenuation-data (Fig.1, top-panel), 19F dynamic ventilation data (Fig.1, middle-panel), and 129Xe dynamic-ventilation data (Fig.1, bottom-panel) as previously described.18 The signal intensity of the original and denoised diffusion-data were represented as a functions of the b-value (Fig.2a) and then fitted following Abascal et al method.19 LmD and Lm were generated using the stretched-exponential-model20,21 as previously described.22 The signal intensity of the original and denoised ventilation data were represented as a function of the number of wash-out-breaths (Fig.2b and c) and then fitted following. 23 n=0, 1, 2, 3, 4, 5, 6, 8 was used to fit 129Xe/19F original and denoised data and generate the fractional-ventilation maps as previously described. 23 SNR was calculated as previously described.24
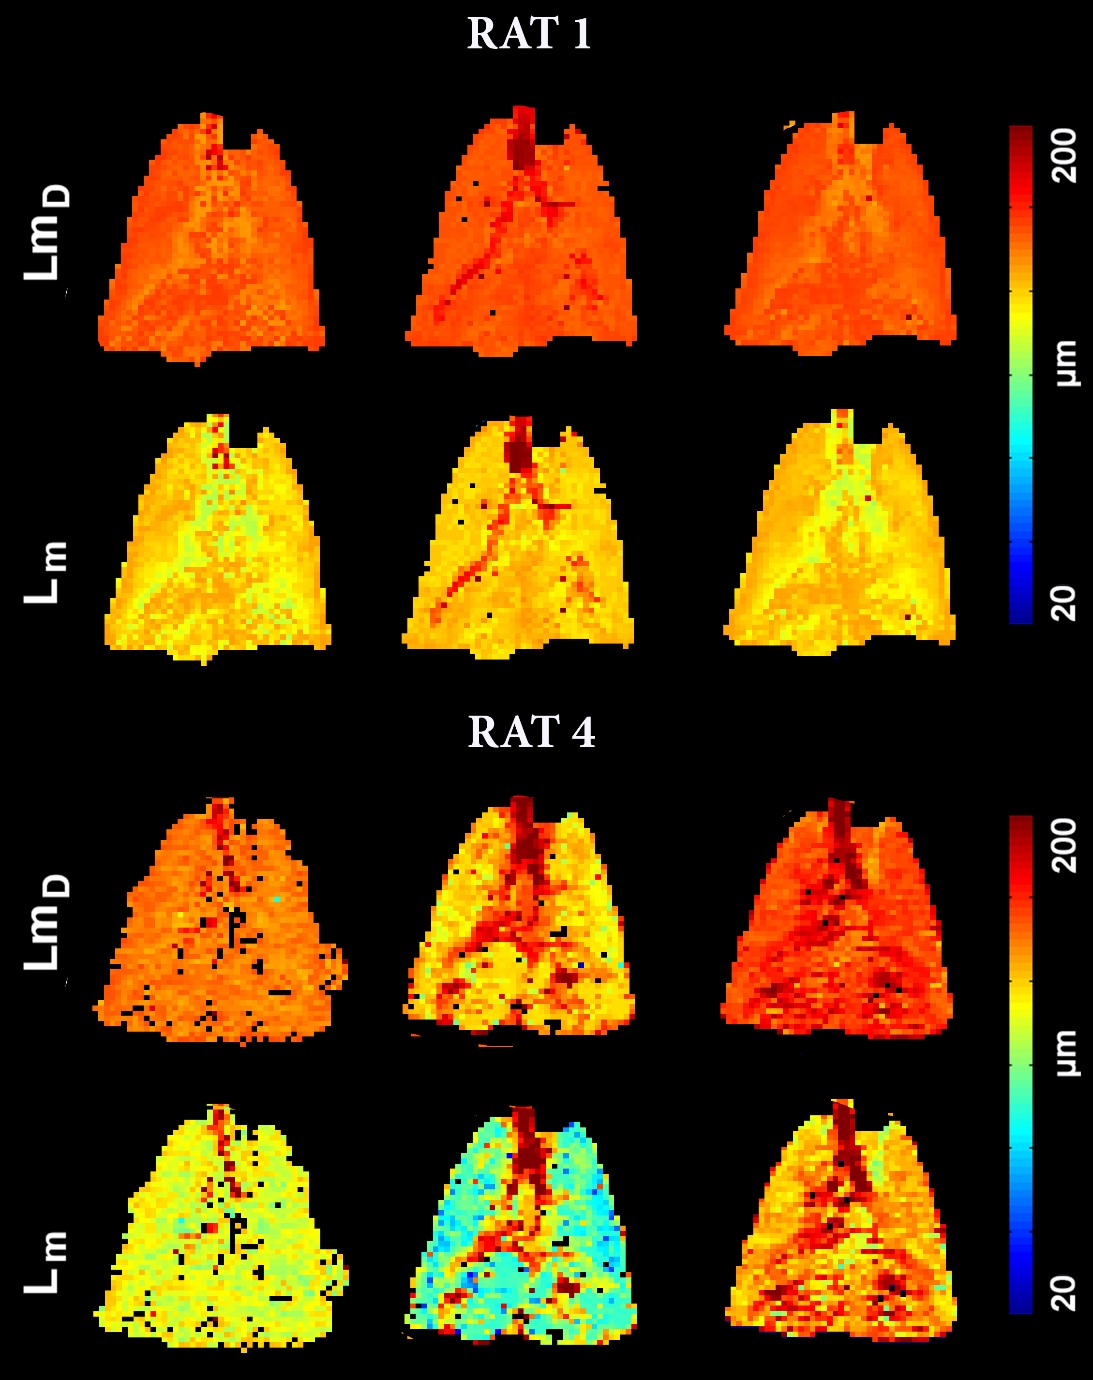
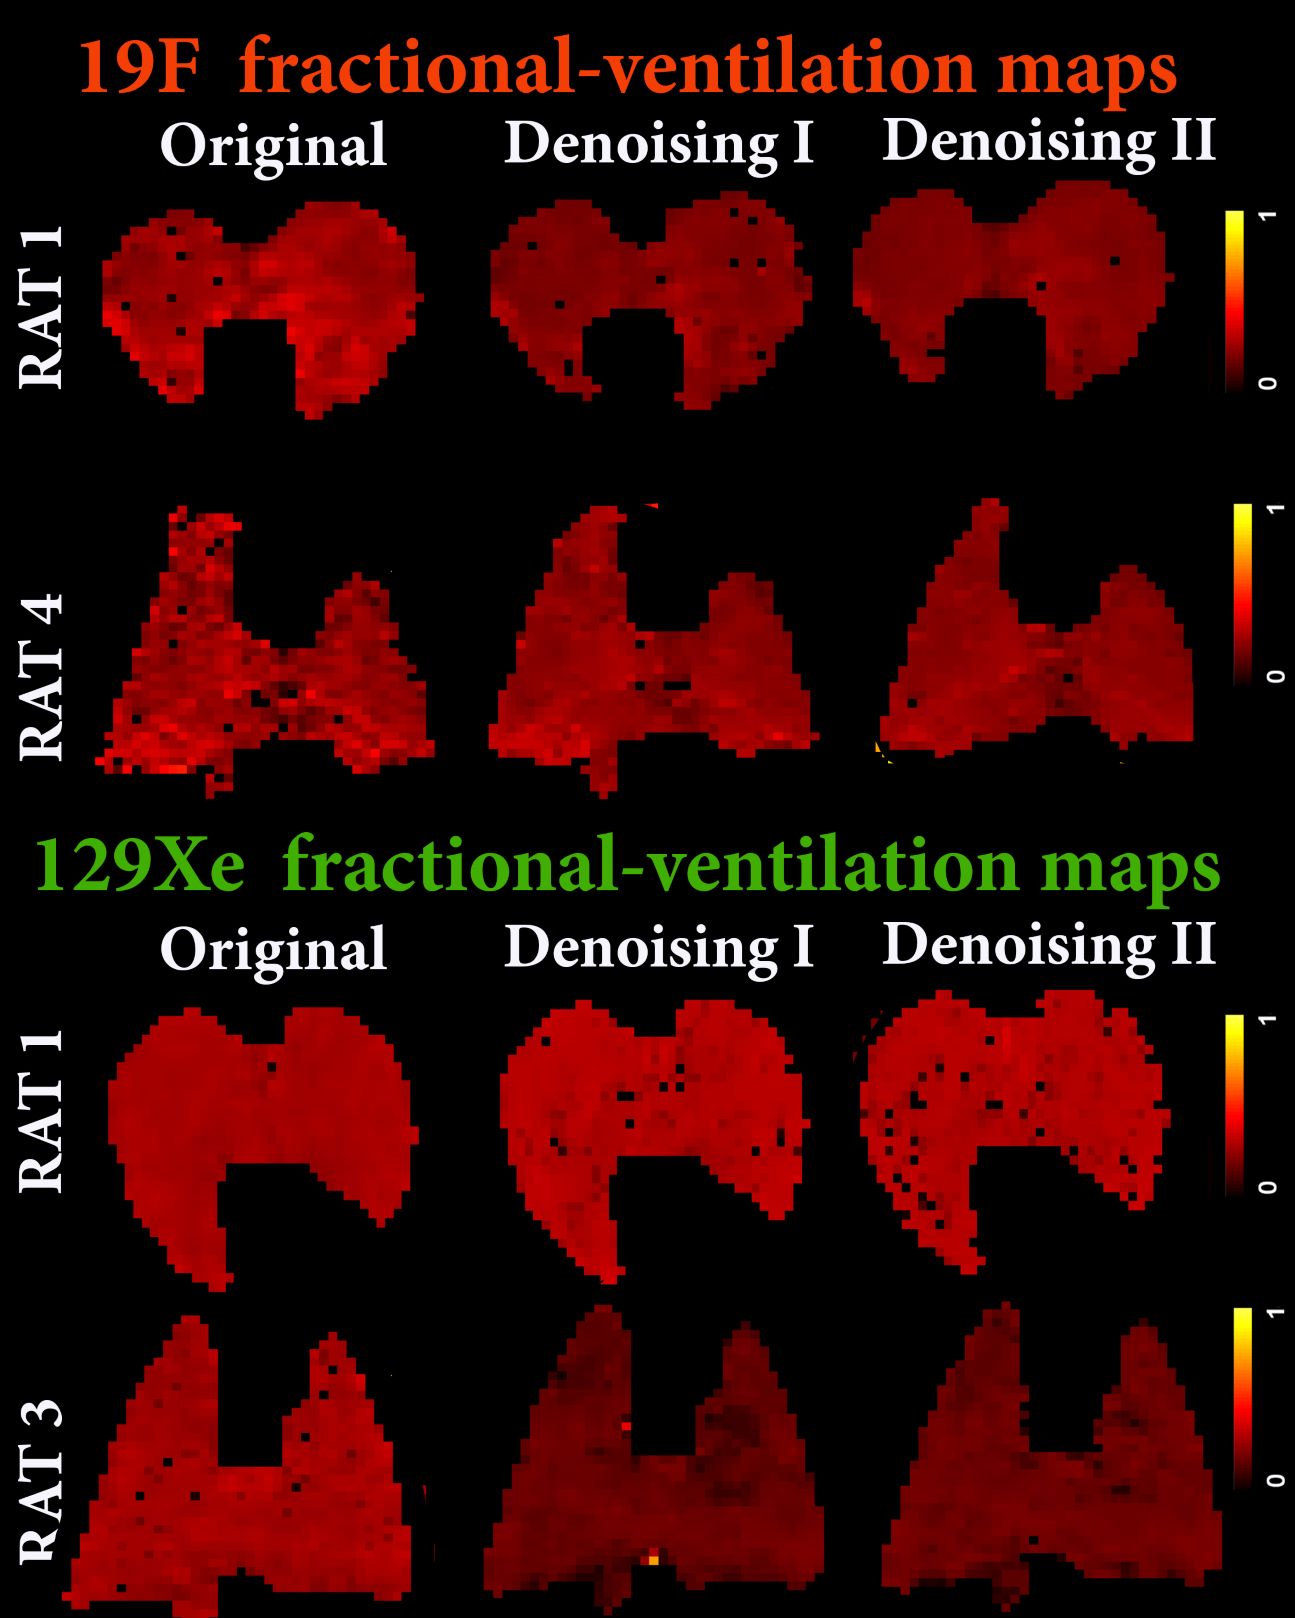
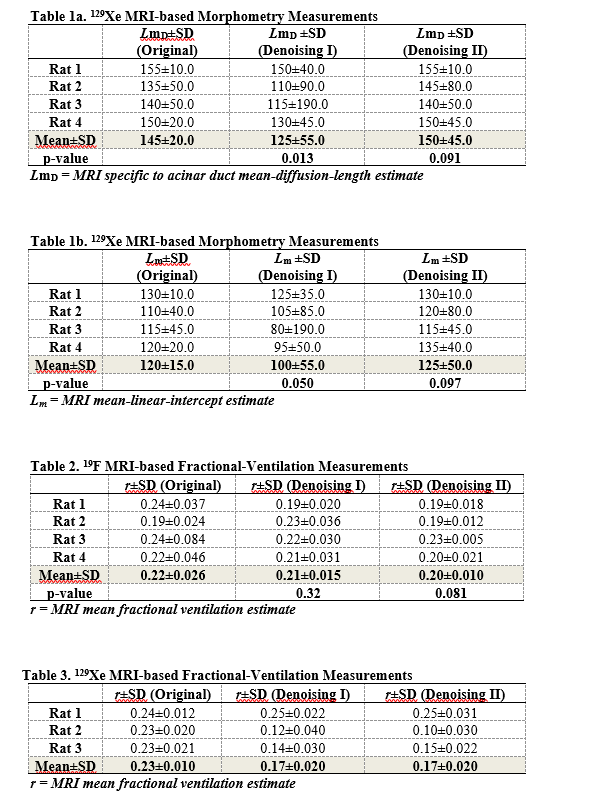
Results: Fig.2 shows the improved SNR of the denoised images over the original images for the diffusion/ventilation data. Tables 1a and b shows the Stretched Exponential Model based morphometry estimates for all rats and all type of data. Mean LmD and Lm estimates for original were significantly larger compared to corresponding mean LmD and Lm estimates obtained from denoising method I data (p<.03). The mean differences of 14.0%/(4.0%) and 17.0%/(7.0%,), were observed between original and denoising-1/(2) for the overall LmD and Lm values, respectively. Fig.3 shows representative LmD and Lm maps obtained from the original and denoised data. Table 2 shows the 19F MRI-based mean fractional-ventilation-estimates for all rats and all type of data. Original mean r estimates were significantly larger compared to corresponding mean r estimates for the denoising-2 data (p<.08) and not significantly different from corresponding mean r estimates for the denoising-1 data (p>.05). The mean differences of 5.0% and 10.0%, were observed between original and denoising-1 and 2 for the r values, respectively. Fig.4 (top-panel) shows representative r maps obtained from the original and denoised data. Table 3 shows the 129Xe MRI-based mean fractional-ventilation estimates for all rats and all type of data. The mean differences of 24.0% and 23.0%, were observed between original and denoising-1/2 for the r values, respectively. Fig.4 (bottom-panel) shows representative r maps obtained from the original and denoised data.
Discussion and Conclusion: In this proof-of-concept study, we showed that the denoising-1 method improves SNR of diffusion data (Fig.2a) and therefore LmD and Lm (Tables 1a and b) matched with the previously reported values. Denoising-2 led to significant over-estimation of LmD and Lm and cannot be recommended for improving the diffusion-weighted 129Xe MRI data. In turn, the 129Xe/19F dynamic-ventilation data denoised using the method-2 permitted to extract the reasonable mean r estimates (Tables 2 and 3), while the denoising method-1 did not change the mean r estimate compared the mean-fractional-ventilation-estimates extracted from the original data (Table 2, Fig.2b). For the first-time we have demonstrated that the 129Xe/19F MRI images can be denoised using two different methods and it does not lead to compromising the accuracy of the regional-biomarkers such as regional LmD and Lm and fractional-ventilation estimates.
Acknowledgements
We acknowledge the support of the Natural Sciences and Engineering Research Council of Canada, R5942A04References
1. Couch, M. J. et al. Fractional ventilation mapping using inert fluorinated gas MRI in rat models of inflammation and fibrosis. NMR Biomed 29, 545-552, doi:10.1002/nbm.3493 (2016).
2. Couch, M. J., Ouriadov, A. V. & Albert, M. S. in Hyperpolarized and Inert Gas MRI 279-292 (Academic Press, 2017).
3. Ouriadov, A. et al. Lung morphometry using hyperpolarized (129) Xe apparent diffusion coefficient anisotropy in chronic obstructive pulmonary disease. Magn Reson Med 70, 1699-1706, doi:10.1002/mrm.24595 (2013).
4. Mugler, J. P., 3rd & Altes, T. A. Hyperpolarized 129Xe MRI of the human lung. J Magn Reson Imaging 37, 313-331, doi:10.1002/jmri.23844 (2013).
5. Driehuys, B. et al. Chronic obstructive pulmonary disease: safety and tolerability of hyperpolarized 129Xe MR imaging in healthy volunteers and patients. Radiology 262, 279-289, doi:10.1148/radiol.11102172 (2012).
6. Kirby, M. et al. Hyperpolarized 3He and 129Xe MR imaging in healthy volunteers and patients with chronic obstructive pulmonary disease. Radiology 265, 600-610, doi:10.1148/radiol.12120485 (2012).
7. Kaushik, S. S. et al. Diffusion-weighted hyperpolarized 129Xe MRI in healthy volunteers and subjects with chronic obstructive pulmonary disease. Magn Reson Med 65, 1154-1165, doi:10.1002/mrm.22697 (2011).
8. Kirby, M. et al. Hyperpolarized 3He and 129Xe magnetic resonance imaging apparent diffusion coefficients: physiological relevance in older never- and ex-smokers. Physiol Rep 2, doi:10.14814/phy2.12068 (2014).
9. Deninger, A. J. et al. Quantitative measurement of regional lung ventilation using 3He MRI. Magnetic Resonance in Medicine 48, 223-232, doi:doi:10.1002/mrm.10206 (2002).
10. Santyr, G. E., Lam, W. W. & Ouriadov, A. Rapid and efficient mapping of regional ventilation in the rat lung using hyperpolarized 3He with Flip Angle Variation for Offset of RF and Relaxation (FAVOR). Magn Reson Med 59, 1304-1310, doi:10.1002/mrm.21582 (2008).
11. Couch, M. J., Ouriadov, A. & Santyr, G. E. Regional ventilation mapping of the rat lung using hyperpolarized (129)Xe magnetic resonance imaging. Magn Reson Med 68, 1623-1631, doi:10.1002/mrm.24152 (2012).
12. Gutberlet, M. et al. Free-breathing Dynamic (19)F Gas MR Imaging for Mapping of Regional Lung Ventilation in Patients with COPD. Radiology 286, 1040-1051, doi:10.1148/radiol.2017170591 (2018).
13. Foster-Gareau, P., Heyn, C., Alejski, A. & Rutt, B. K. Imaging single mammalian cells with a 1.5 T clinical MRI scanner. Magn Reson Med 49, 968-971, doi:10.1002/mrm.10417 (2003).
14. Kaushik, S. S. et al. Single-breath clinical imaging of hyperpolarized 129Xe in the airspaces, barrier, and red blood cells using an interleaved 3D radial 1-point Dixon acquisition. Magn Reson Med 75, 1434-1443, doi:10.1002/mrm.25675 (2016).
15. Ouriadov, A. et al. Early stage radiation-induced lung injury detected using hyperpolarized (129) Xe Morphometry: Proof-of-concept demonstration in a rat model. Magn Reson Med 75, 2421-2431, doi:10.1002/mrm.25825 (2016).
16. Hersman, F. W. et al. Large production system for hyperpolarized 129Xe for human lung imaging studies. Acad Radiol 15, 683-692, doi:10.1016/j.acra.2007.09.020 (2008).
17. Ouriadov, A. V. et al. In vivo regional ventilation mapping using fluorinated gas MRI with an x-centric FGRE method. Magn Reson Med 74, 550-557, doi:10.1002/mrm.25406 (2015).
18. Veraart, J. et al. Denoising of diffusion MRI using random matrix theory. Neuroimage 142, 394-406, doi:10.1016/j.neuroimage.2016.08.016 (2016).
19. Abascal, J., Desco, M. & Parra-Robles, J. Incorporation of Prior Knowledge of Signal Behavior Into the Reconstruction to Accelerate the Acquisition of Diffusion MRI Data. IEEE Trans Med Imaging 37, 547-556, doi:10.1109/TMI.2017.2765281 (2018).
20. Parra-Robles, J., Marshall, H. & Wild, J. M. Characterization of 3He Diffusion in Lungs using a Stretched Exponential Model [abstract]. ISMRM 21st Annual Meeting, 0820 (2013).
21. Chan, H. F., Stewart, N. J., Norquay, G., Collier, G. J. & Wild, J. M. 3D diffusion-weighted (129) Xe MRI for whole lung morphometry. Magn Reson Med 79, 2986-2995, doi:10.1002/mrm.26960 (2018).
22. Ouriadov, A. V. et al. Application of a stretched-exponential model for morphometric analysis of accelerated diffusion-weighted 129Xe MRI of the rat lung. MAGMA 34, 73-84, doi:10.1007/s10334-020-00860-6 (2021).
23. M S. Fox, E Woodward, M Couch, T Li, I Ball A Ouriadov. (2020). Feasibility of Dynamic Inhaled Gas MRI-based Measurements using Acceleration Factors of 10 and 14. International Society for Magnetic Resonance in Medicine Annual Scientific Meeting 2020, Sydney, Australia, United States Conference Date: 2020/4
24. Dominguez-Viqueira, W., Ouriadov, A., O'Halloran, R., Fain, S. B. & Santyr, G. E. Signal-to-noise ratio for hyperpolarized (3)He MR imaging of human lungs: a 1.5 T and 3 T comparison. Magn Reson Med 66, 1400-1404, doi:10.1002/mrm.22920 (2011).
Figures