1498
GLCM texture analysis of knee cartilage T2 maps: machine learning based selection of important features1High Field MR Centre, Department of Biomedical Imaging and Image-Guided Therapy, Medical University of Vienna, Vienna, Austria, 2Department of Cybernetics and Biomedical Engineering, VSB–Technical University of Ostrava, Ostrava, Czech Republic, 3CD laboratory for Clinical Molecular MR imaging (MOLIMA), Vienna, Austria, 4Institute for Clinical Molecular MRI in the Musculoskeletal System, Karl Landsteiner Society, Vienna, Austria
Synopsis
Texture analysis of quantitative T2 maps in combination with machine learning was explored as a tool for classification and prediction of various conditions in musculoskeletal (MSK) research. We explored random forest classification algorithm as a tool for identification of important texture features for the classification of MACT grafts and native cartilage twelve months after surgery. Our model performed with high accuracy (84.6%) and identified features with highest importance were: cluster prominence, sum average, autocorrelation and correlation.
Introduction
In recent years, gray-level co-occurrence matrix (GLCM) texture analysis is being used as add-on evaluation of collagen specific T2 mapping in knee cartilage. Many public libraries and packages for Python and MATLAB provide calculation of up to 20 GLCM features 1,2, but as these features are highly correlated, identification of most important features is a crucial step in data analysis and modeling. This can be done either manually based on statistical analysis or automatically using an machine learning algorithm 3. Objective of our study was to determine importance of GLCM features in random forests classification algorithm when distinguishing knee cartilage lesions treated with MACT (NOVOCART 3D plus, TETEC AG, Reutlingen, Germany) and healthy reference regions at twelve months after surgery.Materials and Methods
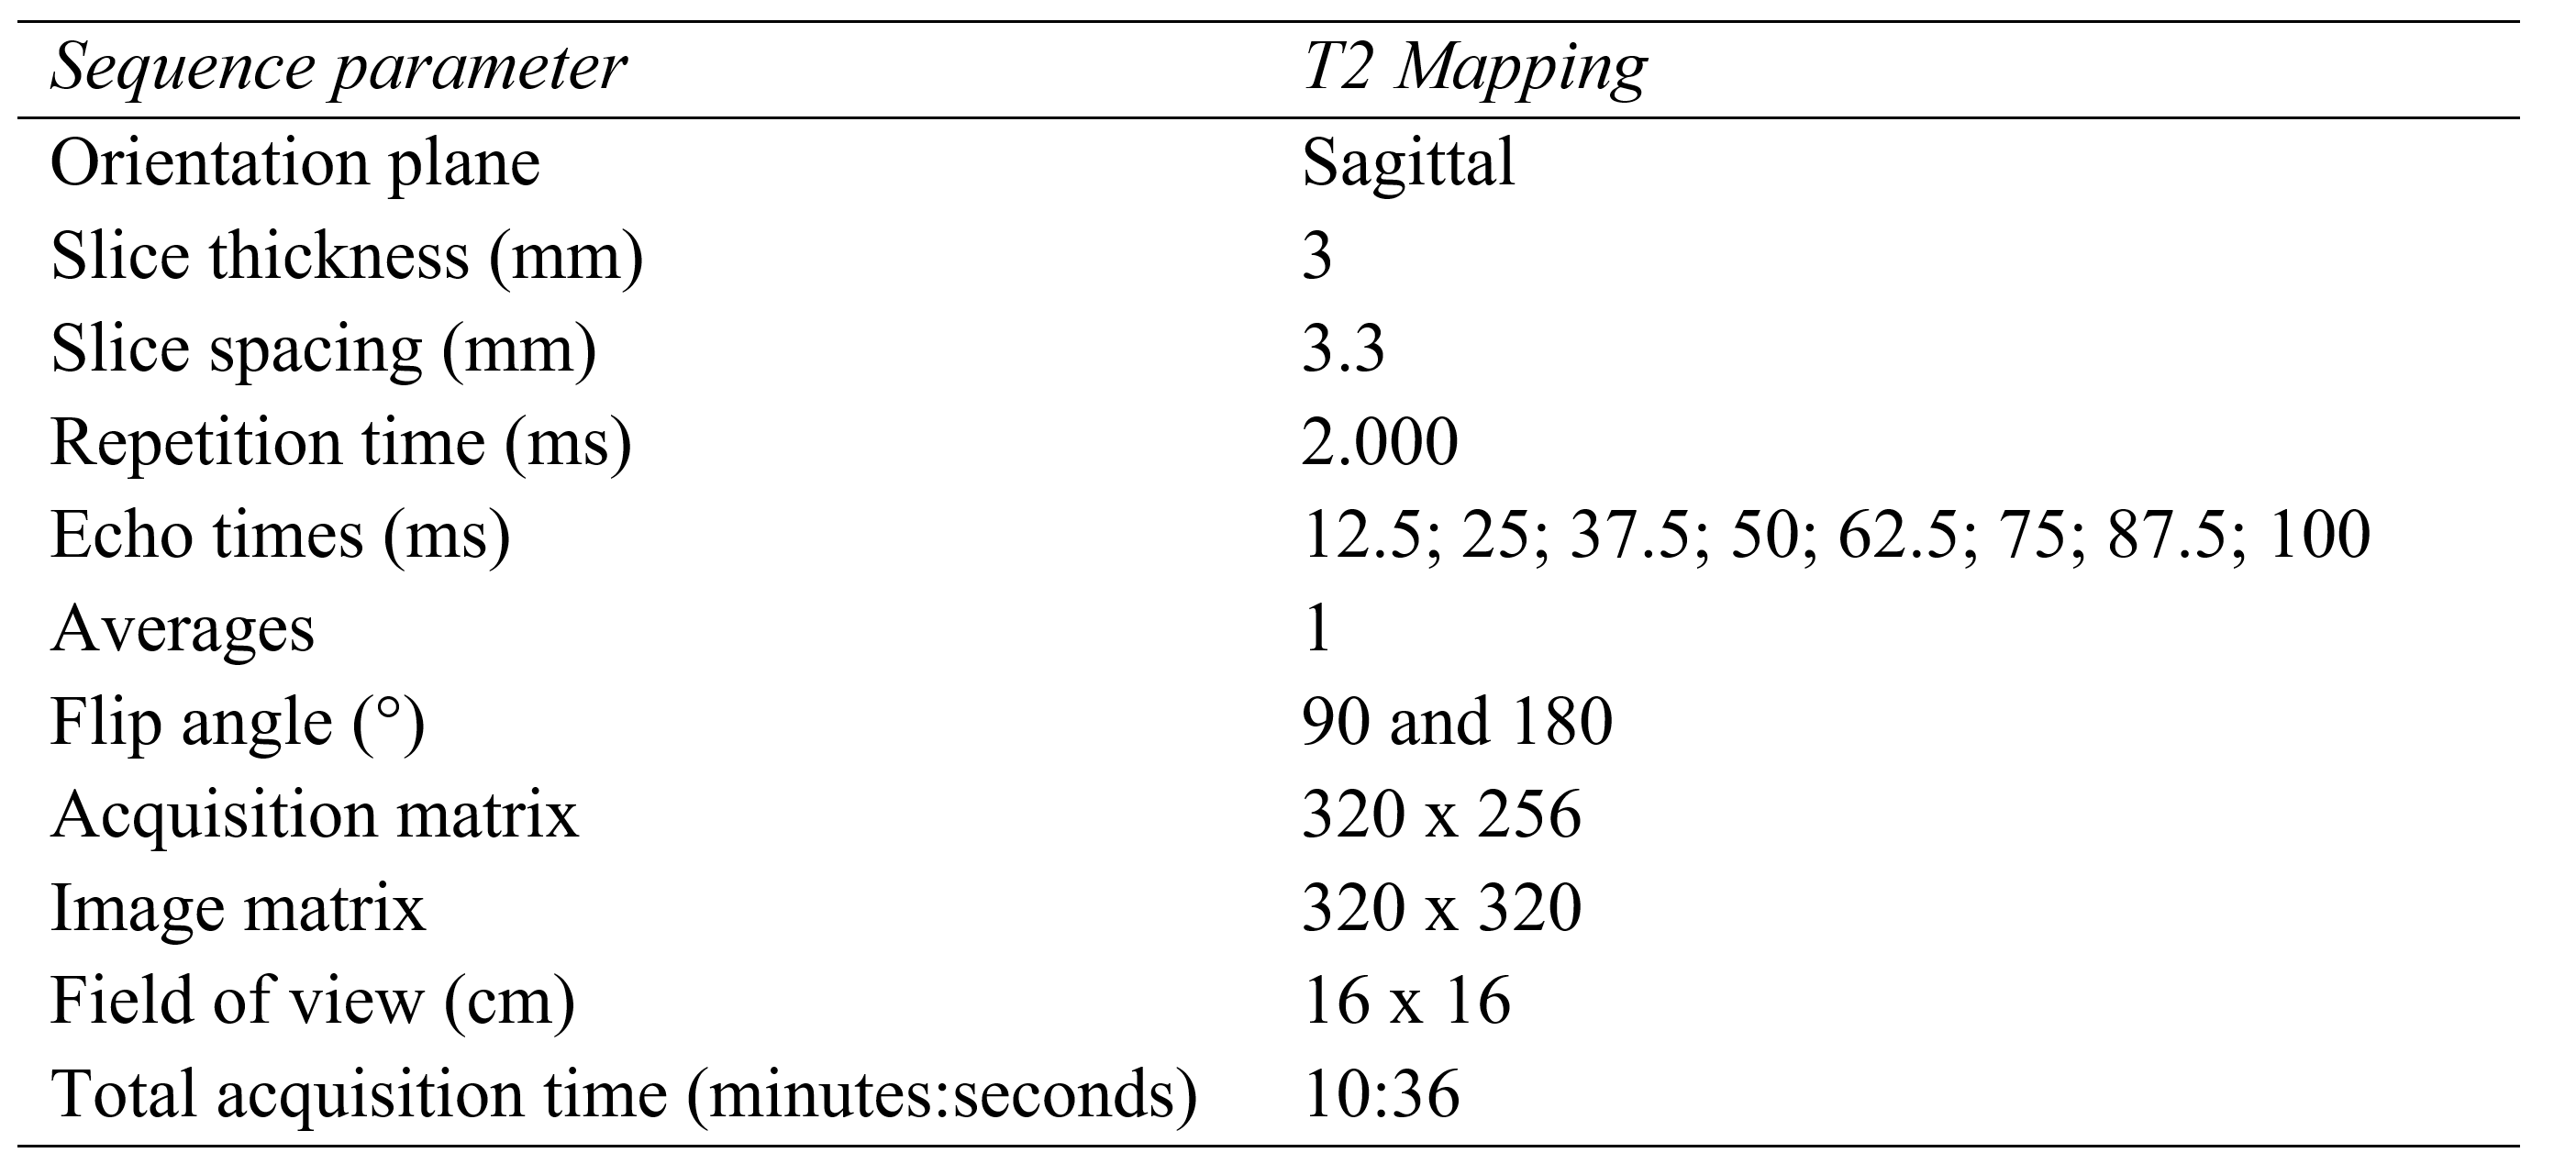
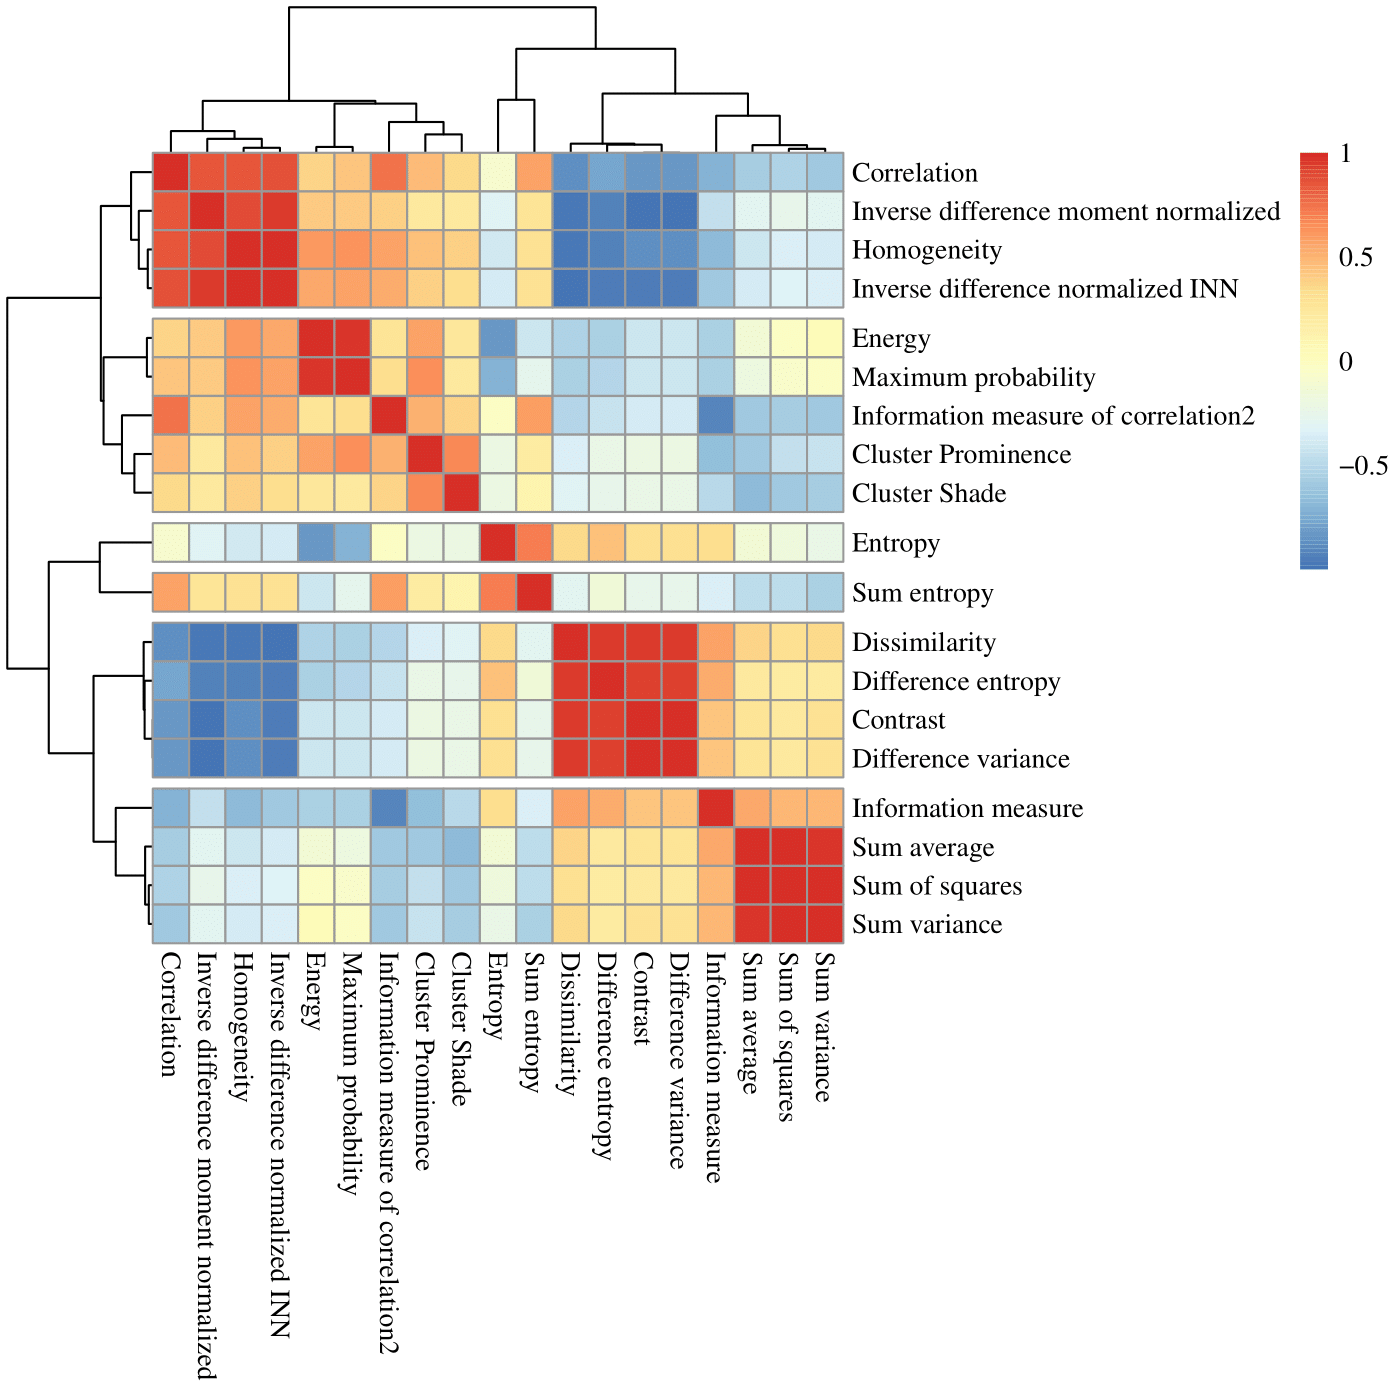
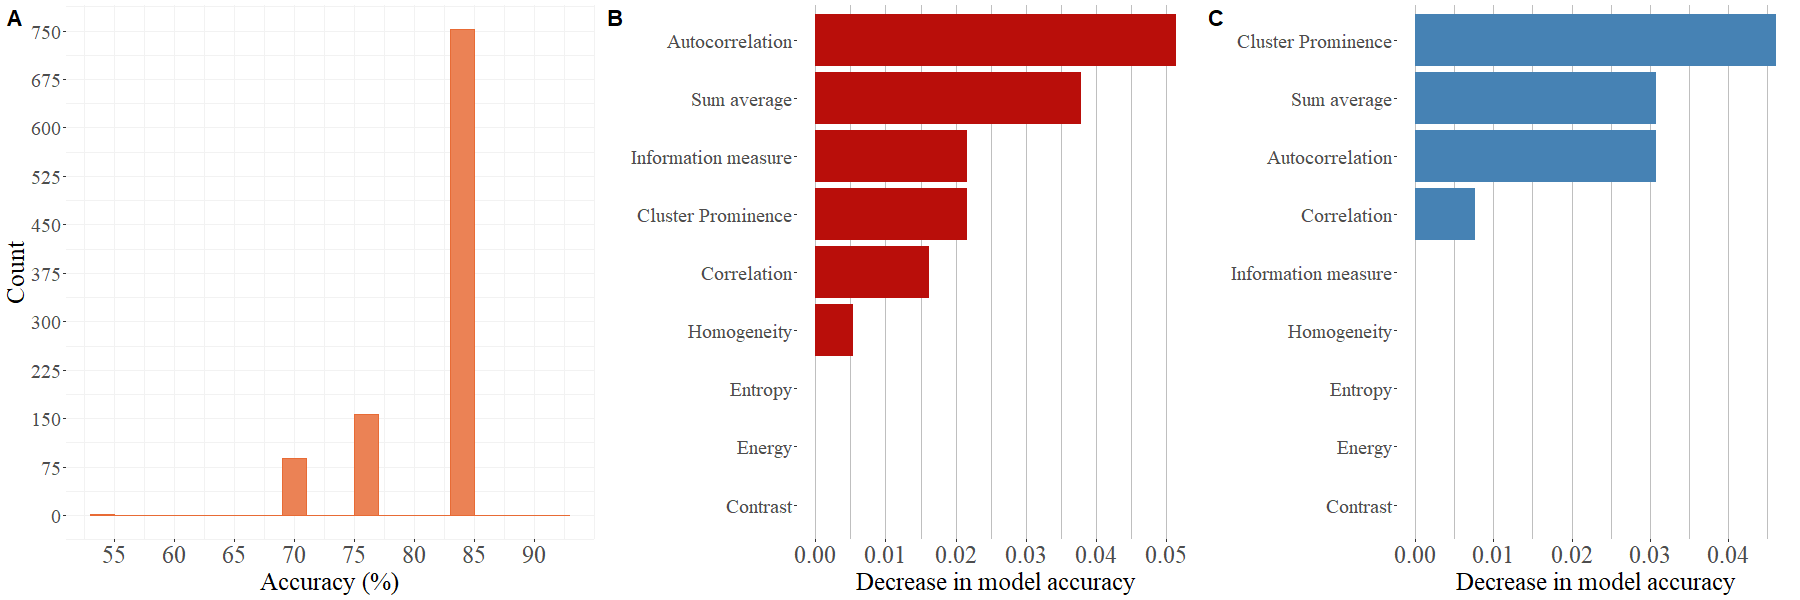
Twenty-five patients underwent a knee MR examination in a multi-center study. T2 mapping sequence parameters are listed in the Table 1. T2 mapping was performed using mono-exponential decay fitting with 2-parameters (M0: ‚zero magnetization‘ and T2: ‚transversal relaxation constant‘). Regions-of-interest (ROI) were defined on two or three consecutive slices on T2 mapping sequence using JiveX (Visus, Bochum, Germany) and transferred onto T2 maps using a script written in MATLAB 9.6 (Mathworks, Natick, MA, USA). ROIs were rotated and flattened, quantized into 16 grey levels and GLCM analysis was computed with offset: 0° angle (parallel to cartilage surface) and step of length 1 (considering pixel and its immediate neighbor). Mean T2 value and twenty quantitative features1,4 were extracted averaged through the slices ROI-wise (autocorrelation, cluster prominence, cluster shade, contrast, correlation, difference entropy, difference variance, dissimilarity, energy, entropy, homogeneity, information measure, information measure of correlation 2, inverse difference moment normalized, inverse difference normalized INN, maximum probability, sum average, sum entropy, sum of squares, sum variance). Nine features were selected based on correlation cluster analysis (Figure 2): autocorrelation, contrast, correlation, cluster prominence, energy, entropy, homogeneity, sum average and information measure. Machine learning task was performed in Python 3.8.5 using scikit-learn version 1.0.1. We trained separately model with all twenty GLCM features and with 9 selected. Datasets were split into training set (75%) and held-out validation set (25%) and random forest classification algorithm5 was performed 1000 times (Figure 1) for more general overview of performance. For each iteration, model was trained by grid search of hyperparameters (n_estimators, max_features, max_depth, min_samples_split, min_samples_leaf) with 3-fold cross-validation on training set. Then, model was fitted onto validation set and accuracy, precision, recall, area under ROC curve (AUC) and permutation feature importance was calculated. Classification and importance metrics are presented as median, minimum and maximum value. Wilcoxon signed-rank test was used to compare mean T2 values of repair and reference tissue in R version 4.1.1 (R Foundation for Statistical Computing, Vienna, Austria).Results
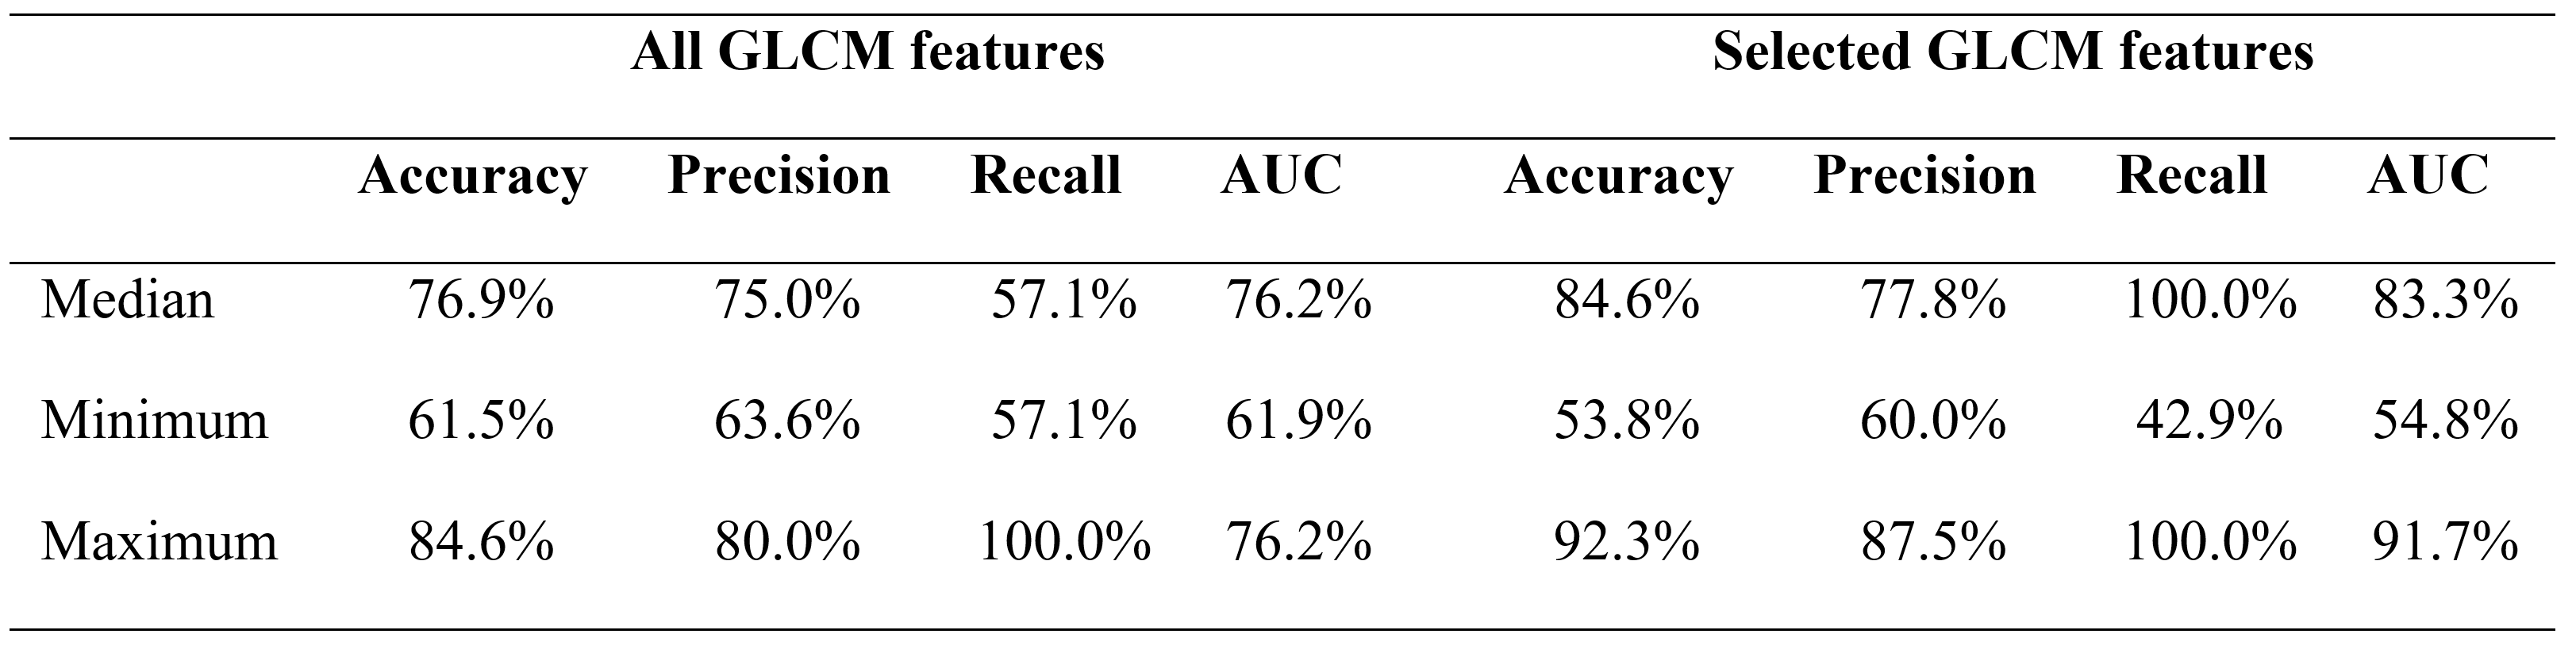
Mean T2 value in repair cartilage is 63.36 ± 13.22 ms and in reference cartilage 56.19 ± 7.11 ms and this difference is significant (p = 0.021). Median, minimum and maximum values of classification metrics are summarized in Table 2. Features with the highest median importance (the highest decrease in model accuracy after permutation) on training data were autocorrelation 0.05 (-0.04, 0.39), sum average 0.04 (-0.06, 0.04), information measure 0.02 (-0.07, 0.34), cluster prominence 0.02 (-0.05, 0.36), correlation 0.02 (-0.05, 0.34) and homogeneity 0.01 (-0.05, 0.24). On validation data cluster prominence 0.05 (-0.06, 0.28), sum average 0.03 (-0.11, 0.29), autocorrelation 0.03 (-0.1, 0.23) and correlation 0.01 (-0.06, 0.29) were important. Permutation feature importance is visualized on Figure 3. We plotted only importance computed from model with selection of GLCM features, because median importance value was 0 for all features, when all 20 GLCM features were included in model.Discussion/Conclusion
T2 mapping, has been proven to be reliable non-invasive diagnostic technique6, which is sensitive to collagen matrix organization and water content7. Difference of mean T2 values between treated and reference cartilage point towards difference in microstructure, which could be detected by texture analysis of T2 maps. Random forest classifier was able to distinguish between treated and reference cartilage with relatively high median accuracy of 84.6% considering low number of patients in our dataset. When using random forest classifier for identification of important features, it is crucial to compute importance on validation set, because when computed on training set some features importance might be overestimated. In our case homogeneity and information measure are not as important when classifying data unseen by the model during training. Permutation feature importance algorithm performs poorly when correlated features are present in dataset8, which explains median importance of 0 when all features are included in model. In our case, model containing all features performed considerably worse in comparison to simpler model. Cluster prominence, sum average, autocorrelation and correlation seem to be most useful texture features for our task. Random forests do not require normalization of data in comparison to other frequently used algorithm – for example support vector machine9, which adds to interpretability of model output. Implementing random forest algorithm for classification tasks considering texture analysis in combination with other statistical methods can help reveal the most important features.Acknowledgements
This study was supported by the Austrian Science Fund, KLI 917. The financial support by the Austrian Federal Ministry for Digital and Economic Affairs and the National Foundation for Research, Technology and Development is gratefully acknowledged.
References
1. Uppuluri A. GLCM_Features4.m: vectorized version of GLCM_Features1.m [with code changes]. Accessed October 12, 2021. https://www.mathworks.com/matlabcentral/fileexchange/22354-glcm_features4-m-vectorized-version-of-glcm_features1-m-with-code-changes
2. Van Griethuysen JJM, Fedorov A, Parmar C, et al. Computational radiomics system to decode the radiographic phenotype. Cancer Res. 2017;77(21):e104-e107. doi:10.1158/0008-5472.CAN-17-0339/SUPPLEMENTARY-VIDEO-S2
3. Hall-Beyer M. Practical guidelines for choosing GLCM textures to use in landscape classification tasks over a range of moderate spatial scales. Int J Remote Sens. 2017;38(5):1312-1338. doi:10.1080/01431161.2016.1278314
4. Haralick RM, Dinstein I, Shanmugam K. Textural Features for Image Classification. IEEE Trans Syst Man Cybern. 1973;SMC-3(6):610-621. doi:10.1109/TSMC.1973.4309314
5. Breiman L. Random Forests. Mach Learn 2001 451. 2001;45(1):5-32. doi:10.1023/A:1010933404324
6. Juras V, Schreiner M, Laurent D, et al. The comparison of the performance of 3 T and 7 T T2 mapping for untreated low-grade cartilage lesions. Magn Reson Imaging. 2019;55:86-92. doi:10.1016/j.mri.2018.09.021
7. Prasad AP, Nardo L, Schooler J, Joseph GB, Link TM. T1ρ and T2 relaxation times predict progression of knee osteoarthritis. Osteoarthr Cartil. 2013;21(1):69-76. doi:10.1016/j.joca.2012.09.011
8. Altmann A, Toloşi L, Sander O, Lengauer T. Permutation importance: a corrected feature importance measure. Bioinformatics. 2010;26(10):1340-1347. doi:10.1093/BIOINFORMATICS/BTQ134
9. Graf ABA, Borer S. Normalization in support vector machines. Lect Notes Comput Sci (including Subser Lect Notes Artif Intell Lect Notes Bioinformatics). 2001;2191:277-282. doi:10.1007/3-540-45404-7_37
Figures