1497
Two-dimensional population receptive field mapping of human primary somatosensory cortex
Michael Asghar1, Rosa Sanchez Panchuelo2, Denis Schluppeck1, and Susan Francis1
1University of Nottingham, Nottingham, United Kingdom, 2University Hospitals Birmingham NHS Foundation Trust, Birmingham, United Kingdom
1University of Nottingham, Nottingham, United Kingdom, 2University Hospitals Birmingham NHS Foundation Trust, Birmingham, United Kingdom
Synopsis
High-resolution fMRI data of somatosensory cortex were obtained at 7T (n=7 participants) using a 4x4 grid of piezoelectric stimulators. Population receptive field (pRF) mapping was performed using different model specifications (1D Gaussian within-digit, 1D Gaussian between-digit, 2D Gaussian of within-digit and between-digit, Unconstrained model) and pRF sizes were estimated. Grouping pRF response by 4 preferred locations within digits (along tip-base axis) or by Brodmann areas revealed more elliptical pRFs within digit representations of D2 to D4 and more circularly symmetric pRFs for D5. We also found relatively larger pRF sizes in D5 and towards the base of the digits.
Introduction
High spatial-resolution fMRI measurements can provide maps of finger representations in somatosensory cortex (S1). Often, “travelling-wave” (TW) or block alternation paradigms are used, resulting in maps of preferred-digit (D1-D5) location [1]–[4]. Further, TW stimulation from tip-base along the finger has shown that phase reversals correspond to borders in Brodmann areas (BA: 3a, 3b, 1, 2) [5]. Population receptive field (pRF) analysis provides additional measures such as pRF size[6]. Electrophysiological studies have shown differences in receptive field sizes for neurons representing the tips and more proximal portions of digits [7] while recent fMRI studies have inferred larger pRF sizes for D5 compared to other digits [8], [9]. A recent study used air-jets (at 15 positions on the hand) to stimulate digit tips (position P1) and base (P2) and the palm across digits (D1-5) [10]. Using a 2D Gaussian Bayesian pRF model they found more elliptical pRFs along the digit, with more rounded pRFs for D5 and the palm. Their results also pointed towards larger pRFs in BA1 and 2 than BA3a and 3b.Here, we used piezoelectric stimulation on 16 more closely spaced locations on the digits: the 4x4 grid covered D2-D5 (between-digit) and 4 sites separated by the interphalangeal creases (within-digit). We compared four pRF models: 1D Gaussian within-digit, 1D Gaussian between-digit, 2D Gaussian of within-digit and between-digit, and an Unconstrained model with a weight for each of the 16 locations.Methods
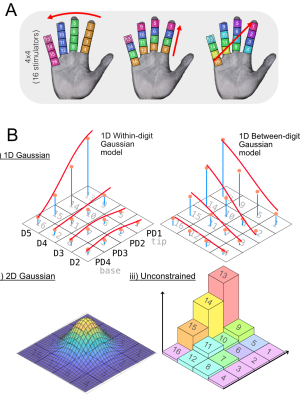
Acquisition: Data were collected in seven participants on a 7T (Philips Achieva) using a 32-channel receive coil. fMRI data were acquired using GE-EPI-BOLD, TR/TE=2000/25ms; 1.25mm isotropic, 34 slices with magnitude/phase data saved along with a noise scan. Structural T2*-weighted FLASH (0.5×0.5×1.5mm3) and PSIR (0.7mm isotropic) scans were collected. Vibrotactile stimuli were delivered using 16 MR-compatible piezo-electric stimulators (DancerDesign, UK) arranged in a 4×4 grid (D2-D5, and tip to base (proximal-distal (PD) 1-4). Stimulation followed a TW sequence in which 4 locations were simultaneously stimulated in a forward and reverse order in different orientations across the grid. For between and within digit, 4s ON (16s per cycle; 4 lines of stimulation) for 12 cycles (Fig.1a); for diagonal stimulation, 4s ON (28s per cycle, 7 lines of stimulation) for 12 cycles.Analysis: Data were distortion corrected (FSL TOP-UP) and thermal noise was removed using NORDIC[11]. We used Fourier-based analysis (mrTools[12]) to produce coherence and phase maps, which describe the digit-phase correspondence. Coherence maps from this analysis were used to define a small volume ROI encompassing pre-/post-central gyrus.The pRF analysis combines a model of stimulus selectivity (the “pRF”) with a time-dependent description of the stimulus to produce a predicted timeseries. Non-linear-least-squares can be used to estimate the best pRF parameters to optimise the fit with voxel-wise data. Four pRF models were explored (Fig.1b). The 1D-within-digit model used independent and separately scaled 1D-Gaussian profiles to describe the response profile. Here, the max of scale factors across digits was used to identify the preferred-digit and the location of the peak was used to find the preferred proximal-distal location. pRF sizes correspond to sigma. In 1D-between-digit (effectively a transpose of the 1D within-digit model), and 2D-Gaussian models, the spatial weighting profile was allowed to cross digits. In the Unconstrained model each stimulation site was controlled by a linear weight, the location of the maximum along each digit direction defined the preferred digit and PD location. To quantify pRF size we computed the spatial distribution of weights via the moment of inertia, with respect to their centre of mass. To assess the distribution of pRF sizes, voxels were (i) aggregated functionally, by the closest preferred stimulus location (16 sites) and (ii) anatomically by Brodmann areas: Freesurfer labels were imported into subject-space to define ROIs for each Brodmann area (BAs 1,2,3a,3b) for each of the four digits.
Results
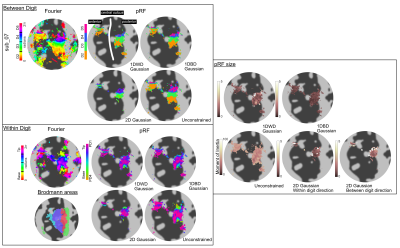
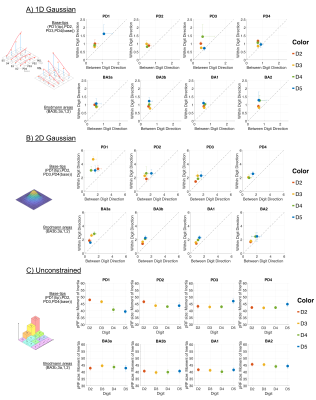
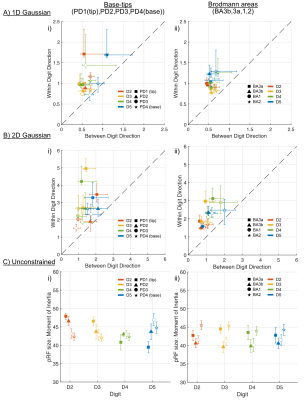
Distinct preferred-digit and preferred-proximal-distal (PD) maps were apparent for all subjects; this is shown in Figure 2 for an example subject along with pRF size. To identify which dimension the pRF shape preferred, Figure 3 shows the 1D within-digit versus 1D between-digit model pRF sizes (sigma of 1D Gaussian) and 2D Gaussian model (sigma in the x versus y-direction) for PD locations and BAs separately, and plot together to allow comparison (Figure 4).Separating the digits into PD locations or Brodmann areas, there was a strong preference for greater pRF size in the within-digit direction than between-digit, and hence an elliptical pRF shape (pRF sizes along x=y would be perfectly circular). When extracting the pRF sizes in tip-base locations for the 1D Gaussian models, we found a slight preference for D5 (blue) to be more circular. We also found a tendency for larger pRF sizes for D4 and D5. For the Unconstrained model, PD3 and PD4 had larger pRF sizes in D5.
Discussion
Using a 4x4 stimulation grid, we show greater preference for elliptical pRFs in human S1, with the long axis in the within-digit direction. There was a slight preference for D5 to have a more rounded pRF shape, consistent with Wang et al. [10], and the digit bases to have larger pRF sizes.Acknowledgements
This work was supported by MRC grant (MR/M022722/1).References
[1] R. M. Sanchez-Panchuelo, S. Francis, R. Bowtell, and D. Schluppeck, “Mapping Human Somatosensory Cortex in Individual Subjects With 7T Functional MRI,” J. Neurophysiol., vol. 103, no. 5, pp. 2544–2556, 2010.[2] R. M. Sanchez Panchuelo, J. Besle, D. Schluppeck, M. Humberstone, and S. Francis, “Somatotopy in the Human Somatosensory System,” Front. Hum. Neurosci., vol. 12, no. June, p. 235, 2018.[3] J. Besle, R. M. Sanchez-Panchuelo, R. Bowtell, S. Francis, and D. Schluppeck, “Single-subject fMRI mapping at 7 T of the representation of fingertips in S1: a comparison of event-related and phase-encoding designs,” J. Neurophysiol., vol. 109, no. 9, pp. 2293–2305, 2013.[4] J. Kolasinski, T. R. Makin, S. Jbabdi, S. Clare, C. J. Stagg, and H. Johansen-Berg, “Investigating the Stability of Fine-Grain Digit Somatotopy in Individual Human Participants,” J. Neurosci., vol. 36, no. 4, pp. 1113–1127, 2016.[5] R. M. Sanchez-Panchuelo, J. Besle, A. Beckett, R. Bowtell, D. Schluppeck, and S. Francis, “Within-Digit Functional Parcellation of Brodmann Areas of the Human Primary Somatosensory Cortex Using Functional Magnetic Resonance Imaging at 7 Tesla,” J. Neurosci., vol. 32, no. 45, pp. 15815–15822, 2012.[6] S. O. Dumoulin and B. A. Wandell, “Population receptive field estimates in human visual cortex,” Neuroimage, vol. 39, no. 2, pp. 647–660, 2008.[7] Y. Iwamura, “Hierarchical somatosensory processing,” Curr. Opin. Neurobiol., vol. 8, no. 4, pp. 522–528, 1998.[8] W. Schellekens, N. Petridou, and N. F. Ramsey, “Detailed somatotopy in primary motor and somatosensory cortex revealed by Gaussian population receptive fields,” Neuroimage, vol. 179, no. May, pp. 337–347, 2018.[9] A. M. Puckett, S. Bollmann, K. Junday, M. Barth, and R. Cunnington, “Bayesian population receptive field modeling in human somatosensory cortex,” Neuroimage, vol. 208, no. December 2019, p. 116465, 2020.[10] L. Wang et al., “Population Receptive Field Characteristics in the between- And Within-Digit Dimensions of the Undominant Hand in the Primary Somatosensory Cortex,” Cereb. Cortex, vol. 31, no. 10, pp. 4427–4438, 2021.[11] L. Vizioli et al., “Lowering the thermal noise barrier in functional brain mapping with magnetic resonance imaging,” Nat. Commun., vol. 12, no. 1, 2021.[12] J. L. Gardner, E. P. Merriam, D. Schluppeck, J. Besle, and D. J. Heeger, “mrTools: Analysis and visualization package for functional magnetic resonance imaging data,” Jun. 2018.Figures

A) Each subject performed 2x between digit, 4x within digit, and 2x diagonal stimulation, repeated for 12 cycles each, with stimulation line lasting 4 s. B) Four pRF models used to estimate the pRFs across the hand. Ai) A 1D Gaussian was fit along or between the digits. Aii) For the 2D-Gaussian fit, pRF size was calculated as the sigma of the Gaussian in x and y. Aiii) No model was predefined for the Unconstrained version; the preferred locations were found directly from the weights.

Example subject’s output maps are shown. Data were projected to the individual’s flattened surface from the Freesurfer segmentation and shown zoomed into the pre/post-central gyrus. The travelling wave (TW) and corresponding pRF maps of the preferred-digit and preferred proximal-distal (PD) location for each model. Maps of pRF size for each of the 4 models are also shown. Brodmann areas are highlighted which were imported from Freesurfer labels.

pRF size in both between digit and within digit axes are plot for pRF models. A) For the 1D Gaussian model, the within-digit Gaussian model sigma is plot against the between-digit Gaussian model s. B) For the 2D Gaussian model, sigma(x) was plot against sigma(y). For Unconstrained, the moment of inertia is plot as a measure of pRF size. Plots are separated by either tip-base location (PD1-4), or Brodmann area (BA3a-2), and coloured by digit (D2-5).

pRF size divided by digit tip-base area and Brodmann areas. Data from Figure 3 are plotted here for all tip-base locations or Brodmann areas collapsed into one plot for each model. For A) and B) x=y represents a circular pRF, pRF shapes show preference towards an elliptical shape for within-digit. Colours are digits, and shapes are either tip-base location (left column) or Brodmann area (right column).
DOI: https://doi.org/10.58530/2022/1497