1496
The association of thigh muscle volume and fatty infiltration with knee joint structural damage1Radiology and Biomedical Imaging, University of California, San Francisco, San Francisco, CA, United States, 2Epidemiology and Biostatistics, University of California, San Francisco, San Francisco, CA, United States
Synopsis
Knee osteoarthritis results from inflammatory, mechanical, and metabolic processes, leading to chronic degenerative changes. The purpose of this study was to investigate the cross-sectional associations between thigh muscle volume or intermuscular fat volume, and relative muscle sizes, from T1-weighted MR images of 100 thighs, and radiographic knee osteoarthritis (ROA) using Kellgren-Lawrence grades. The results showed that lower volumes of the quadriceps and the anterior muscle compartment of the thigh relative to total muscle volume, as well as relative higher hamstring muscle volume were associated with presence of ROA (P<0.05).
Introduction
Knee osteoarthritis (OA), a chronic degenerative joint disease, results from inflammatory, mechanical and metabolic processes. While previous studies have investigated the relationship between intra-and intermuscular adipose tissue, muscle volume and radiographic knee OA, they have had small sample sizes, and few have used MRI for analysis1. It has been hypothesized that thigh muscle intra-and intermuscular adipose tissue may contribute to inflammatory joint damage in knee OA via adipokines2. In addition, thigh muscle volume has been associated with a higher incidence of radiographic OA (ROA)1,3–9. The purpose of this study was to investigate the cross-sectional associations between thigh muscle and intermuscular fat volume with knee ROA.Methods
Fifty MRI studies of bilateral limbs (total of 100 limbs) were randomly selected from the Osteoarthritis Initiative (OAI, https://oai.nih.gov) cohort, weighted to give approximately equal numbers based on sex, age (± 10 years), body mass index (normal, overweight, or obese), equally from each of the 4 OAI scanners before and after upgrades (Table 1). Image acquisition: Axial T1 weighted spin echo sequence (T1W-SE) [repetition time (TR) / echo time (TE); spatial resolution; field of view (FOV); slice thickness; gap] [500 ms / 10 ms; 0.977mm x 0.977 mm; 500 mm; 5 mm; 0 mm]. Both thighs, starting 10 cm proximal to the distal epiphysis of the right femur, extending 7.5 cm proximally were studied (approximately middle 33% of femur length). Image analysis: All muscle groups, including quadriceps (main knee extensors), sartorius, gracilis, hamstrings, adductors, along with deep fascia and subcutaneous fat border and neurovascular bundles, were manually segmented in 15 consecutive slices using an online annotation platform (https://MD.ai), from which volume measurements were computed in cm3 (Figure 1). Intermuscular fat volume was computed as the difference between the volume of deep fascia and the sum of the total muscular, neurovascular bundle, and femoral cortex volume. We grouped muscles to anterior (quadriceps including vastus lateralis, medialis and intermedius and rectus femoris + sartorius), medial (adductors + gracilis) and posterior (hamstring including biceps short and long heads, semitendinosus and semimembranosus) compartments. Additionally, age, sex, height, weight, Kellgren-Lawrence grade (KLG) and the physical activity scale for the elderly (PASE) scores were extracted from the OAI database. Statistics: Binary logistic regression using generalized estimating equations (accounting for two limbs per person) was used to analyze the associations between 6 MRI predictors and ROA outcomes using STATA version 16 software (StataCorp LP, College Station, TX, USA). MRI predictors were total muscle volume and the ratio of muscle volume (anterior, medial, and posterior compartments of the thigh and quadriceps) relative to total volume, as well as intermuscular fat volume each entered in separate models (Table 2). The outcome was radiographic KLG 0-1 (no ROA) vs 2-4 (ROA). All analyses were adjusted for age, sex, body mass index, height, and PASE.Results
Overall, women had higher subcutaneous fat volume (686.54 ± 256.93 cm3) compared to men (239.85 ± 99.24 cm3, p = 0.02). A summary of results is included in Table 2. Overall, total muscle volume was not associated with ROA [adjusted OR per SD reduction in the predictor = 1.44, 95% CI 0.67 – 3.12, p = 0.35]. The lower ratio of anterior muscle compartment/total muscle volume was associated with increased odds of ROA (adjusted OR per SD reduction in the predictor = 1.61 [1.02 – 2.56], P = 0.04), as was a lower ratio of quadriceps/total muscle volume (adjusted OR per SD reduction in the predictor = 1.69 [1.08 – 2.63, P = 0.02]). In contrast, a higher ratio of posterior muscle compartment (hamstring) volume/total muscle volume was associated with increased odds of ROA (adjusted OR per SD reduction in the predictor = 0.52 [0.32 – 0.86], P=0.01]). No significant associations were found between relative medial muscle compartment (versus total muscle volume) or intermuscular fat volume and ROA (p>0.05).Discussion
Despite emerging evidence on the potential role of the knee-adjacent adipose tissue in OA via adipokines, few studies have investigated the association between thigh muscle volume or fatty infiltration and radiographic knee OA, of which only a small number used MRI1. The results of this study showed that a lower ratio of muscle volume in the anterior muscle compartment of the thigh and quadriceps, as well as a higher ratio of muscle volume in hamstrings relative to the total muscle volume, are associated with increased odds for ROA. Additionally, our study showed no association between the structural knee damage and the intermuscular fat volume, unlike previously reported1,3,5, which may be due to selection criteria. The unique features of our study were the use of MRI and the analysis of multiple slices providing a comprehensive assessment of muscle volume, along with an analysis of the relative sizes of muscles/muscle groups, rather than just their absolute size.Conclusion
The lower volume of anterior muscle compartment of the thigh and quadriceps relative to total muscle volume, was associated with increased odds of knee ROA. In contrast, a higher posterior muscle compartment of the thigh relative to total muscle volume was associated with increased ROA. Additionally, there was no significant association between intermuscular fat volume and knee ROA in our study sample.Acknowledgements
The analyses in this study were funded through the NIH (National Institute of Arthritis and Musculoskeletal and Skin Diseases grants R01-AR078917). We would like to thank the faculty and staff of the Coordinating Center of the OAI at the NIH and UCSF for their invaluable assistance with patient selection, statistical analysis, and technical support. The OAI is a public-private partnership comprised of five contracts (N01-AR-2-2258; N01-AR-2-2259; N01-AR-2-2260; N01-AR-2-2261; N01-AR-2-2262) funded by the National Institutes of Health, a branch of the Department of Health and Human Services and conducted by the OAI Study Investigators. Private funding partners include Pfizer, Inc.; Novartis Pharmaceuticals Corporation; Merck Research Laboratories; and GlaxoSmithKline. Private sector funding for the OAI is managed by the Foundation for the National Institutes of Health.References
1. Pedroso MG, de Almeida AC, Aily JB, de Noronha M, Mattiello SM. Fatty infiltration in the thigh muscles in knee osteoarthritis: a systematic review and meta-analysis. Rheumatology International 2019 39:4. 2019;39(4):627-635. doi:10.1007/S00296-019-04271-2
2. Gabay O, Hall DJ, Berenbaum F, Henrotin Y, Sanchez C. Osteoarthritis and obesity: Experimental models. Joint Bone Spine. 2008;75(6):675-679. doi:10.1016/J.JBSPIN.2008.07.011
3. Beattie KA, MacIntyre NJ, Ramadan K, Inglis D, Maly MR. Longitudinal changes in intermuscular fat volume and quadriceps muscle volume in the thighs of women with knee osteoarthritis. Arthritis Care & Research. 2012;64(1):22-29. doi:10.1002/ACR.20628
4. Kumar D, Karampinos DC, MacLeod TD, et al. Quadriceps intramuscular fat fraction rather than muscle size is associated with knee osteoarthritis. Osteoarthritis and Cartilage. 2014;22(2):226-234. doi:10.1016/J.JOCA.2013.12.005
5. Maly MR, Calder KM, MacIntyre NJ, Beattie KA. Relationship of intermuscular fat volume in the thigh with knee extensor strength and physical performance in women at risk of or with knee osteoarthritis. Arthritis Care and Research. 2013;65(1):44-52. doi:10.1002/ACR.21868
6. Ikeda S, Tsumura H, Torisu T. Age-related quadriceps-dominant muscle atrophy and incident radiographic knee osteoarthritis. Journal of Orthopaedic Science. 2005;10(2):121-126. doi:10.1007/S00776-004-0876-2
7. Ruhdorfer A, Wirth W, Dannhauer T, Eckstein F. Longitudinal (4 year) change of thigh muscle and adipose tissue distribution in chronically painful vs painless knees – data from the Osteoarthritis Initiative. Osteoarthritis and Cartilage. 2015;23(8):1348-1356. doi:10.1016/J.JOCA.2015.04.004
8. Dannhauer T, Ruhdorfer A, Wirth W, Eckstein F. Quantitative relationship of thigh adipose tissue with pain, radiographic status, and progression of knee osteoarthritis: Longitudinal findings from the osteoarthritis initiative. Investigative Radiology. 2015;50(4):268-274. doi:10.1097/RLI.0000000000000113
9. Conroy MB, Kwoh CK, Krishnan E, et al. Muscle strength, mass, and quality in older men and women with knee osteoarthritis. Arthritis Care & Research. 2012;64(1):15-21. doi:10.1002/ACR.20588Figures
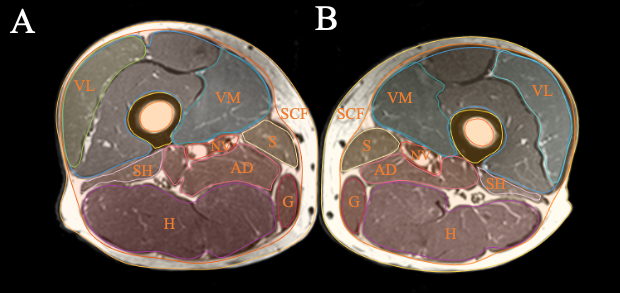
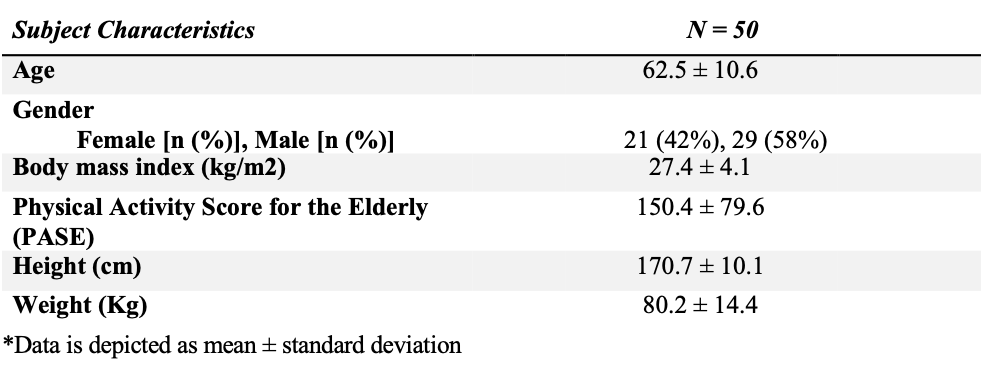
Table 1 – Subject Characteristics
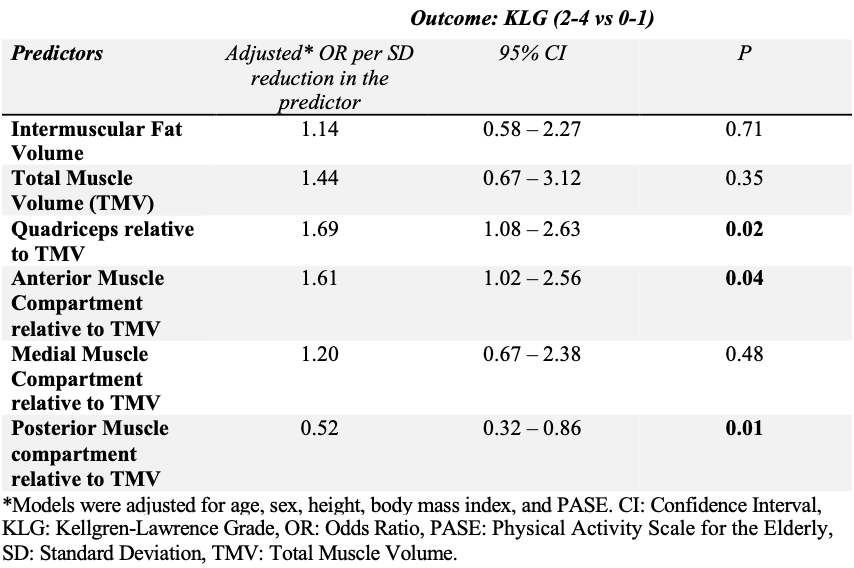
Table 2 – Adjusted* odds ratios for the strength of associations of total thigh muscle volume, intermuscular fat volume, and anterior, medial, and posterior compartment and quadriceps volume relative to total muscle volume with radiographic knee OA (KLG 2-4 vs KLG 0-1), expressed per 1SD reduction in the predictor.