1495
Compressed sensing and the use of 3D UTE acquisition for high-resolution accelerated 23NA imaging at 3T1Weldon School of Biomedical Engineering, Purdue University, West Lafayette, IN, United States, 2Department of Radiology, Medical Physics, Medical Center, University of Freiburg, Freiburg, Germany, 3Wellcome Centre for Integrative Neuroimaging, University of Oxford, Oxford, United Kingdom, 4College of Applied Medical Sciences, Prince Sattam bin Abdulaziz University, Al Kharj, Saudi Arabia, 5School of Health Sciences, Purdue University, West Lafayette, IN, United States
Synopsis
There is a need for methods to detect early compositional changes during musculoskeletal diseases like osteoarthritis, but current diagnostic tools . Sodium (23Na) MRI enables quantification of sodium content which is correlated with cartilage health. However, several limitations preclude its widespread clinical use including long scan times and low resolution. We have developed a UTE 23Na MRI sequence with rosette acquisition capable of overcoming some of these limitations. In this study we demonstrate the feasibility of reducing our acquisition time through compressed sensing while conserving signal quality in a healthy human knee.
Introduction
Sodium (23Na) has the potential to be a powerful early diagnostic tool for musculoskeletal diseases like osteoarthritis (OA), a debilitating synovial joint disease. 23Na is associated with cartilage health through its connection to proteoglycan content, an integral contributor to the robust mechanical strength of cartilage1,2. Proteoglycans consist of a protein backbone with highly negatively charged glycosaminoglycan (GAG) side chains. 23Na in the interstitial fluid is critical for maintaining charge and osmotic balance against the fixed charge density of the GAG-rich extracellular matrix. Since GAG degradation is one of the earliest changes during OA progression,3 tracking 23Na content will enable early diagnostics. However, detection of these early changes is limited by the currently available tools to diagnose OA. For example, although proton MRI enables detailed morphological visualization and characterization, sequences currently used in clinical practice cannot determine tissue composition. Additionally, MRI relaxometry can reflect extracellular matrix content but is susceptible to changes that may not be directly related to proteoglycan loss. For example, T1ρ relaxometry has also been correlated to GAG content but is also sensitive to relative water content in tissue4, prohibiting direct GAG quantification. 23Na MRI is a promising tool that enables GAG quantification because of the direct relationship between 23Na content and fixed charge density. However, current 23Na MRI sequences require long scan times (up to 30 minutes5) to achieve sufficient signal, reducing their clinical applicability. In addition to having a quickly decaying bi-exponential T2 relaxation (T2fast = 0.5–1.4ms) and slow (T2slow = 11.4–14.8ms)5, 23Na has a much lower gyromagnetic ratio and exists in much smaller quantities than hydrogen5,7. To overcome the limitations of quickly-decaying, low-amplitude magnetization, we have developed a novel ultrashort echo time (UTE) sequence with a rosette k-space trajectory. In this study, we aim to determine averaging and acceleration parameters to minimize scan time while preserving signal quality in the healthy human knee.Methods
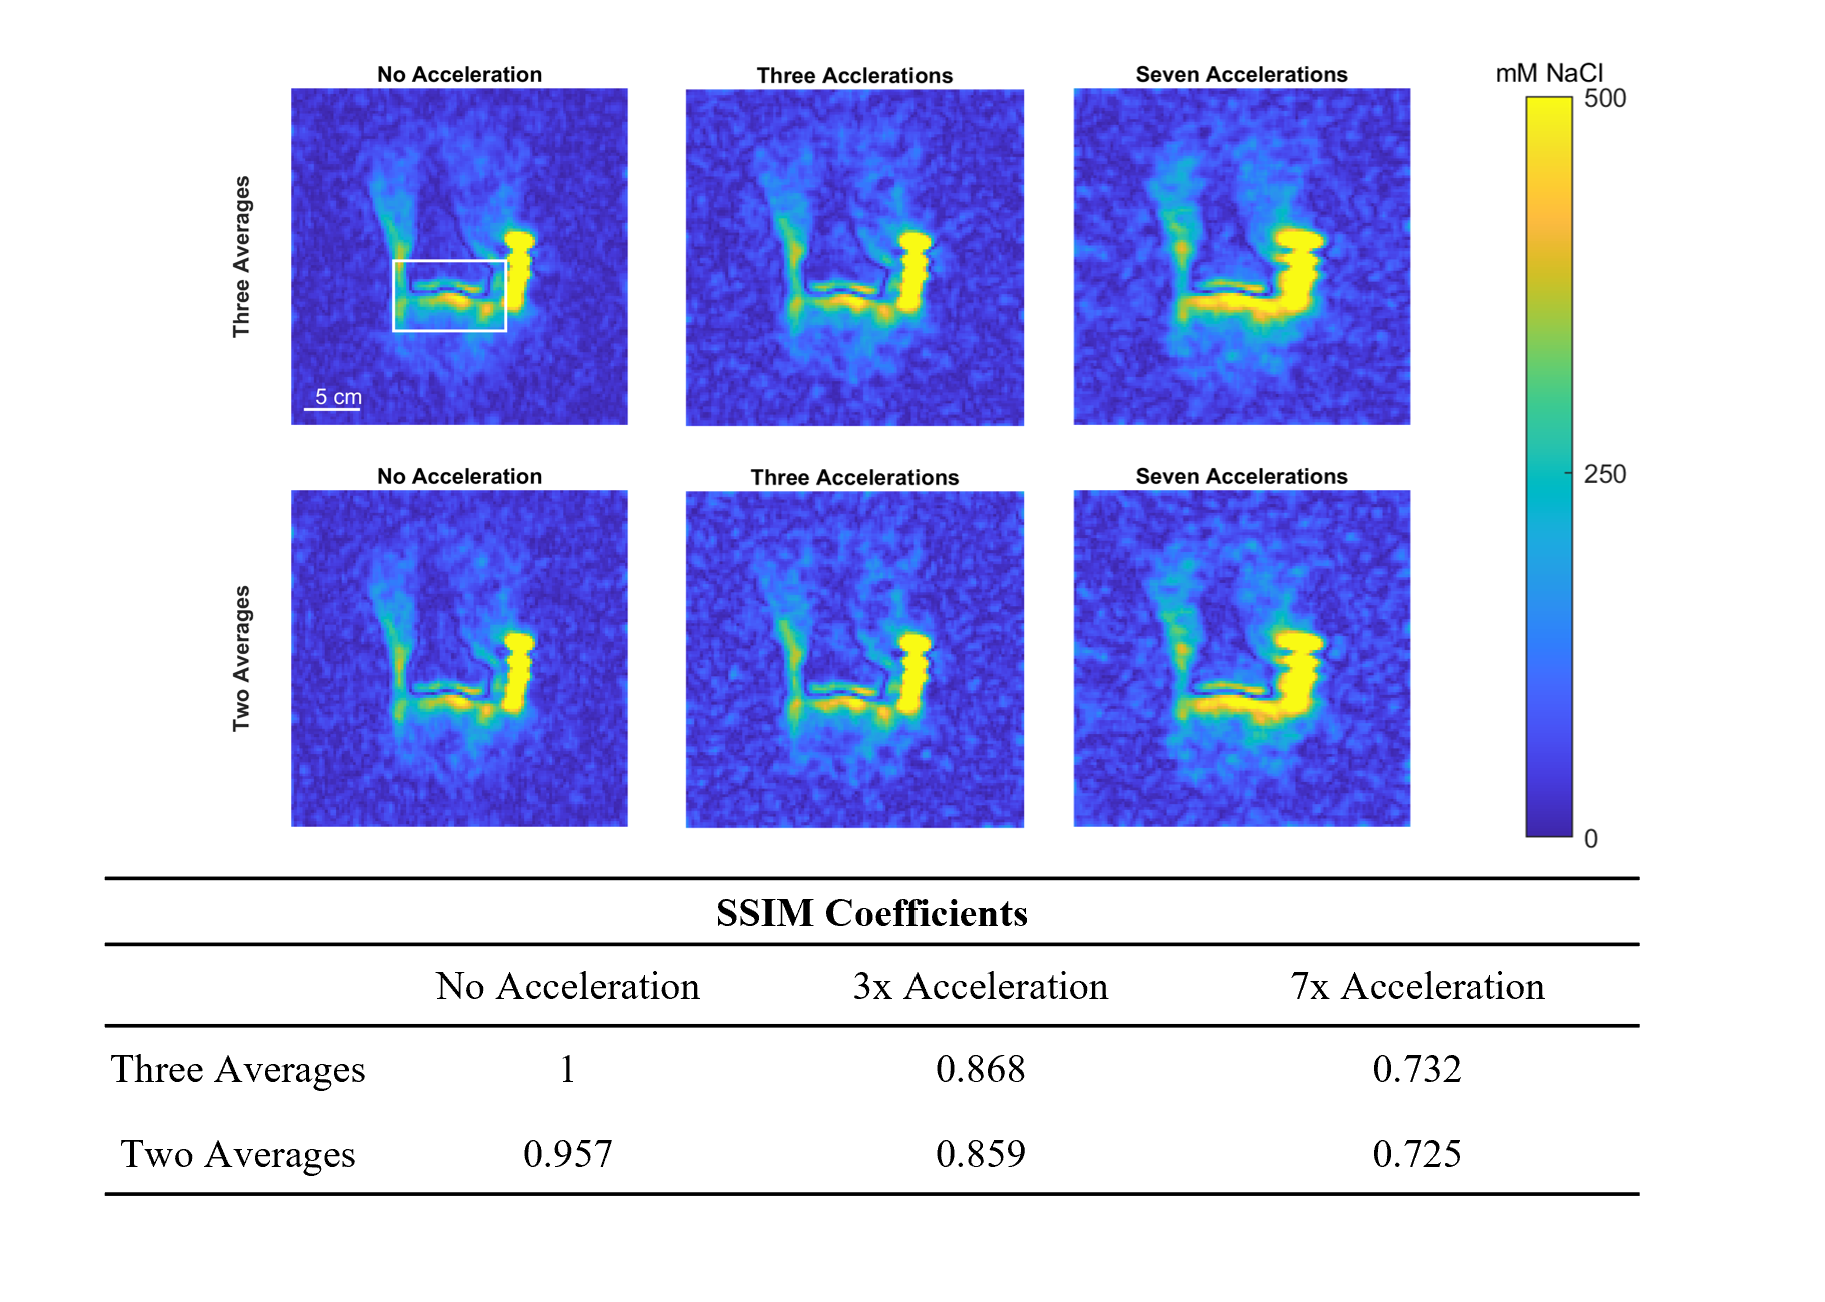
We scanned a healthy volunteer in a Siemens MAGNETOM Prisma 3-Tesla MRI (Germany) with a frequency-tuned, mono-resonant 23Na transmit/receive knee coil (32.6 MHz, Stark-Contrast, Erlangen, Germany) using a UTE sequence with rosette k-space trajectory and compressed sensing [TE/TR:100µs/11ms; FA = 40°; the number of averages, NA=3; isometric resolution 2.5mm; FOV: 300x300x400 mm; 189 rosettes; total acquisition time of 19:39]. Image reconstruction and post-processing steps were performed in MATLAB (MathWorks, USA) platform. Non-uniform fast Fourier Transform (NUFFT)8 was used to calculate the forward encoding transform of the acquired k-space data, and compressed sensing approach9 was used for reconstruction.To examine the effects of acceleration via compressed sensing, we simulated acquisitions using only 1/3 and 1/7 of the 189 rosette trajectories for acceleration factors of 3 and 7, respectively. We also compared the effect of reducing from three to two averages (NA=2) to further reduce the total acquisition time. We used a structural similarity coefficient between zero and one to evaluate the effect on image quality based on luminance, contrast, and structure. (ssim function, MATLAB, Mathworks). We detail the process by which we obtained our comparison slice in Figure 3. We chose a region of interest for comparisons that included the distal epiphysis of the femur and the proximal epiphysis of the tibia (Figure 4).
Results
The total scan times for each combination of averaging and acceleration were estimated (Table 1) to provide context for reductions in image quality with reduced averaging and acceleration by compressed sensing. Using experimental data with NA=3 and no acceleration as the reference, reduction to NA=2 yielded a structural similarity coefficient of 0.957. Using NA=3, three- and seven-times acceleration yielded structural similarity coefficients of 0.868 and 0.732, respectively. Using NA=2, the structural similarity coefficients were 0.859 and 0.725, respectively.Discussion
This study illustrates the feasibility of reducing acquisition time in a novel 23Na UTE MRI sequence. We were able to simulate three- and seven-times acceleration with our novel 23Na UTE sequence without significant signal loss, based on ssim coefficients, while maintaining an isometric resolution of 2.5mm. One of the most significant barriers to translating 23Na MRI to clinical application is long scan times, which lead to patient discomfort and considerable expenses. The acceleration and averaging parameters established in this work can reduce total acquisition time to under two minutes for two averages. UTE also enables us to capture more signal during the short relaxation time of 23Na.10Demonstration of the feasibility of our technique enables future work to evaluate changes in GAG content with exercise, injury, and OA progression. The ability of our novel UTE sequence to rapidly acquire a 23Na signal holds promise for applications beyond GAG quantification in the synovial joint. For example, imaging of dynamic 23Na content is feasible with our sequence, potentially enabling a host of applications ranging from muscular physiology to neurological imaging.
Conclusion
In this study, we showed the feasibility of three- and seven-times acceleration with compressed sensing which will greatly reduce scan time which greatly reduces scan time while maintaining resolution.Acknowledgements
Data acquisition was supported in part by NIH grant S10 OD012336.References
- D. Hayashi, F. W. Roemer, and A. Guermazi. Imaging of osteoarthritis recent research developments and future perspective. BJR. 2018;91: 20170349
- Fox, S, A. Bedi, and S. A. Rodeo, The Basic Science of Articular Cartilage: Structure, Composition, and Function Sports Health. 2009; 1(6):461-468.
- B. Xia, D, Zhang, J., S. Hu, H, et al., Osteoarthritis Pathogenesis: A Review of Molecular Mechanisms. Calcif Tissue Int. 2014;95(6):495-505.
- Heckelman, L, Lauren,N, et al., Quantifying the biochemical state of knee cartilage in response to running using T1rho magnetic resonance imaging. Sci Rep. 2020;10(1):1870- 1877.
- Š. Zbýň, V. Mlynárik, V. Juras, et al., Evaluation of cartilage repair and osteoarthritis with sodium MRI: Evaluation of Cartilage Repair and Osteoarthritis with Sodium MRI. NMR Biomed. 2016;27(2):206-215.
- Š. Zbýň, V. Mlynárik, V. Juras, et al. Sodium MR Imaging of Articular Cartilage Pathologies. Curr Radiol Rep. 2014;2(4):41-51.
- G. Madelin and R. R. Regatte. Biomedical applications of sodium MRI in vivo: Biomedical Applications of Sodium MRI. J. Magn. Reson. Imaging. 2013;38(3):511-529
- Knoll F, Bredies K, Pock T, Stollberger R. Second order total generalized variation (TGV) for MRI. Magn Reson Med 2011;65(2):480-491
- Fessler, JA, Sutton, BP. Nonuniform fast Fourier transforms using min-max interpolation Ieee T Signal Process 2003;51(2):560-574
- Alhulail, A.A, Xia, P, Shen, X. et al., Fast in vivo 23 Na imaging and mapping using accelerated 2D‐FID UTE magnetic resonance spectroscopic imaging at 3 T: Proof of concept and reliability study Magn. Reson. Med.,2021;85(4):1783-1794.
Figures
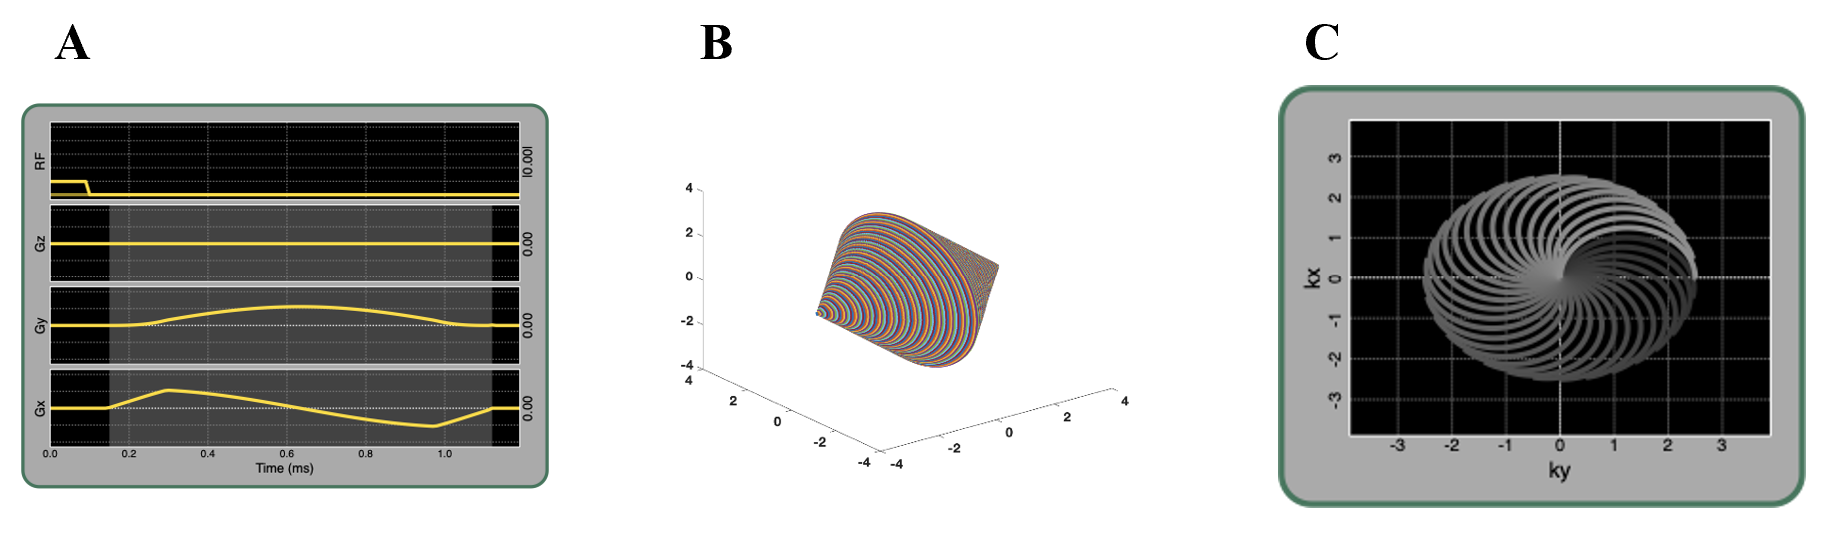
Figure 1: Graphical representation of the pulse sequence and k-space trajectory utilized in this study. A) The oscillating waveforms (Gx and Gy) were designed using 2D class 2 rosette trajectory waveforms. A constant Gz gradient made the acquisition along the z-direction B) k-space trajectories for the 3D cones acquisition C) Illustration of the complete set of 2D rosette Class 1 patells acquired for each kz. This will result in the k-space trajectories for the 3D Cones Acquisition by combining the rosette trajectory in the kx-ky plane and the radial trajectory along the kz direction.
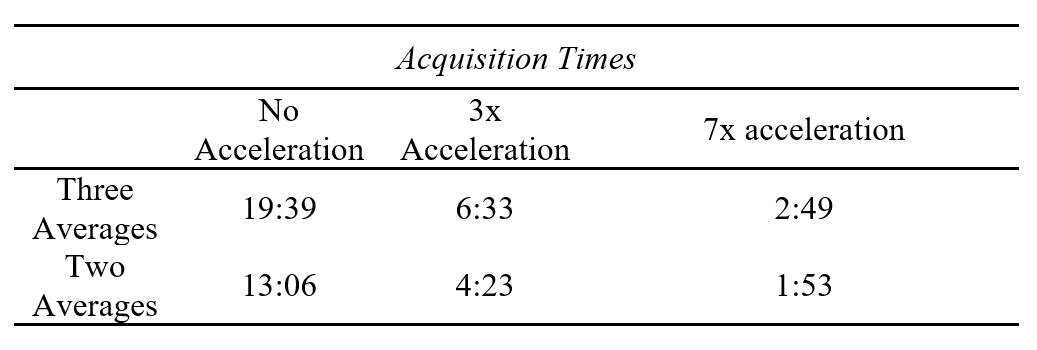
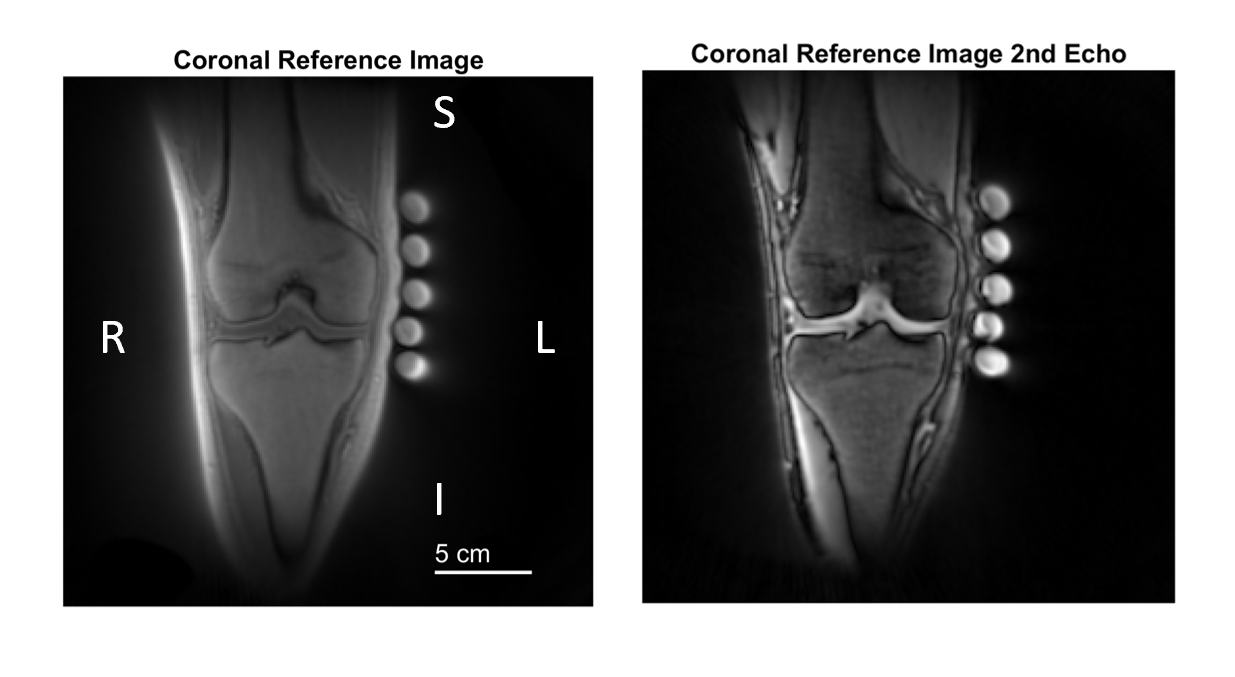
Figure 3: Anatomical reference image in the coronal plane obtained with first and second echoes. S denotes superior, I, inferior, L, left and R right. We obtained this image with a proton UTE sequence with 0.9375mm isometric resolutionand TE = 70 µs. We selected a coronal slice containing the intercondylar eminence to visualize detailed morphology of the knee with the first (A) and second (B) echoes.