1494
Correlation of Fractional Anisotropy and Histological Measures of Muscle Architecture in Vastus Lateralus in Legs with Injured ACL
Peter Andrew Hardy1, Christopher Fry2, Anders Andersen3, Katherine Thompson4, Thorsten Feiweier5, and Brian Noehren6
1Radiology, University of Kentucky, Lexington, KY, United States, 2Athletic Training and Clinical Nutrition, University of Kentucky, Lexington, KY, United States, 3MRISC, University of Kentucky, Lexington, KY, United States, 4Statistics, University of Kentucky, Lexington, KY, United States, 5Diagnostic Imaging, Siemens Healthcare, GmbH, Erlangen, Germany, 6Physical Therapy, University of Kentucky, Lexington, KY, United States
1Radiology, University of Kentucky, Lexington, KY, United States, 2Athletic Training and Clinical Nutrition, University of Kentucky, Lexington, KY, United States, 3MRISC, University of Kentucky, Lexington, KY, United States, 4Statistics, University of Kentucky, Lexington, KY, United States, 5Diagnostic Imaging, Siemens Healthcare, GmbH, Erlangen, Germany, 6Physical Therapy, University of Kentucky, Lexington, KY, United States
Synopsis
We measured diffusion tensor properties of the vastus lateralus muscle in 30 subjects who had a torn ACL. DTI was acquired with a stimulated echo acquisition with a diffusion time of 185 ms. From biopsies of the muscle taken simultaneously we developed histological measures of muscle fiber cross sectional area and minimum Feret diameter. Linear regression analysis demonstrated strong association of the fractional anisotropy and minimum Feret diameter.
INTRODUCTION
Following an anterior cruciate ligament (ACL) injury patients experience prolonged muscle weakness – a condition which delays returning to normal activities and which can lead to osteoarthritis. Using biopsies from the vastus lateralis (VL) muscle in ACL injured legs we have shown an increase in the extracellular matrix and a commensurate reduction in muscle fiber cross sectional area (1). While informative, muscle biopsies have significant limitations: they are invasive, provide limited sampling of what could be a heterogeneous condition and are unable to evaluate deeper muscles. Consequently, there is an outstanding need to develop non-invasive methods to characterize muscles following disease and traumatic injury. The purpose of this study was to compare DTI measures of muscle fibers with histological measures taken from muscle biopsies.METHODS
Male and female subjects (n=30) with an acutely torn ACL were recruited in this IRB-approved study. Subjects were completely weight-bearing at the time of data collection. Subjects were scanned on a clinical, 3T scanner (MAGNETOM Prisma Fit, Siemens Healthcare, Erlangen, Germany). They were oriented feet-first with the 18 element, flexible, body array placed around the thigh. DTI was obtained using a prototype sequence with stimulated echo (STE) diffusion encoding and an echoplanar readout. 21 slices (6 mm thickness) were acquired with an in-plane resolution of 2 x 2 mm2. Two b-values, 0 (n=4) and 500 (n=27) s/mm2 were acquired with TR/TE = 7500 ms/37 ms, δ=5.4 ms and Δ=185 ms (2). From the raw diffusion weighted images, eigenvalues and eigenvectors were calculated off line using custom developed code in MATLAB (MathWorks, Natick, MA). Starting from the aponeurosis which was outlined manually on the b=0 DTI, fibers were tracked for as long as FA>0.15 or the track exited the muscle volume. Biopsies from the ACL-deficient and healthy limbs were collected within 24 hours after MRI. A T1-weighted transverse, Turbo Spin Echo image acquired at the location of the central slice of the DTI volume was available for review to guide the selection of the site for obtaining the biopsy. Approximately 50 mg was mounted in tragacanth gum on cork and flash frozen in liquid nitrogen-cooled 2-methylbutane. From 7 μm thick slices, skeletal muscle basement membrane was labeled with a fluorescently-conjugated antibody against laminin. Images were captured at 100X magnification at room temperature using a Zeiss upright microscope. Image analysis was performed in an automated fashion with MyoVision to determine the mean cross-sectional area and the minimum Feret diameter (minFD) of the muscle fibers (3). Statistical analysis was performed using EXCEL and the R package.RESULTS
The subjects fell within a narrow range of age, (21.2±5.7yrs old), and body habitus: (24.1±5.7 BMI). A typical histological sample from one subject is shown in figure 1. The fiber area and diameters were derived automatically from the central areas of the muscle section which were least distorted by slide preparation. From the measured areas and recognizing the approximate hexagonal shape of the fibers we estimated the average fiber radius.Figure 2 shows histograms of radius and minFD. Relationships between diffusion tensor parameters (λ1, RD, & FA) with minFD were explored using linear regression. The results are shown in table 1. There was a positive relationship between RD and minFD although the relationship did not reach statistical significance. The slope of the relationship between λ1 and minFD and radius and between FA and minFD and radius were negative supporting the assumption that smaller fiber diameters lead to greater diffusion restriction. Strength of the correlation between the diffusion parameters and the histological measures was stronger when using minFD instead of fiber radius. The highest correlation was found between mean FA and minFD. The inverse relationships between RD v minFD, and between λ1 and minFD lead to the statistically significant relationship of FA and minFD.
DISCUSSION
The results contribute novel data for restricted diffusion in a biological model with dimensions much larger than in neurological or cancer models. By storing magnetization along the longitudinal axis during the mixing time TM, STE encoding enables long diffusion times while keeping TE short to preserve SNR from tissue with short T2 and long T1 relaxation times such as for muscle. Related, the ability to achieve a long diffusion time is critical for exploring restricted diffusion in the muscle fibers which have dimensions ~ 50 μm. We identified a correspondence between the diffusion tensor parameters, RD, λ1 and FA and with both fiber radius and minFD. The relationships were stronger between the DTI measures and minFD indicating the importance of the minimum dimension of the fibers affecting the free diffusion of water. Curiously, there was a strong inverse relationship between RD and λ1 with respect to minFD indicating that when the size of the fiber was reduced there was a corresponding increase in the mean free path for water diffusion along the length of the fiber. The cause of this change remains to be explored.CONCLUSION
These results strongly support the use of DTI to evaluate changes in muscle as a result of aging, disuse, or a variety of diseases. In comparison with biopsies the technique can assess all muscles in the thigh and infer valuable information about muscle fiber architecture.Acknowledgements
The work was supported by NIH grants 1R01AR071398, 1R01AR072061, and 1S10OD023573.References
(1) T1rho imaging as a non-invasive assessment of collagen remodeling and organization in human skeletal muscle after injury B. Noehren, et al in press, J Physiology 2021 (2) Comparison of twice refocused spin echo versus stimulated echo diffusion tensor imaging for tracking muscle fibers, B. Noehren, et al. J Mag Reson Imaging 41:624-632 (2015). (3) Wen, Y., et al (2018). “MyoVision : software for automated high-content analysis of skeletal muscle immunohistochemistry.” J Appl Physiol (1985) 124(1): 40-51.Figures
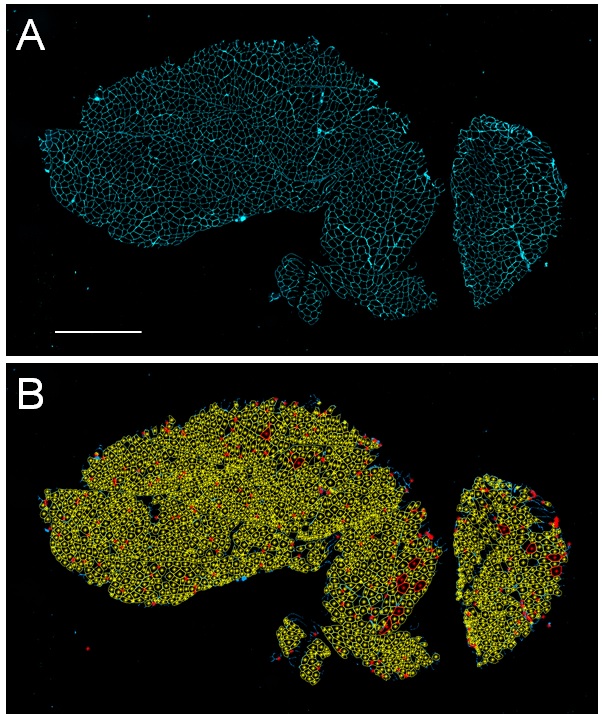
Figure 1. Immunohistochemical stained muscle sections
acquired from the vastus lateralis quadriceps muscle of one subject. A)
Representative image showing muscle fibers labeled with an antibody against
laminin (cyan; scale bar=500µm); B) Automated analysis shows fibers included
highlighted in yellow with excluded fibers highlighted in red.

Figure 2. Histograms of the frequency of A) fiber radius and
B) minimum Feret diameter.
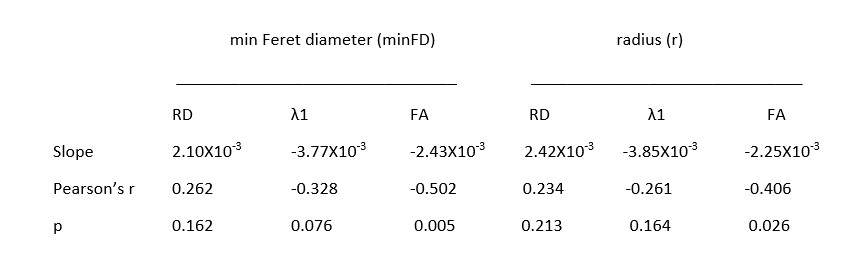
Table 1. Slopes, correlation coefficients and p-value between DTI parameters,
minFD and fiber radius.
DOI: https://doi.org/10.58530/2022/1494