1493
Comparison of Two Methods for Measuring Knee Cartilage Thickness in Lower Extremities Using 7T Magnetic Resonance Imaging: A Cadaver Study1Department of Cybernetics and Biomedical Engineering, VSB–Technical University of Ostrava, Ostrava, Czech Republic, 2High Field MR Centre, Department of Biomedical Imaging and Image-Guided Therapy, Medical University of Vienna, Vienna, Austria, 3Institute for Clinical Molecular MRI in the Musculoskeletal System, Karl Landsteiner Society, Vienna, Austria, 4Department of Orthopedics and Trauma Surgery, Medical University of Vienna, Vienna, Austria, 5Department of Imaging Method, Faculty of Medicine, University of Ostrava, Ostrava, Czech Republic, 6Department of Imaging Method, University Hospital Ostrava, Ostrava, Czech Republic, 7Novartis Institutes for Biomedical Research, Translational Medicine, Basel, Switzerland, 8Center for Anatomy and Cell Biology, Division of Anatomy, Medical University of Vienna, Vienna, Austria, 9CD laboratory for Clinical Molecular MR imaging (MOLIMA), Vienna, Austria
Synopsis
Knee articular cartilage thickness may potentially serve as a marker for monitoring of the knee cartilage status. However, it is challenging to measure and quantify the articular cartilage thickness using in vivo MRI. In the present study, we evaluated 6 unpaired lower extremies of body donors using both a prototype segmentation software and a semi-automatic approach. Our results showed a low correlation (r = 0.45) between the two methods, indicating the challenge of determining cartilage thickness from MR images.
Introduction
The thickness of knee articular cartilage can be used to study and track the development of osteoarthritis. Early detection and prevention of osteoarthritis are of great importance in this context1,2. Magnetic resonance imaging (MRI) allows early detection and long-term monitoring of cartilage changes. These changes can be quantified noninvasively with MRI, helping us to better understand osteoarthritis3,4,5. One of the analyses of cartilage morphology is the measurement of cartilage thickness, which can provide important insights into the morphological changes. However, measuring of cartilage thickness varies greatly from one patient group to another and is difficult to detect5,6. The aim of this study was to compare the differences in the measurement of cartilage thickness of the knee joint using two (automatic and semi-automatic) approaches.Methods
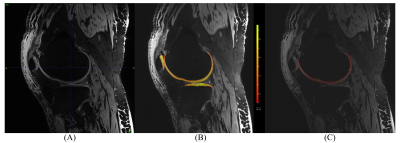
Six unpaired knees from lower extremities of cadavers were scanned at 7T MRI (Siemens Terra DotPlus) using a 28-channel knee coil. To acquire high-resolution morphological images, the 3-dimensional double echo steady state (3D-DESS) sequence was used with the following parameters: resolution = 0.5x0.5x0.5 mm, TR/TE = 8.68/2.55 ms, FA = 18°, 224 slices with TA 3:56 minutes. The femoral knee cartilage was assessed by the radiologists using the modified Outerbridge classification7. The automatic segmentation was performed using the MR Chondral Health (version 2.1 Siemens Healthcare, Erlangen, Germany) and semi-automatic segmentation of total of 887 images was conducted using the MATLAB (version 2020b MathWorks Inc., Natick, MA, USA) and MATLAB-based Mokkula software developed by Evelina Lammentausta (licensed by University of Oulu, Finland), see examples in Figure 1. Cartilage thickness was calculated from semi-automatically segmented bone-cartilage interface and cartilage surface using the field lines (FL) method8,9. The femoral knee cartilage assessment was conducted in 9 anatomical regions: femoral medial anterior (MaF)/central (McF)/posterior (MpF); trochlear lateral (TL)/central (TC)/medial (TM) and lateral anterior (LaF)/central (LcF)/posterior (LpF). To evaluate the agreement between semi-automated and automatic measurement of femoral cartilage thickness, correlation and Bland-Altman analysis were performed. Mean and standard deviation values were calculated for all sub-regions of femoral cartilage.Results
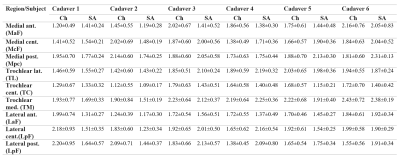
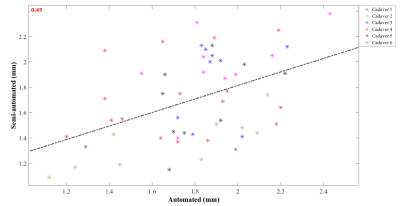
Table 1 illustrates the resulting values achieved by both measurements of articular knee cartilage thickness, semi-automated using the FL method and automatic achieved by MR Chondral Health. The Outerbridge grading performed by experts shows mostly 0 grade in all subregions except the cadaver 1 (McF, MpF = 1), cadaver 3 (MaF, McF, TM, LcF = 1), cadaver 5 (MaF, McF = 2), and cadaver 6 (McF, TL, LcF, LpF = 1). Cartilage thickness measurements showed low correlation (r = 0.45) between automatic and semi-automated approach (see Figure 1). Bland-Altman analysis illustrated mean difference of 0.09 mm for articular cartilage determined semi-automatically and automatically.Discussion and Conclusion
In this study, a comparison of two different methods for femoral articular cartilage thickness measurement was performed. This study was conducted to analyze the differences between prototype software MR Chondral Health and the semi-automated approach. The results show a low correlation (r = 0.45) between these two approaches. The automated software resulted in slightly higher cartilage thickness (i.e., by 0.09 mm). However, the relatively broad agreement interval also observed from the Bland-Altman analysis most likely illustrates the inaccuracies inherent to semi-automated segmentation. The correlation may be considerably affected by intra- and inter- observer reliability, which is an obvious limitation of the proposed study10,11. Moreover, the method used for cartilage thickness computation may significantly affect the resulting thickness distribution, as was discussed by Maier et al8. Additionally, there is no gold standard or ground truth for cartilage thickness which makes the comparison of different techniques very challenging. In order to draw a definitive conclusion, additional clinical information on articular cartilage condition is needed, such as physical measurement of knee articular cartilage. The above mentioned deficiencies and limitations will be further investigated in our institutions.Acknowledgements
This study was supported by the Austrian Science Fund, KLI 917. The financial support by the Austrian Federal Ministry for Digital and Economic Affairs, Austrian Agency for International Cooperation in Education and Research (OeAD- GmbH), Mobility Programmes, Bilateral and Multilateral Cooperation (MPC), and the National Foundation for Research, Technology and Development is gratefully acknowledged.References
1. Si, L., Xuan, K., Zhong, J., Huo, J., Xing, Y., Geng, J., ... & Yao, W. (2021). Knee Cartilage Thickness Differs Alongside Ages: A 3-T Magnetic Resonance Research Upon 2,481 Subjects via Deep Learning. Frontiers in medicine, 7, 1157.
2. Wisser, A., Lapper, A., Roemer, F., Fuerst, D., Maschek, S., Wirth, W., ... & Eckstein, F. (2020). Longitudinal change in knee cartilage thickness and function in subjects with and without MRI-diagnosed cartilage damage. Cartilage.
3. Wang, Y., Wluka, A. E., Jones, G., Ding, C., & Cicuttini, F. M. (2012). Use magnetic resonance imaging to assess articular cartilage. Therapeutic advances in musculoskeletal disease, 4(2), 77-97.
4. Hayashi, D., Roemer, F. W., & Guermazi, A. (2019). Magnetic resonance imaging assessment of knee osteoarthritis: current and developing new concepts and techniques. Clin Exp Rheumatol, 37(120), S88-S95.
5. Eckstein, F., Cicuttini, F., Raynauld, J. P., Waterton, J. C., & Peterfy, C. (2006). Magnetic resonance imaging (MRI) of articular cartilage in knee osteoarthritis (OA): morphological assessment. Osteoarthritis and cartilage, 14, 46-75.
6. Shah, R. F., Martinez, A. M., Pedoia, V., Majumdar, S., Vail, T. P., & Bini, S. A. (2019). Variation in the thickness of knee cartilage. The use of a novel machine learning algorithm for cartilage segmentation of magnetic resonance images. The Journal of arthroplasty, 34(10), 2210-2215.
7. Potter, H. G., Linklater, J. M., Allen, A. A., Hannafin, J. A., & Haas, S. B. (1998). Magnetic resonance imaging of articular cartilage in the knee. An evaluation with use of fast-spin-echo imaging. JBJS, 80(9), 1276-1284.
8. Maier, J., Black, M., Bonaretti, S., Bier, B., Eskofier, B., Choi, J. H., ... & Maier, A. (2017). Comparison of different approaches for measuring tibial cartilage thickness. Journal of integrative bioinformatics, 14(2).
9. Cao, Q., Thawait, G., Gang, G. J., Zbijewski, W., Reigel, T., Brown, T., ... & Siewerdsen, J. H. (2015). Characterization of 3D joint space morphology using an electrostatic model (with application to osteoarthritis). Physics in Medicine & Biology, 60(3), 947.
10. Kshirsagar, A. A., Watson, P. J., Tyler, J. A., & Hall, L. D. (1998). Measurement of localized cartilage volume and thickness of human knee joints by computer analysis of three-dimensional magnetic resonance images. Investigative radiology, 33(5), 289-299.
11. Bae, K. T., Shim, H., Tao, C., Chang, S., Wang, J. H., Boudreau, R., & Kwoh, C. K. (2009). Intra-and inter-observer reproducibility of volume measurement of knee cartilage segmented from the OAI MR image set using a novel semi-automated segmentation method. Osteoarthritis and Cartilage, 17(12), 1589-1597.
Figures


Table 1 Results values (mean±SD) of cartilage thickness achieved by MR Chondral Health (Ch) and semi-automated (SA) approach in all sub-regions.

Figure 2 Correlation plot showing the relationship between cartilage thickness measured by semi-automated approach and cartilage thickness determined by MR Chondral Health for all cadavers and sub-regions.

Figure 3 Bland-Altman plot between cartilage thickness measured by semi-automated approach and cartilage thickness determined by MR Chondral Health for all cadavers and sub-regions.