1492
Changes in Tibial Articular Cartilage T2 Relaxation Time with Load – An in vivo Repeatability Study1Department of Mechanical Engineering, University of Saskatchewan, Saskatoon, SK, Canada, 2Department of Biomedical Engineering, University of Saskatchewan, Saskatoon, SK, Canada, 3Department of Mechanical and Biomedical Engineering, University of Saskatchewan, Saskatoon, SK, Canada
Synopsis
Tibial articular cartilage plays the important role of transmitting forces through the knee joint; however, we most often study it without any applied loads. The aim of this work was to assess the repeatability of T2 relaxation time maps in the unloaded and loaded knees of five healthy participants. Using qDESS, it is possible to obtain repeatable, in vivo T2 relaxation time maps of the entire tibial cartilage surface as well as inside and outside regions of tibiofemoral contact in both unloaded and loaded knees.
Introduction
Currently most MRI scans of the knee are taken in the unloaded, relaxed position. This position is effective for keeping noise low, for avoiding motion artifacts, and for the comfort of participants, but it does not accurately mimic the loads experienced by the knee during activities of daily living. T2 relaxation time mapping has proven useful for studying knee joint articular cartilage in healthy and diseased states because it reflects the water content and collagen organization of the tissue1,2. It has also been shown to decrease in tibial cartilage with load in vivo3. The purpose of this study was to determine the repeatability of tibial cartilage T2 relaxation times inside and outside tibiofemoral contact areas of loaded knee joints.Methods
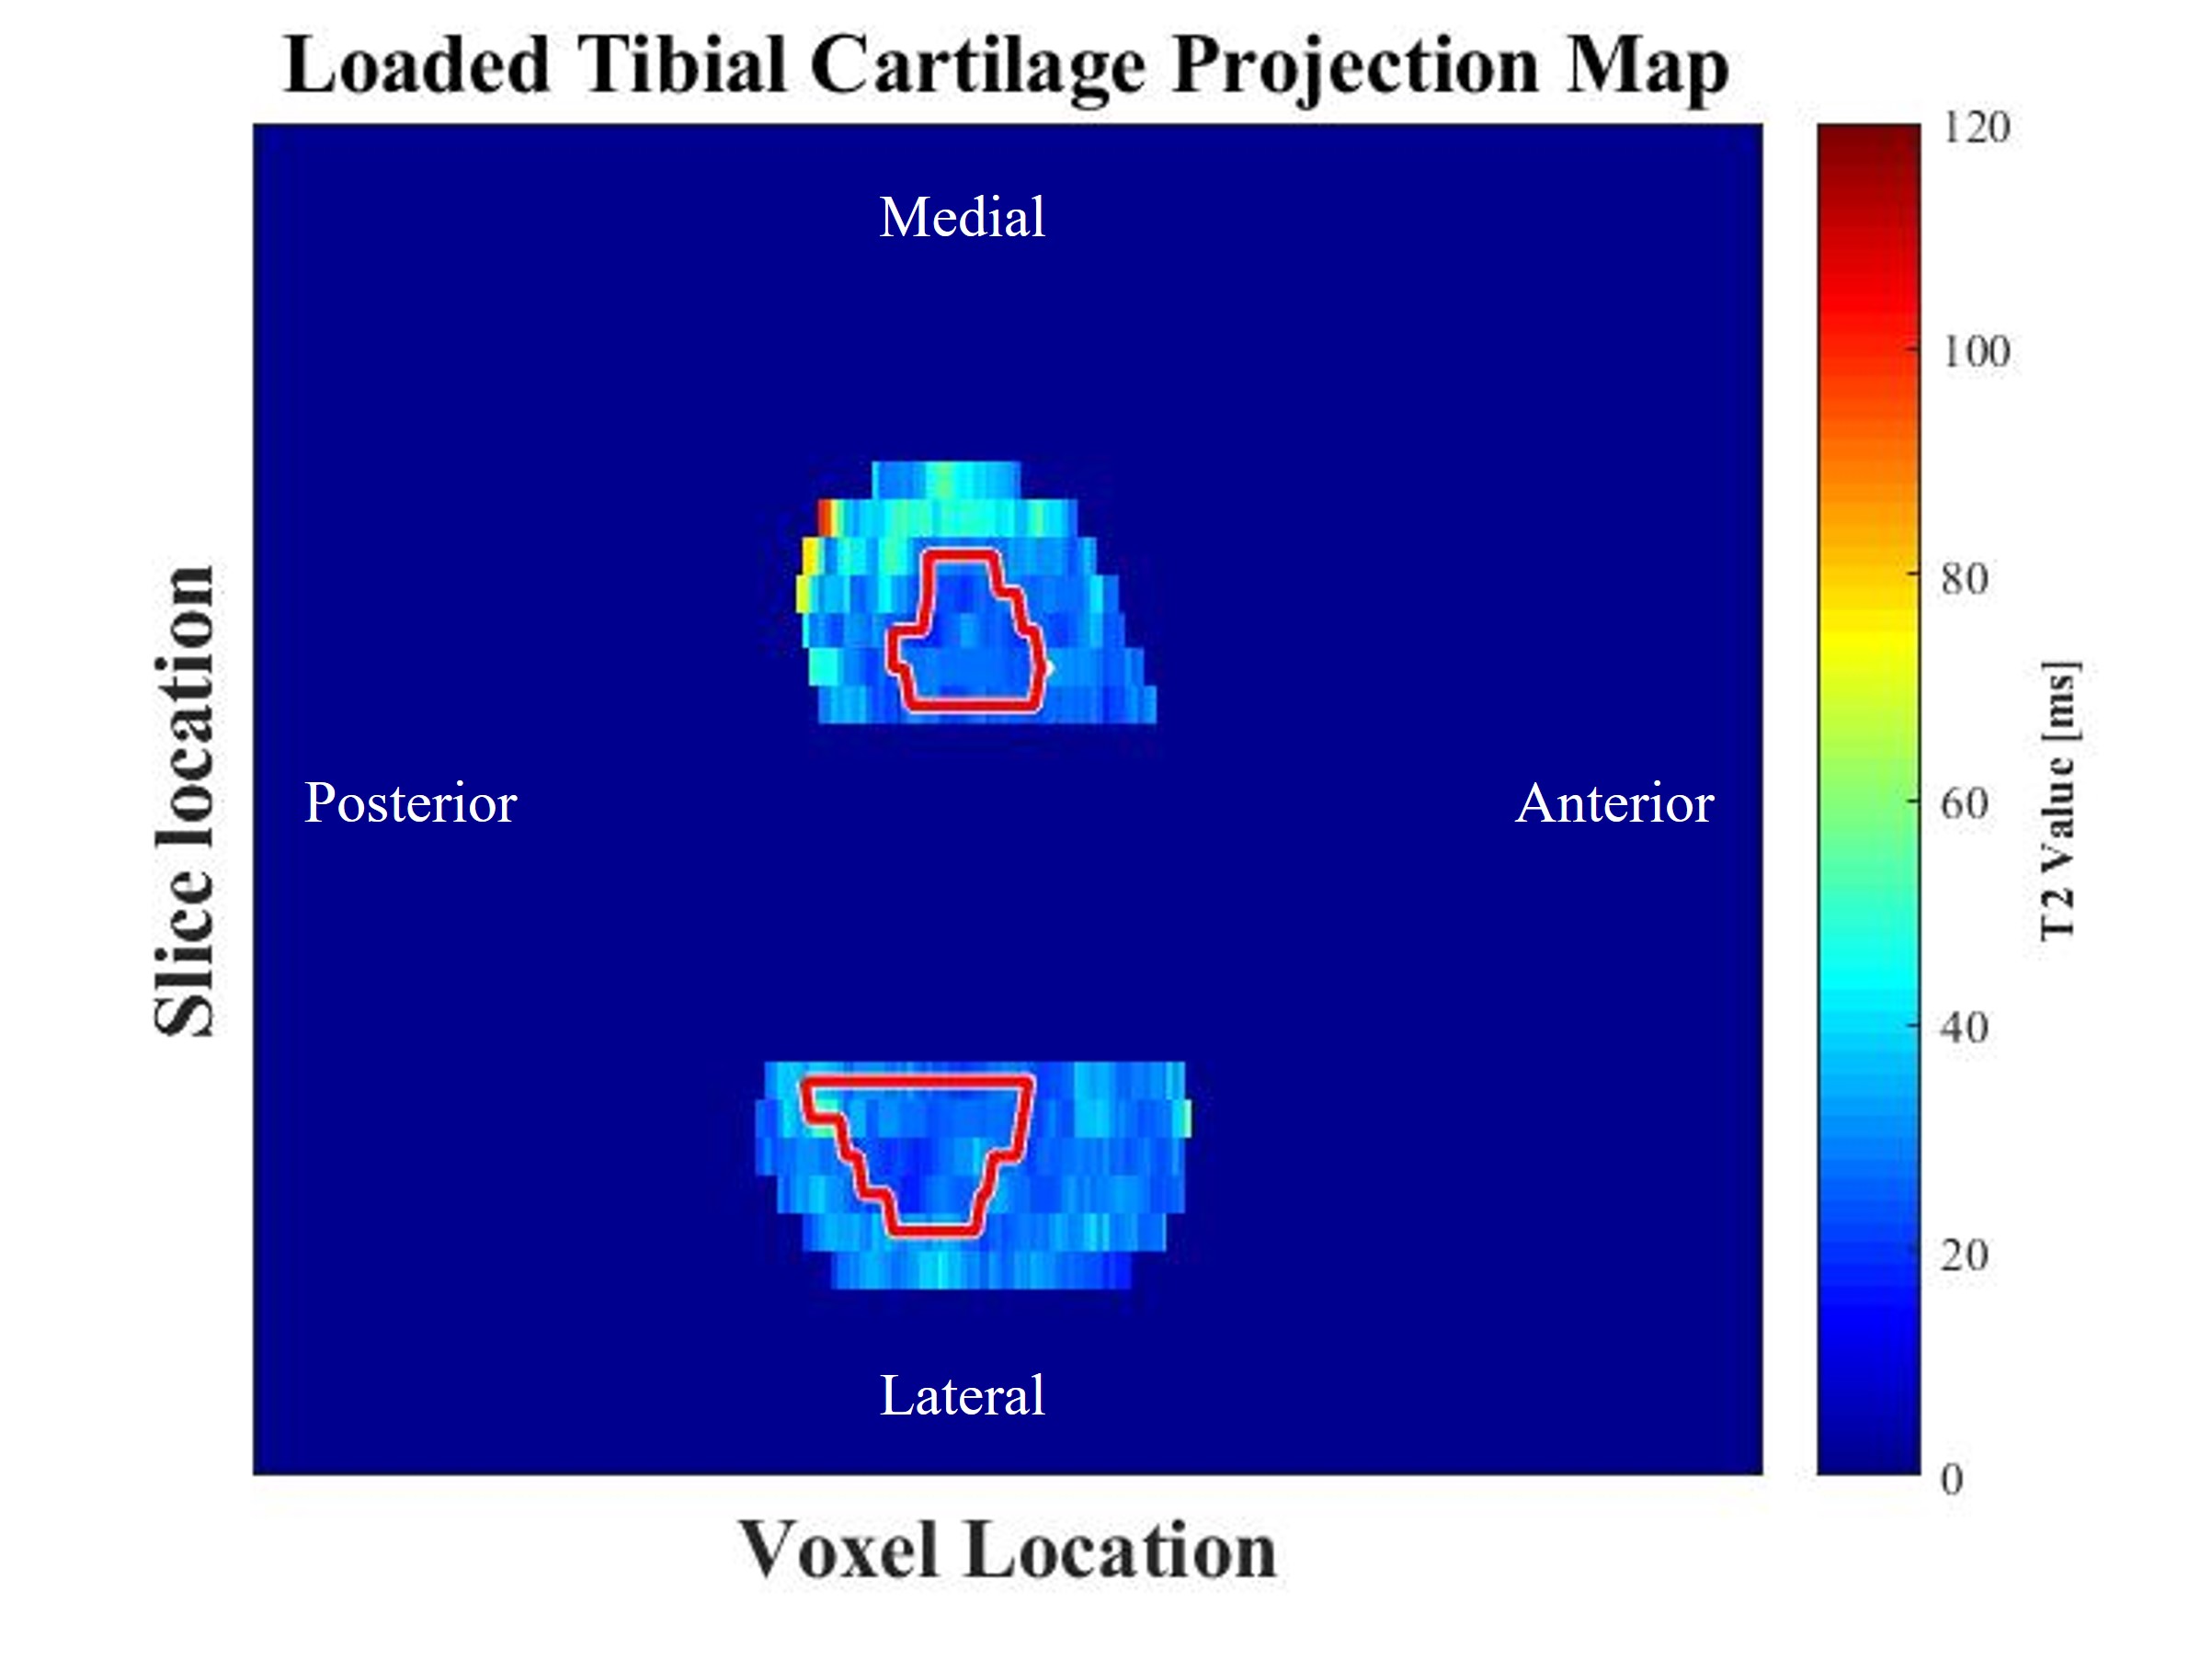
Five healthy participants (22.8±2.5yrs, with no history of knee injury, pain, surgery, or musculoskeletal disease) were scanned using an in-house quantitative Double Echo at Steady State (qDESS) sequence on a 3T MRI scanner ((MAGNETOM Skyra, Siemens Healthineers, Erlangen, Germany)) in two knee positions (loaded and unloaded), on three different days within a one-week period. The imaging parameters were TR/TE1/TE2 = 22ms/6ms/38ms, matrix size = 256 x 256, field of view = 160 mm, sliced thickness = 3mm, flip angle = 25 degrees, scan time = 3:22 minutes. Unloaded scans were acquired in a relaxed and extended knee position. Loaded scans were acquired with the participant’s foot placed in an MRI-safe loading rig that applied a resultant tibiofemoral joint reaction of approximately 20% of the participant’s body weight; the knees were in a flexed position for the loaded scan. To repeat the loaded position on subsequent test days, markings were placed at the tibiofemoral joint centre and along the shafts of the tibia and femur with permanent marker; a goniometer was used to measure the angle on day one and the participant was repositioned at this angle on days two and three. The tibial cartilage and tibiofemoral cartilage-cartilage contact area were manually segmented from the images using packaged software (Analyze 14.0, AnalyzeDirect, Overland Park, USA). T2 relaxation time maps were created from the qDESS scans using an extended phase graph (EPG) lookup table approach4. The T2 maps of the segmented tibial cartilage were projected onto the bone-cartilage interface normal to its surface using in-house, custom software (Matlab, The Mathworks, Natick, USA). The mean and standard deviation of the T2 values was calculated for the whole, medial, and lateral tibial cartilage plate in each position. Next, the contact area was overlaid on the projection maps (Figure 1). The mean and standard deviation of T2 values inside and outside of the contact area were calculated for the whole, medial, and lateral tibial cartilage plate in each knee in each position. Repeatability was described as the root mean square standard deviation (SDrms) and the root mean square percentage coefficient of variation (CV% rms) over the three trials for each plate, inside and outside of the contact area.Results
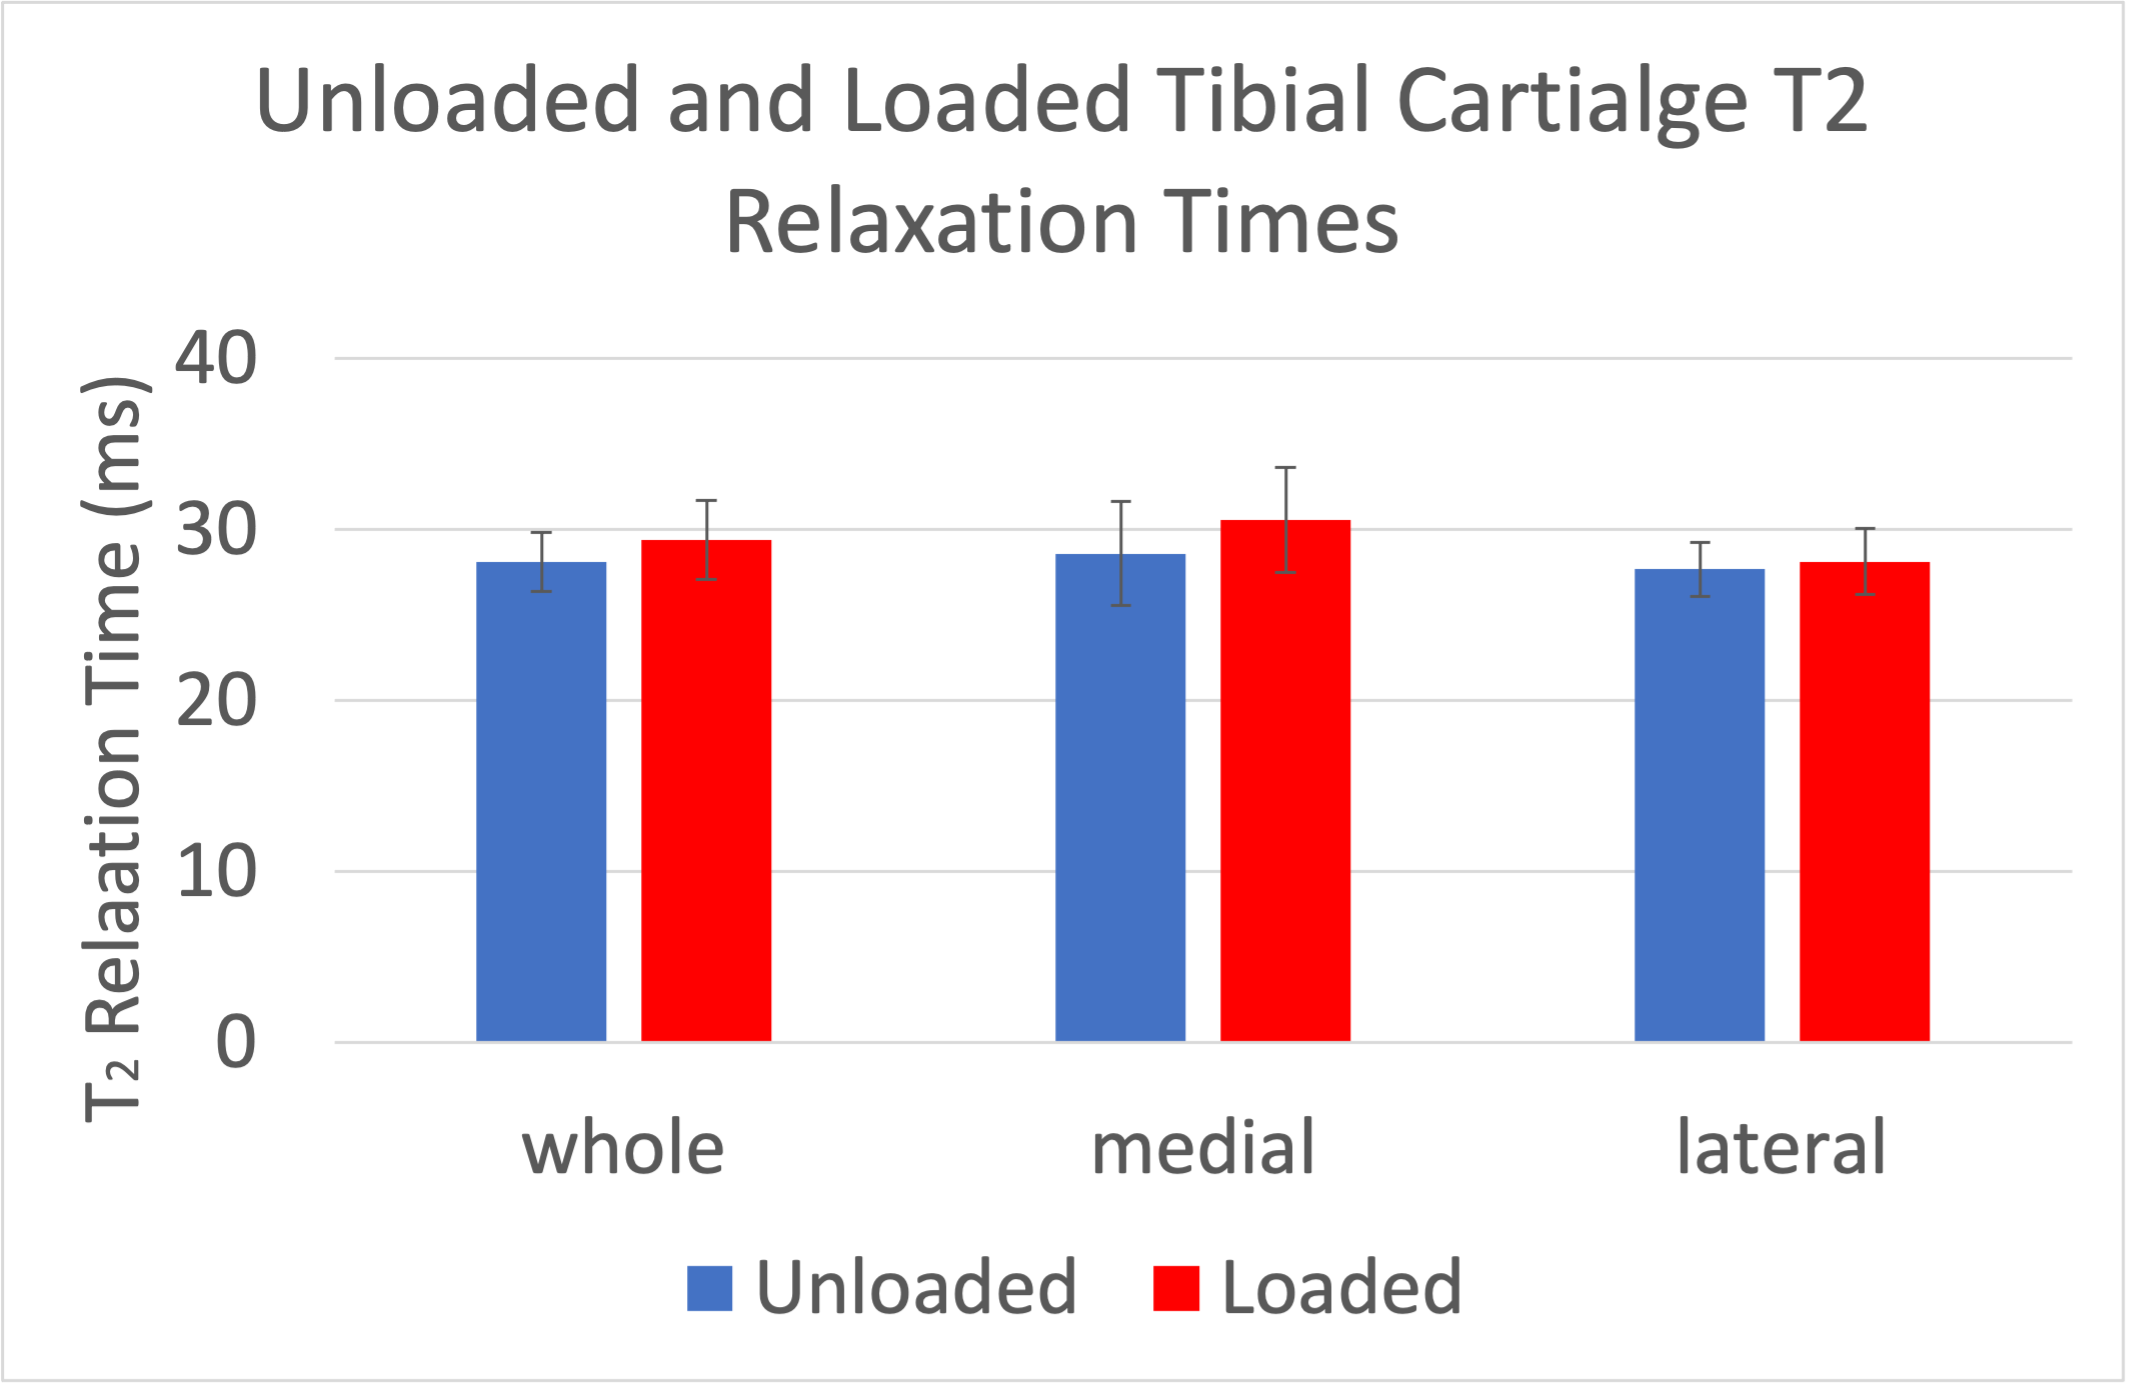
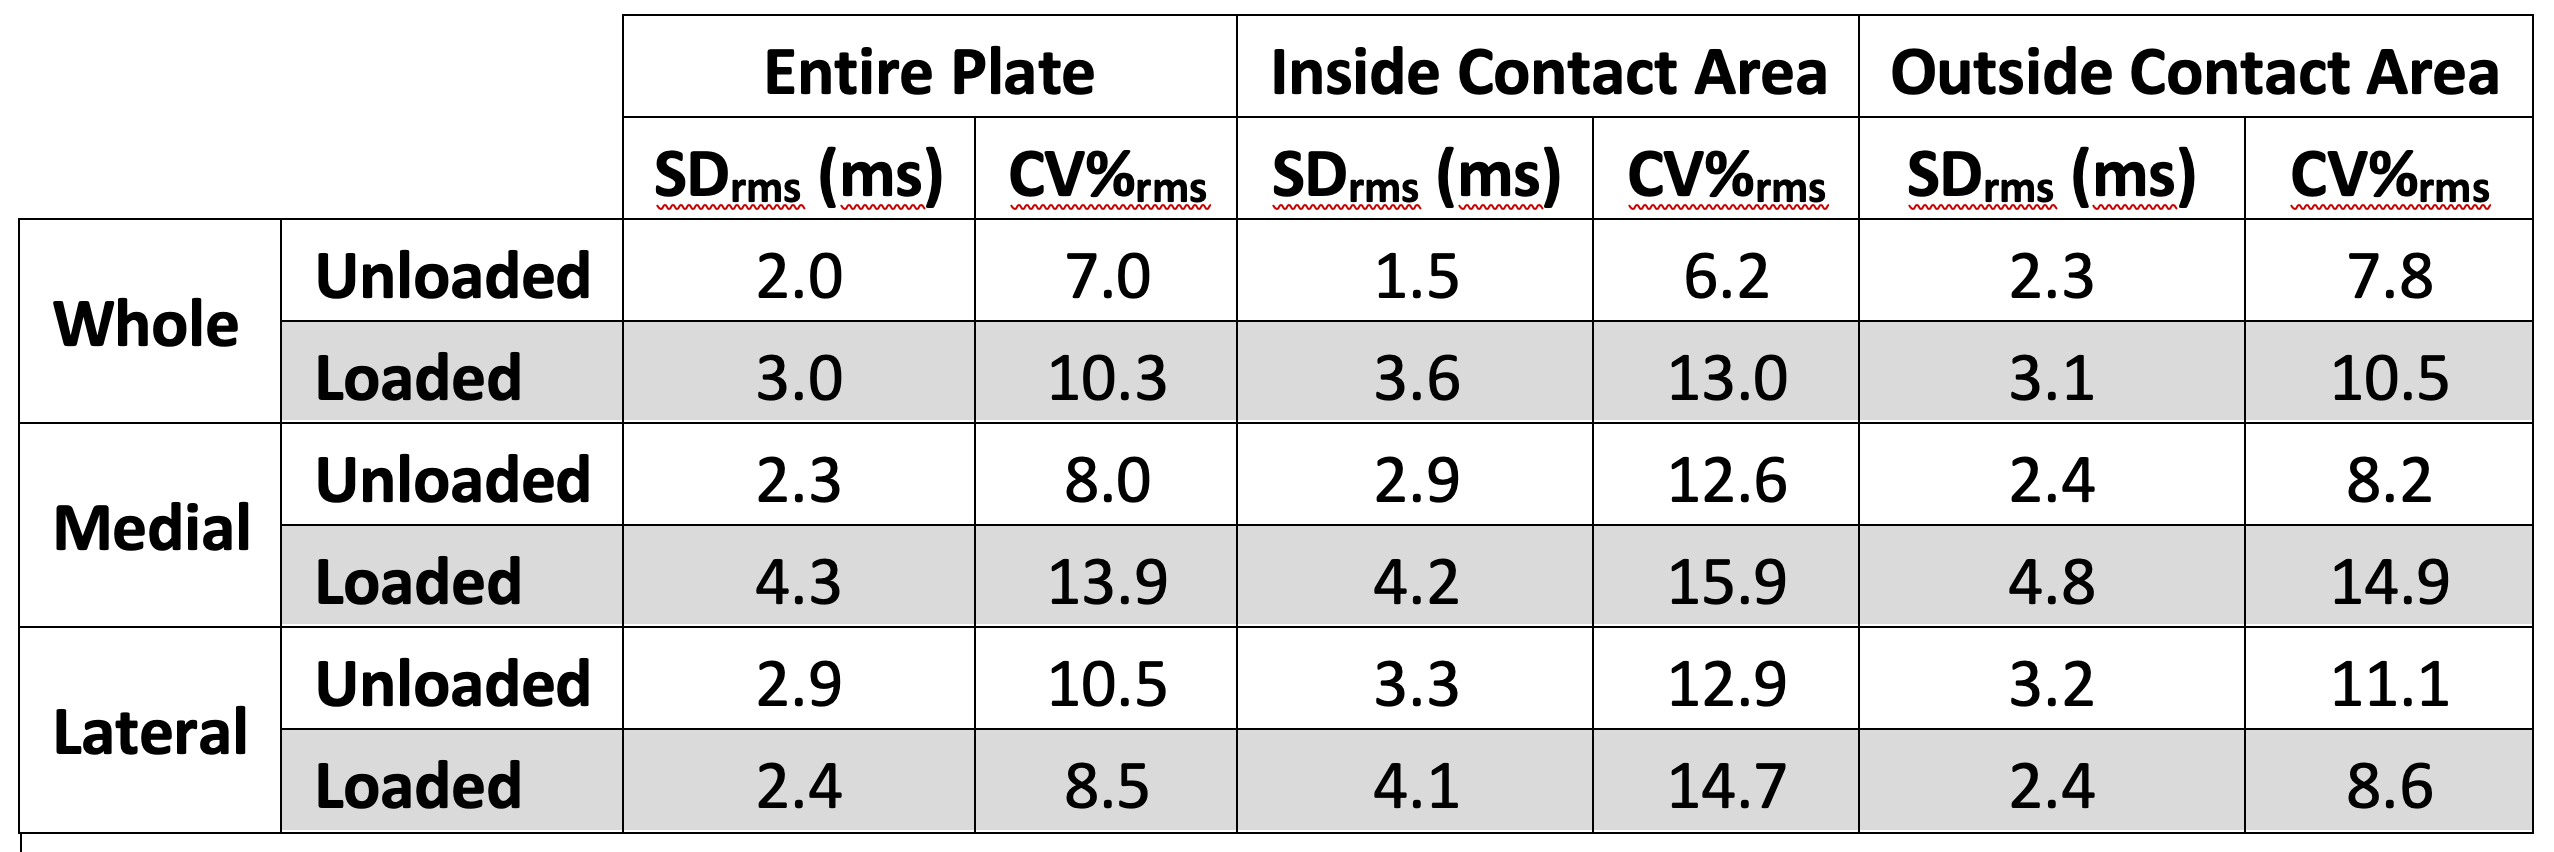
The mean and standard deviation of the T2 relaxation times were slightly higher in the loaded knees than the unloaded knees, but were within the standard deviation of the measurements (Figure 2). The SDrms and the CV%rms were higher for the loaded condition as compared to the unloaded condition (Table 1). For the unloaded knees, the SDrms ranged from 1.5-3.3 ms and the CV%rms ranged from 6.2 to 12.9 %. For the loaded knees, the SDrms ranged from 2.4 to 4.8 ms and the CV%rms ranged from 8.5 to 15.9 %.Discussion
The mean and standard deviation values for the unloaded and loaded knees show that there is limited change in T2 relaxation time with a 20% bodyweight load when a global cartilage plate analysis is used. It is likely that higher loads are required or that the tissue must be damaged to observe the types of changes in T2 relaxation time that have been observed previously at 50% bodyweight load and in osteoarthritis patients3. Texture or focal analyses might capture change related to map heterogeneity5,6. The SDrms and the CV%rms show reasonable repeatability over the week of data acquisition which is similar to previous studies using qDESS7. Loaded scans were generally less repeatable. This may be because the knee was off isocentre for the flexed, loaded scans, likely leading to more noise in the data.Conclusions
The qDESS approach for T2 relaxation time mapping provides repeatable data both inside and outside the contact area for unloaded and loaded scans; however, 20% bodyweight load may not be sufficient to observe global differences in tibial cartilage T2 relaxation time with load.Acknowledgements
Funding provided by Siemens Healthcare (McWalter E.J., Cui L.), NSERC Discovery Grant, Mitacs, and The Arthritis Society.References
1. Raya JG, Ferizi U, Ruiz A, Abramson SB, Bencardino J, Krasnokutsky Samuels S. Changes in collagen and proteoglycan in cartilage with OA severity. ISMRM. 2017;5087.
2. Nieminen MT, Rieppo J, Töyräs J, Hakumäki JM, Silvennoinen J, Hyttinen MM, Helminen HJ, Jurvelin JS. T2 relaxation reveals spatial collagen architecture in articular cartilage: a comparative quantitative MRI and polarized light microscopic study. Magn Reson Med. 2001;46(3):487-493.
3. Subburaj K, Souza RB, Stehling C, Wyman BT, Le Graverand-Gastineau MP, Link TM, Li X, Majumdar S. Association of MR relaxation and cartilage deformation in knee osteoarthritis. J Orthop Res. 2012;30(6):919-926.
4. Staroswiecki E, Granlund KL, Alley MT, Gold GE, Hargreaves BA. Simultaneous estimation of T(2) and apparent diffusion coefficient in human articular cartilage in vivo with a modified three-dimensional double echo steady state (DESS) sequence at 3 T. Magn Reson Med. 2012;67(4):1086-1096.
5. Joseph GB, Baum T, Carballido-Gamio J, Nardo L, Virayavanich W, Alizai H, Lynch JA, McCulloch CE, Majumdar S, Link TM, Texture analysis of cartilage T2 maps: individuals with risk factors for OA have higher and more heterogeneous knee cartilage MR T2 compared to normal controls--data from the osteoarthritis initiative, Arthritis Res Ther 2011;13(5):R153.
6. Monu UD, Jordan CD, Samuelson BL, Hargreaves BA, Gold GE, McWalter EJ. Cluster analysis of quantitative MRI T2 and T1ρ relaxation times of cartilage identifies differences between healthy and ACL-injured individuals at 3T. Osteoarthr Cartil. 2017;25(4):513-520.
7. Jordan CD, McWalter EJ, Monu UD, Watkins RD, Chen W, Bangerter NK, Hargreaves BA, Gold GE, (2014). Variability of CubeQuant T-1 rho, quantitative DESS T-2, and cones sodium MRI in knee cartilage, Osteoarthritis and Cartilage, 2014;22(10):1559-1567.
Figures