1491
T1 and T2* mapping of sheep forelimb aponeuroses with high-resolution ultra-short echo time (UTE) imaging1Medical Physics Group, Institute of Diagnostic and Interventional Radiology, Jena University Hospital - Friedrich-Schiller-University, Jena, Germany, 2Institute of Diagnostic and Interventional Radiology, Jena University Hospital - Friedrich Schiller University, Jena, Germany, 3Institute of Zoology and Evolutionary Research with Phyletic Museum, Friedrich-Schiller-University, Jena, Germany, 4Michael Stifel Center for Data-driven and Simulation Science Jena, Friedrich Schiller University, Jena, Germany, 5Abbe School of Photonics, Friedrich Schiller University, Jena, Germany, 6Center of Medical Optics and Photonics, Friedrich Schiller University, Jena, Germany
Synopsis
Aponeuroses play a crucial role in the transmission of mechanical load in the muscle-tendon unit. Their contribution is, however, still under debate and they are difficult to image with MRI due to their short T2* decay. In this work, we use high-resolution 3D ultra-short echo time imaging with 50 echoes to investigate the T2* decay of the aponeurosis and build a three-component model to quantify the T2* values. Additionally, we quantified T1 using variable flip angle imaging. To our knowledge, this work is the first to report T1 and T2* values of the aponeurosis.
Introduction
Aponeuroses are intramuscular sheet-like elastic tissues that act as insertion sites for muscles1 and play an important role in muscle contraction2,3: By subjecting them to a bi-axial strain, they allow the transfer of load from muscle fibers to the tendons3,4. Although this phenomenon and the function of aponeuroses are not fully understood, they have been successfully imaged using ultra-short echo time (UTE) MRI sequences4,5.The use of UTE is necessary because aponeuroses, like tendon and ligaments, are composed of ordered collagen fibers that lead to rapid decay of the MR signal. Because the relaxation parameters values of aponeuroses have not been previously investigated, in this work we provide T1 and T2* quantification of ex-vivo ovine muscle, including the aponeuroses, and apply a tri-exponential model to isolate different T2* components.
Methods
Four forelimbs (regio brachialis) from healthy sheep were collected after euthanasia in compliance with the ethical guidelines of the local animal welfare authorities. The samples were transported in a non-frozen state in an airtight and refrigerated container and subsequently embedded in agar to preserve their biological properties and prevent desiccation. All MRI measurements were performed within 24h of sample collection.A 3D ultra-short echo time sequence6,7 and two flexible 8-channels coils (NORAS MRI products GmbH, Höchberg, Germany) were used for the measurements on a clinical 3 T whole-body MRI scanner (Magnetom PRISMA fit, Siemens Healthineers, Erlangen, Germany). To extract T2*, the signal decay was finely sampled with 50 echoes (TEs ranging from 0.1 ms to 10.3 ms) with echo train shifting, while T1 mapping was performed with a variable flip angle (VFA) approach (FAs=4°,6°,8°,10°,12°,14°,20°). Other acquisition parameters included resolution (0.5x0.5x1) mm3, repetition time (18 ms), and total acquisition time (4 hours).
As can be seen in Fig. 1, the signal from regions-of-interest (ROIs) drawn in the aponeurosis shows a normal T2decay or a strong oscillatory behaviour depending on the location of the ROI (hereafter: aponeurosis A and B). The oscillatory decay differs from the “simple” exponential decay of the other tissue species such as cortical bone or free tendons. Therefore, a three-component exponential fit was used to properly fit both the simple exponential decay of the other tissue species and the aponeurosis signal:
$$S(TE)=S_{bw}e^(-TE/(T_{2bw}^*))+S_{fw}e^(-TE/(T_{2fw}^*))+S_{cs}e^(-TE/(T_{2cs}^*))e^(-2iπΔf_{cs}TE)$$
The three components are a short component caused by bound water protons (Sbw), a longer “free water” (Sfw) component and the contribution of a chemically shifted component (Scs), possibly fat, collagen, or proteoglycans
Results
Figure 2 shows a T2* and T1 map from one of the measured samples. The aponeuroses are clearly visible on the T1 map where they are well separated from the muscle background. Averaged values of T2* and T1 are reported in Table 1 for ROIs in the aponeurosis, bone marrow, and cortical bone (see also Figure 1). Furthermore, the three-component exponential signal equation was used to properly fit the signal from the aponeurosis. The results of this quantification, in different regions-of-interest, are shown in Table 2. Aponeurosis A has a composition similar to tendons, with little to no contribution from the chemically shifted components, while Aponeurosis B has significant contributions from all three components, especially the chemically shifted species.Discussion and Conclusion
The use of a UTE sequence allows the quantification of T1 and T2* even in species with a very fast decay of the transverse relaxation parameter, such as the aponeurosis or cortical bone. For the latter, the obtained T2* are in line with current literature on the topic8,9. Furthermore, the proposed three-component model successfully manages to fit the oscillatory behaviour of some of the aponeurosis regions, indicating that a third component, which can be characterized by an off-resonance contribution, has to be considered. The origin of the different behaviour of the signal in the aponeurosis ROIs can only be speculated at present; it could be due to the presence of fat compartments or structural differences between different aponeurosis tissues. Further investigation is certainly needed to determine the cause of this phenomenon, possibly using histological or spectroscopic techniques.It is also interesting to note that the T2* of the aponeurosis, albeit short, is still longer than that of other short T2*species such as free tendons. This is likely due to the less orderly organisation of the collagen fibers in the aponeurosis, as aponeuroses must compensate for both lateral and longitudinal forces2,3. The T1 values are similar in both aponeurosis regions, and closely resemble T1 of free tendons10, which may be due to T1 being more robust to changes in direction of the collagen fibers. To our knowledge, this study is the first to report T1 and T2* values of aponeuroses and to investigate their oscillatory signal.
Acknowledgements
No acknowledgement found.References
1) Eng CM, Roberts TJ. Aponeurosis influences the relationship between muscle gearing and force. J Appl Physiol. 2018;125(2):513-519.
2) Raiteri B. Aponeurosis behaviour during muscular contraction: A narrative review, European Journal of Sport Science,2018;18:1128-1138
3) Azizi E, Roberts TJ. Biaxial strain and variable stiffness in aponeuroses. J Physiol. 2009; 1:4309-18.
4) Bird L, D’Souza A, Ball I, Rae C, Herbert RD, Bolsterlee B. Validity and reliability of measurements of aponeurosis dimensions from magnetic resonance images. Scand J Med Sci Sports. 2019;29: 808–815.
5) Du J, Bydder M, Takahashi AM, Carl M, Chung CB, Bydder GM. Short T2 contrast with three-dimensional ultrashort echo time imaging. Magn Reson Imaging. 2011;29(4):470-82.
6) Herrmann KH, Krämer M, Reichenbach JR. Time Efficient 3D Radial UTE Sampling with Fully Automatic Delay Compensation on a Clinical 3T MR Scanner. PLoS One. 2016;11(3):e0150371
7) Krämer M, Maggioni MB, Brisson NM, Zachow S, Teichgräber U, Duda GN, Reichenbach JR. T1 and T2*mapping of the human quadriceps and patellar tendons using ultra-short echo-time (UTE) imaging and bivariate relaxation parameter-based volumetric visualization. Magn Reson Imaging. 2019 Nov;63:29-36.
8) Techawiboonwong A, Song HK, Leonard MB, Wehrli FW. Cortical bone water: in vivo quantification with ultrashort echo-time MR imaging. Radiology. 2008;248(3):824-833.
9) Horch RA, Gochberg DF, Nyman JS, Does MD Non-invasive Predictors of Human Cortical Bone Mechanical Properties: T2-Discriminated 1H NMR Compared with High Resolution X-ray. PLoS One. 2011;6(1): e16359.
10) Krämer M, Kollert M, Brisson N, Maggioni M, Duda G, Reichenbach J, Immersion of Achilles tendon in phosphate‐buffered saline influences T1 and T2* relaxation times: An ex vivo study. NMR in Biomedicine. 2020 March; 33:20-27
Figures
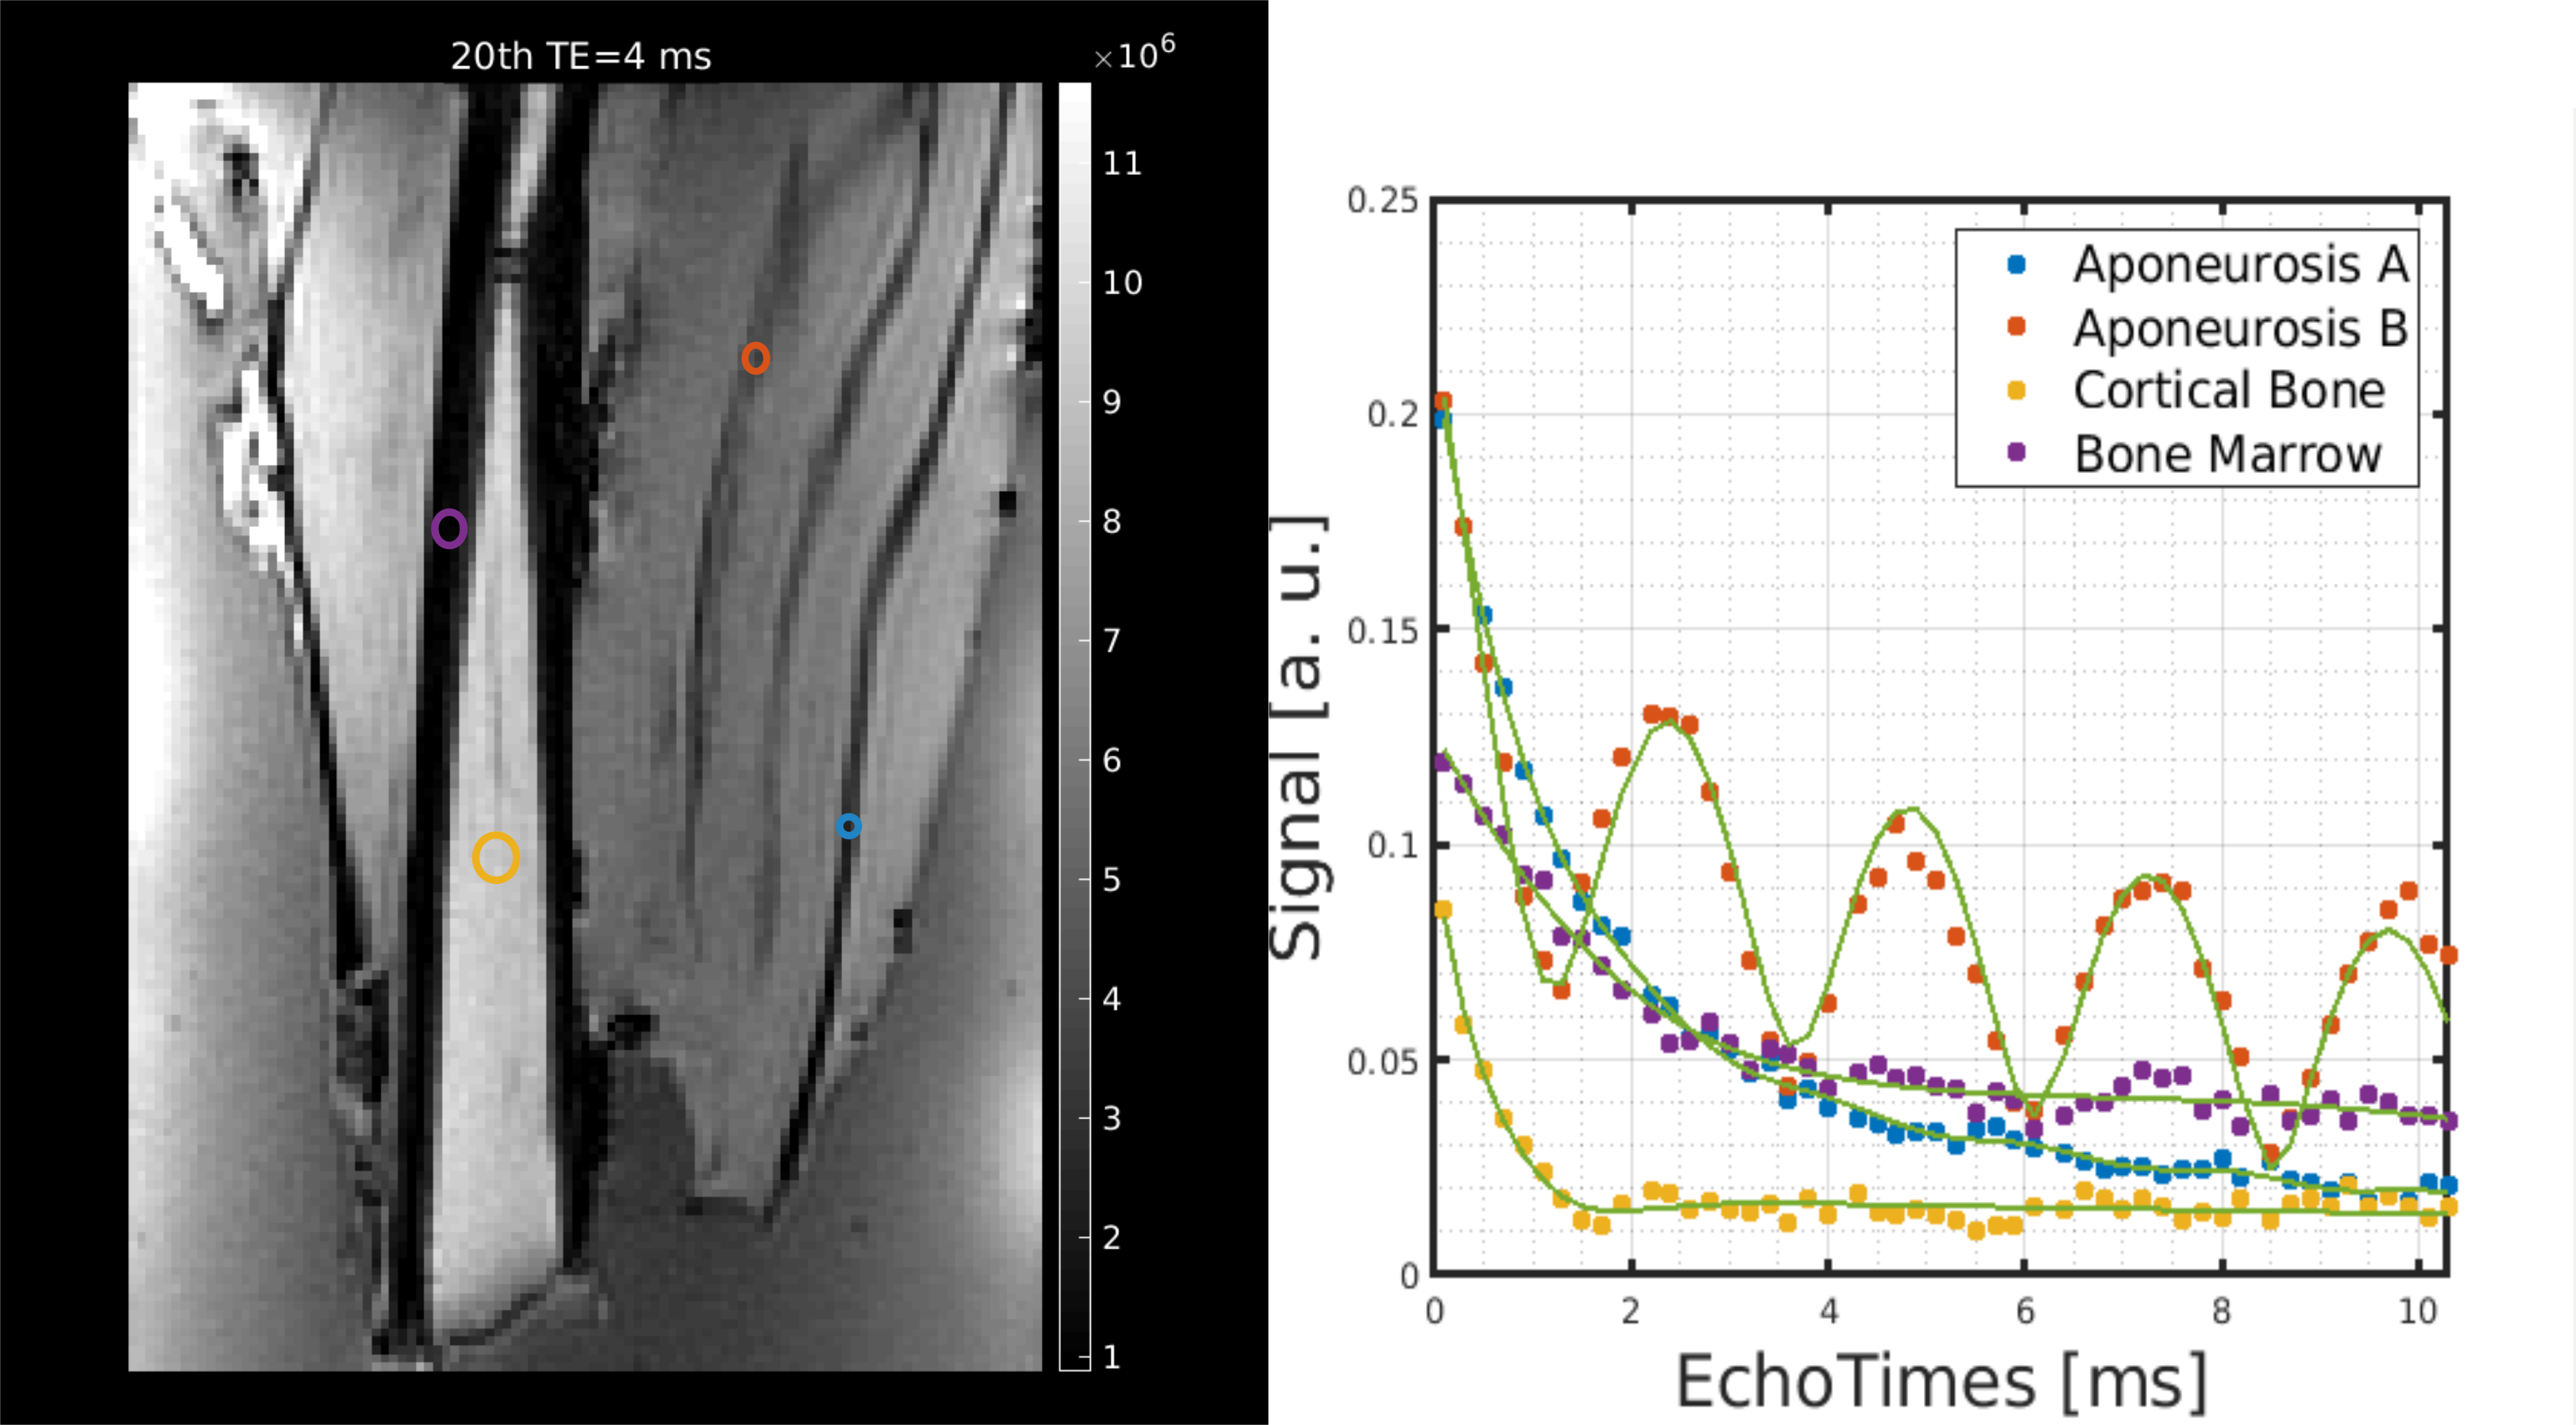
Figure 1: Shown on the left are the ROIs used to extract the signal curves seen in the plot on the right. The ROIs are overlaid on a magnitude image acquired with a TE of 4ms. The scatter plots represent the data points, while the green curves are the result of the fit with the proposed three-compartment method.
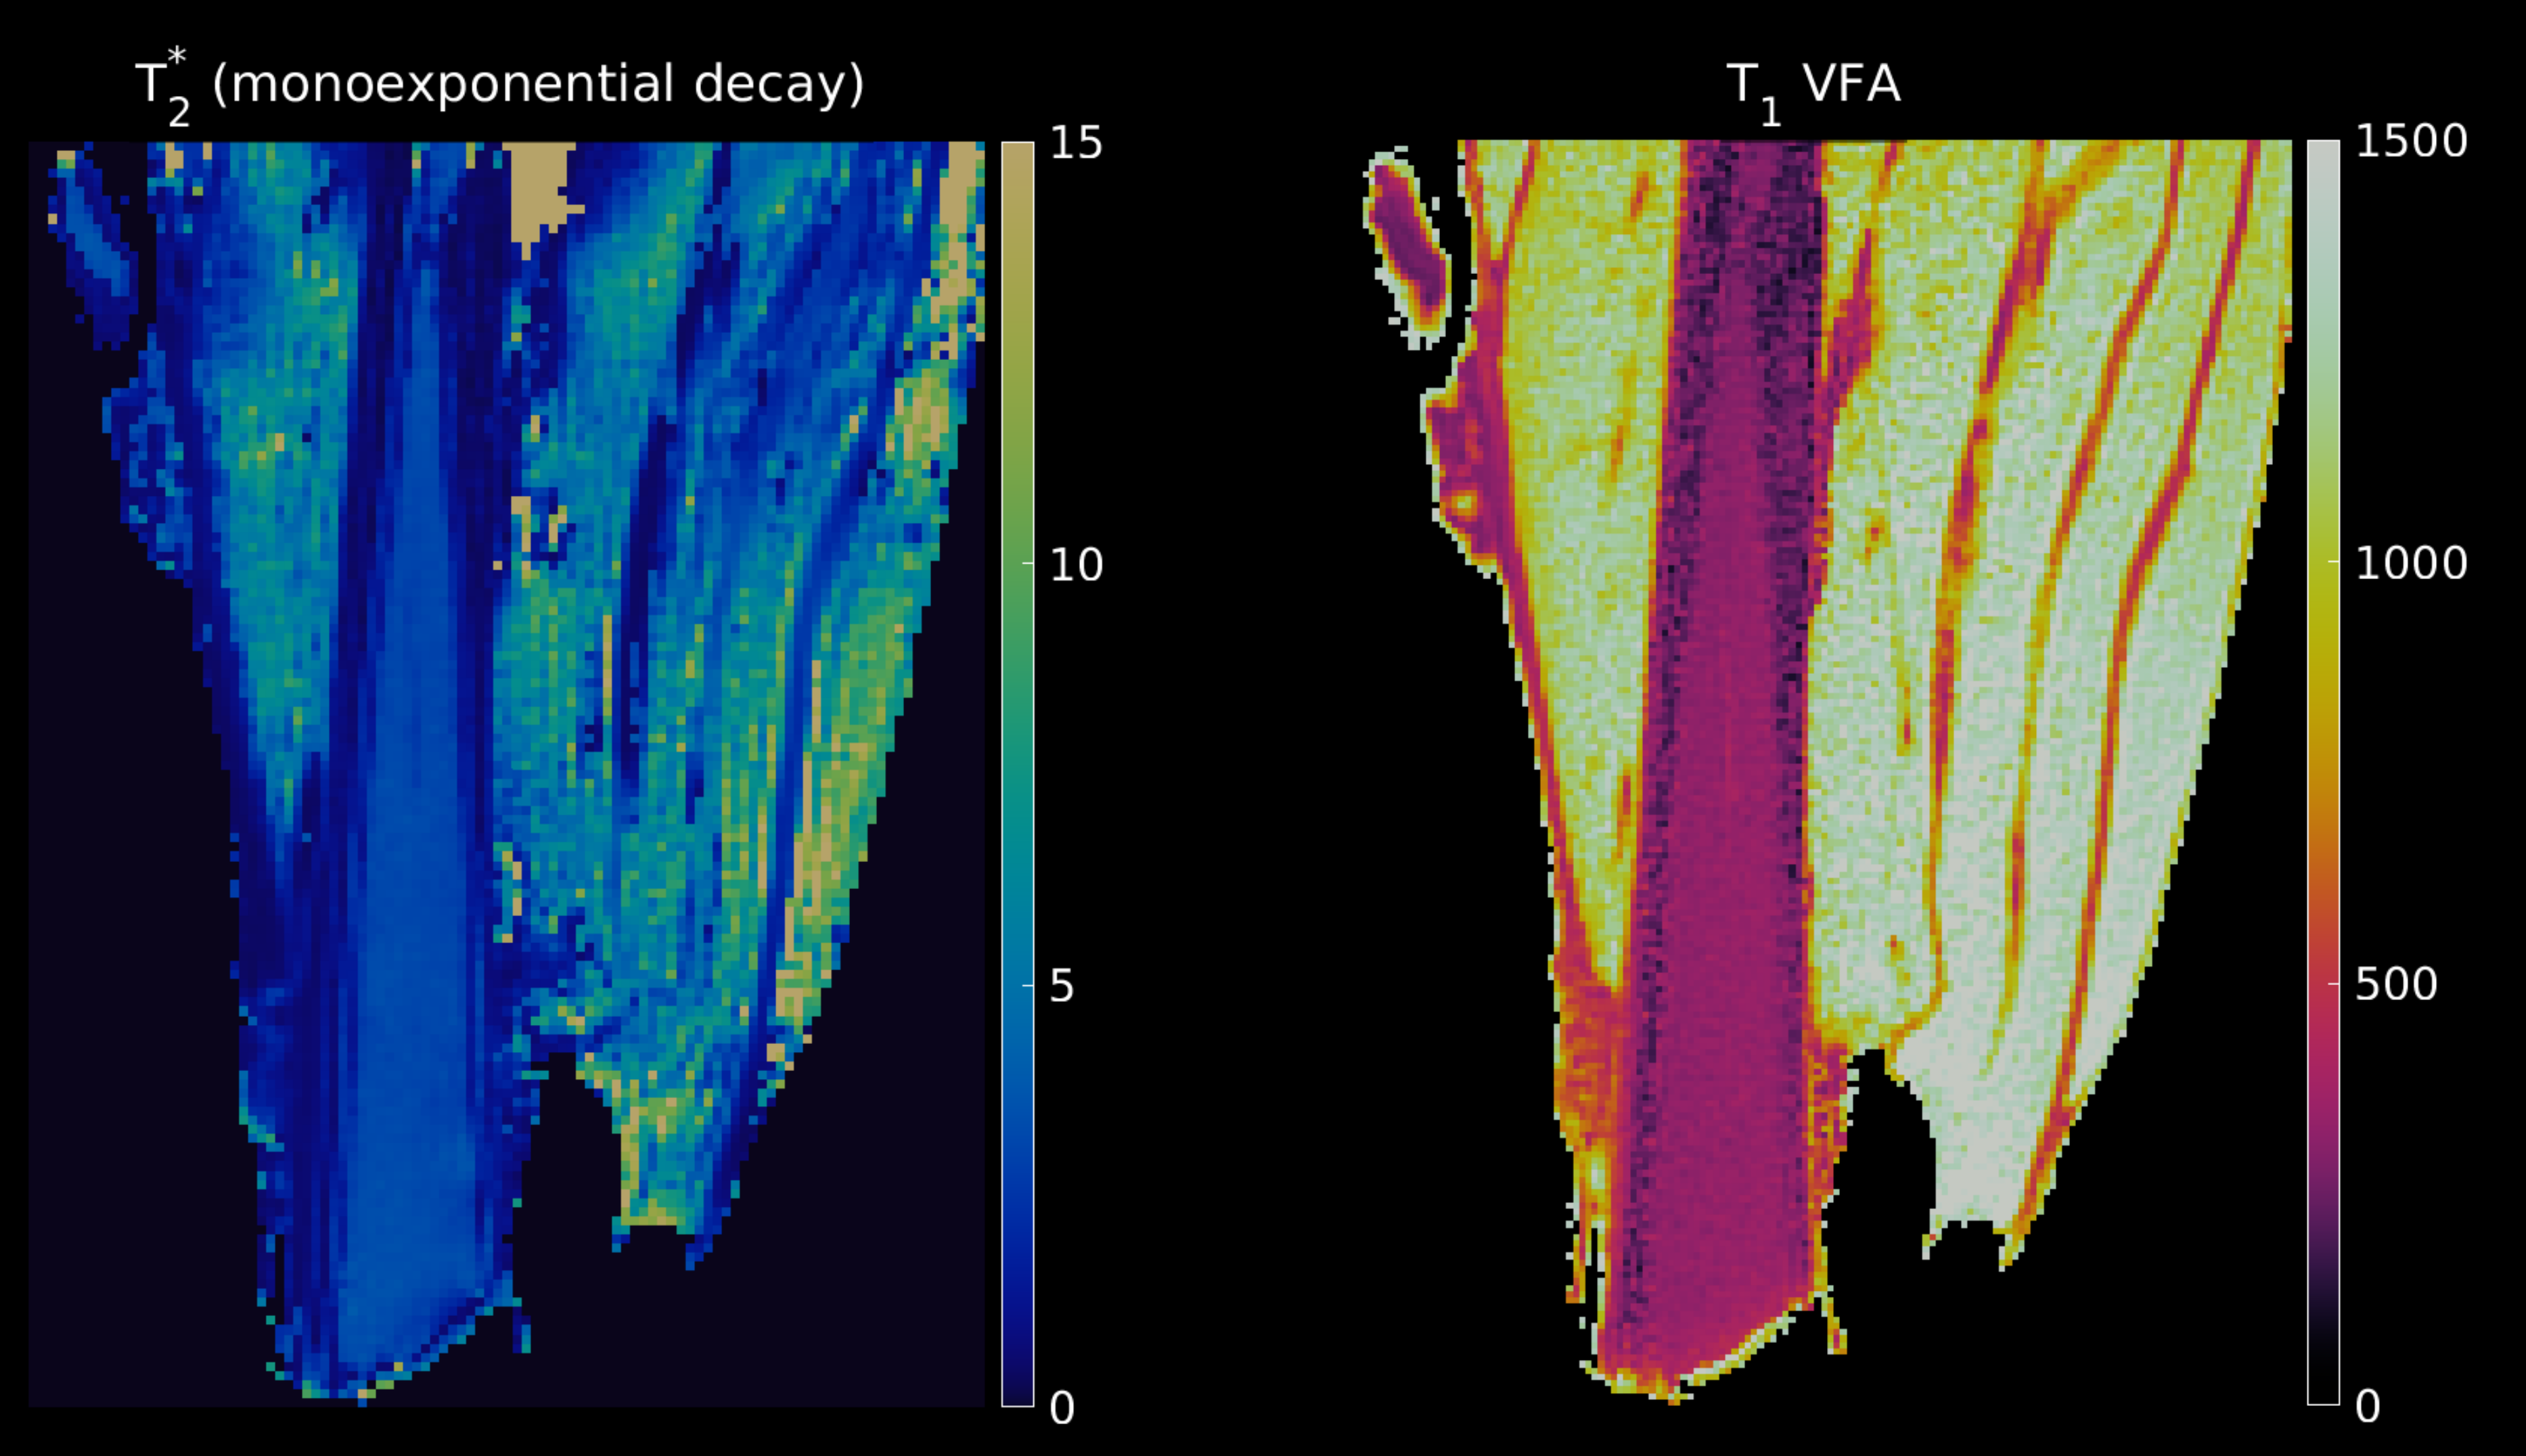
Figure 2: T2* map from mono-exponential fit (left) and T1 map (right) for a sheep muscle sample. The T2*map is scaled between 0 and 15 ms, while the T1 map is scaled between 0 and 1500 ms.
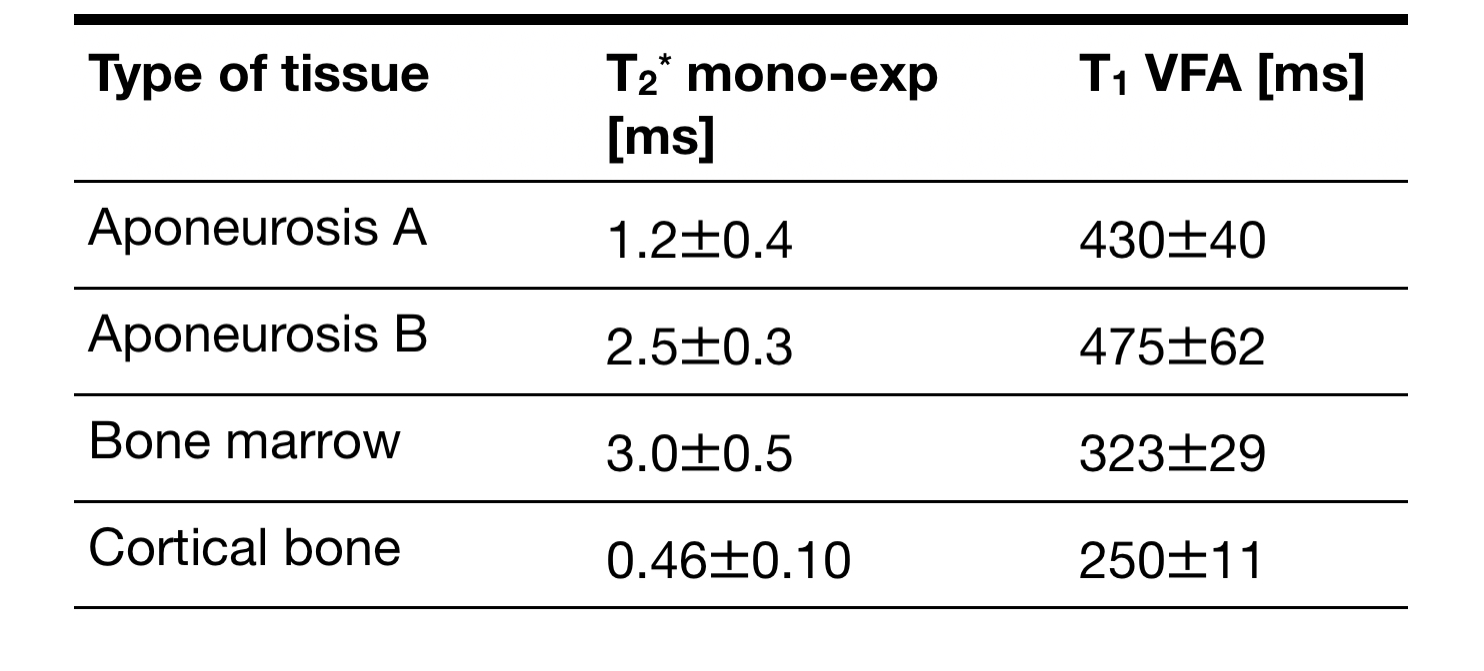
Table 1: Extracted T2* and T1 values for the ROIs shown in Figure 1. T2* values were extracted by applying a monoexponential fit, while T1 values were extracted from the VFA approach Values represent mean +/- standard deviation over the 4 samples analyzed.
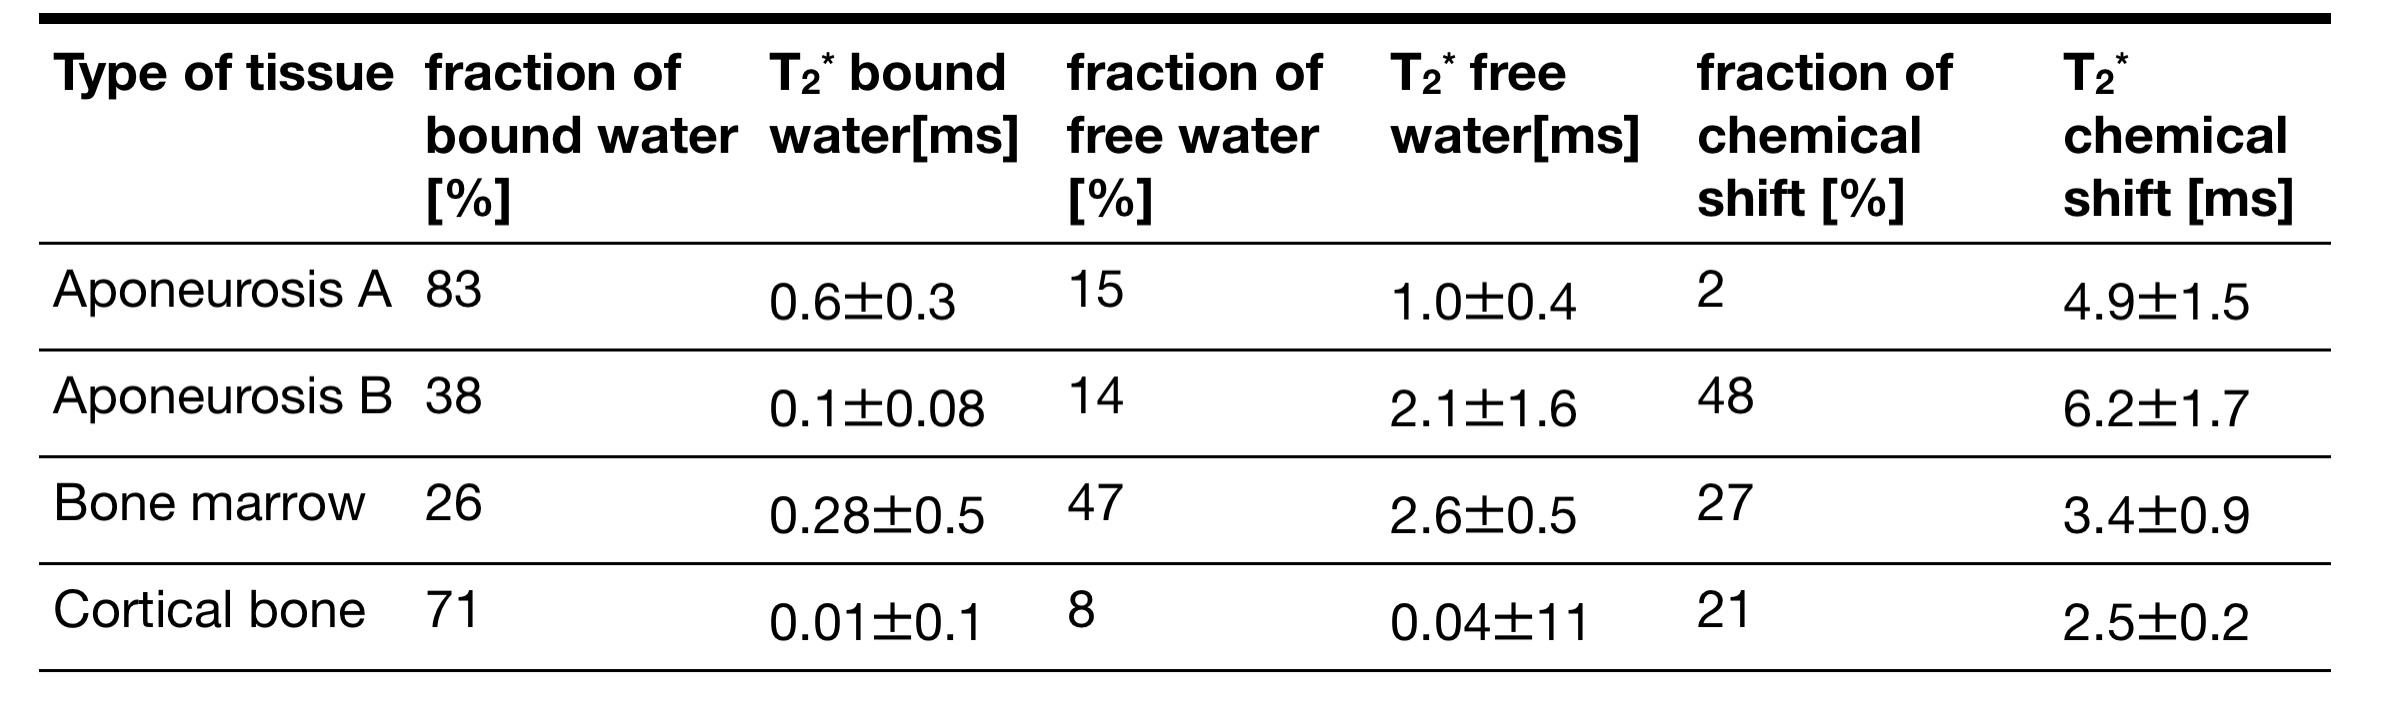
Table 2: Results of the extracted parameters from the 3-compartment model for the ROI-averaged signal decays (see Figure 1). Values represent mean +/- standard deviation over the 4 samples analyzed.