1489
Meniscal deformation MRI study using knee joint axial loading device and finite-element-model1Center for Biomedical Engineering, Indian Institute of Technology, Delhi, India, 2Mahajan Imaging Center, Delhi, India, 3Center for Biomedical Engineering, All India Institute of Medical Sciences, Delhi, India
Synopsis
The meniscal-extrusion may disturb the stability of the knee-joint, and depicts laxity in the meniscal-hoops. The degraded meniscal site usually show changes in the MR images (T1, T2, and Proton-Density-weighted images). However, the laxity of a specific meniscal segment and its effect on adjacent segment’s deformation is unknown. The current study attempt to address this problem using MRI data (with and without loading) and a finite-element-model. Each meniscal-hoop’s (lateral and medial) lengths, thickness, and meniscus-extrusion was measured to evaluate load-bearing changes. Medial meniscus hoop’s Anterior-meniscal-length(ML), Posterior-ML, Central-ML, and meniscus-extrusion show substantial change(>5%) during load.
INTRODUCTION
Meniscal-degradation may hamper the knee-joint stability or lead to osteoarthritis (OA). MRI is an appropriate technique to study meniscal-degradation1, 2. Commonly, meniscal-extrusion results from laxity in the meniscal-hoop. Usually, the degraded-meniscal site is visually examined on the MRI images (T1, T2, and Proton-Density-weighted images)2. Some reported studies have shown a significant mismatch between meniscus pathology identified on MRI images vs. Arthroscopy3. Moreover, specific meniscal-segment laxity and its contribution to meniscal-extrusion have not been reported to the best of our knowledge.Further, the previous studies4-6 observed an increase in meniscal-extrusion due to load during MRI scanning. Thus, load-bearing MRI has the potential to examine meniscal deformation in an early stage of degradation.
The current knee-joint load-bearing study proposes a method to measure deformation under load in the various meniscal segments for evaluating each segment's laxity. Further, a finite-element-model (FEM) of knee-joint simulated the deformation to assess the contribution of each segment’s laxity in meniscal-extrusion and adjacent segment.
METHODS
The current study enrolled five healthy subjects with no prior reported symptoms of a knee ailment for an MRI experiment with prior approval from the Institutional-Ethics-Committee(IEC). The right-leg of each subject was scanned. The MR image acquisition was performed on a 3.0 Tesla MR scanner (GE Healthcare, Chicago, Illinois) using an 8-channel transmitter/receiver knee-coil.MRI data were acquired in coronal-orientation using Fat-Suppressed-Proton-Density(FSPD) sequence (TR=2881ms, TE=8.9ms, FOV=140x140mm2, acquisition image size=384x192, slice thickness=3mm, number of slices=30). Each subject was scanned supine with and without 50% body-weight (50%BW) load, using the knee-joint-axial-loading device7.
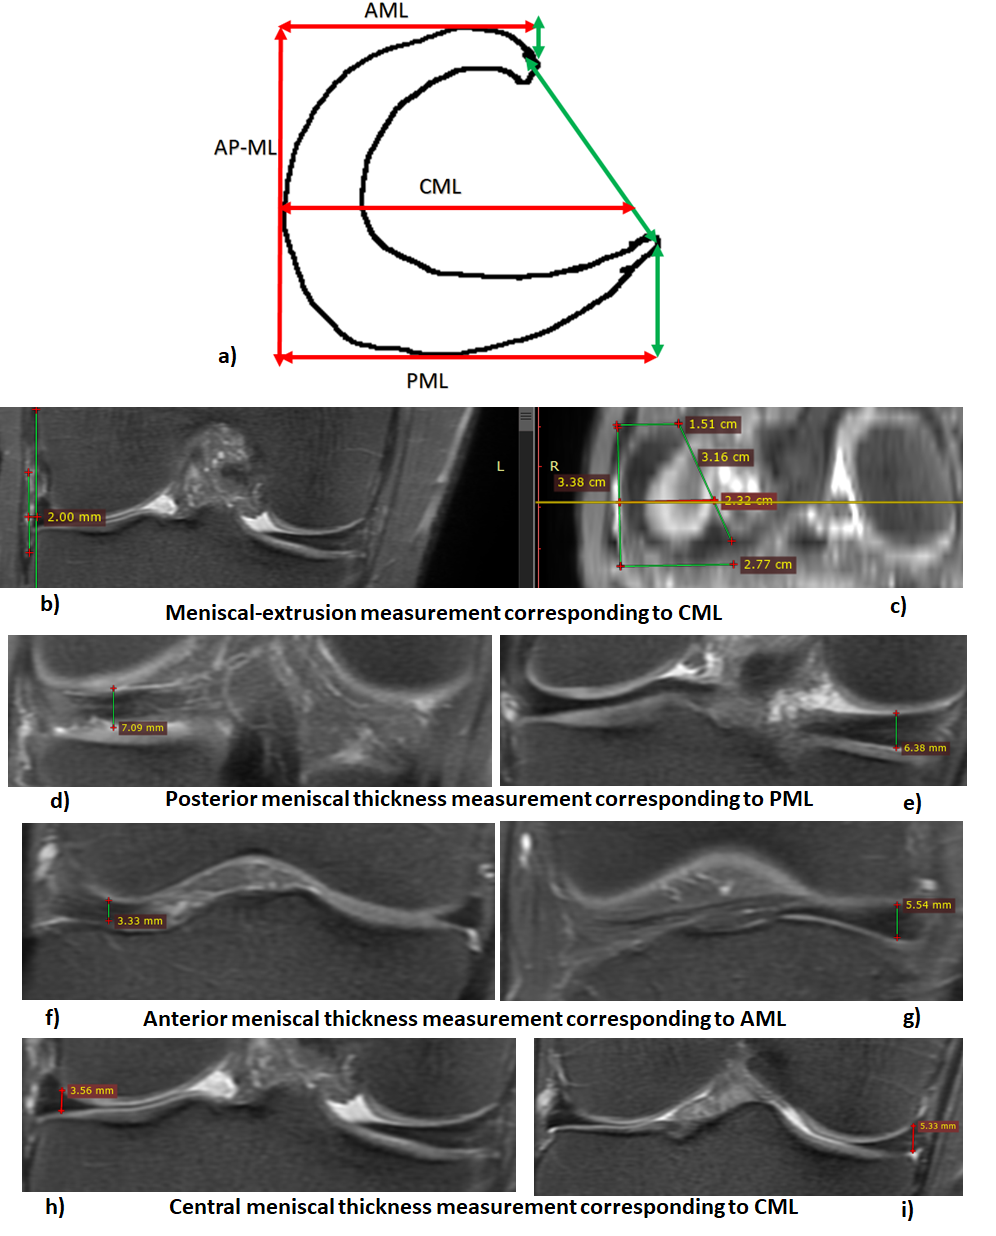
The study measured anterior(A) meniscal-length(ML), posterior(P) ML, AP-ML, central(C) ML (Figure 1a), meniscal-extrusion (Figure 1b), and thickness at A, P, and C ML(Figure 1d, e, f, g, h, and i), using RadiAnt DICOM viewer 2020(Medixant, Poznan, Poland). Relative percentage changes (RPC) due to the load were evaluated for length and thickness parameters of each medial and lateral hoop.
Evaluation method for each medial and lateral meniscal hoop:
Step 1: The meniscal lengths were measured in reconstructed axial-orientation(Figures 1a and c).
Step 2: Meniscal-extrusion (Figure 1c) and central-thickness were measured in coronal-orientation at slice corresponding to CML location (Figure 1h and i).
Step 3: Posterior (Figure 1d and e) and anterior (Figure 1f and g) meniscal thickness were measured in coronal-orientation at slice corresponding to PML and AML location, respectively.
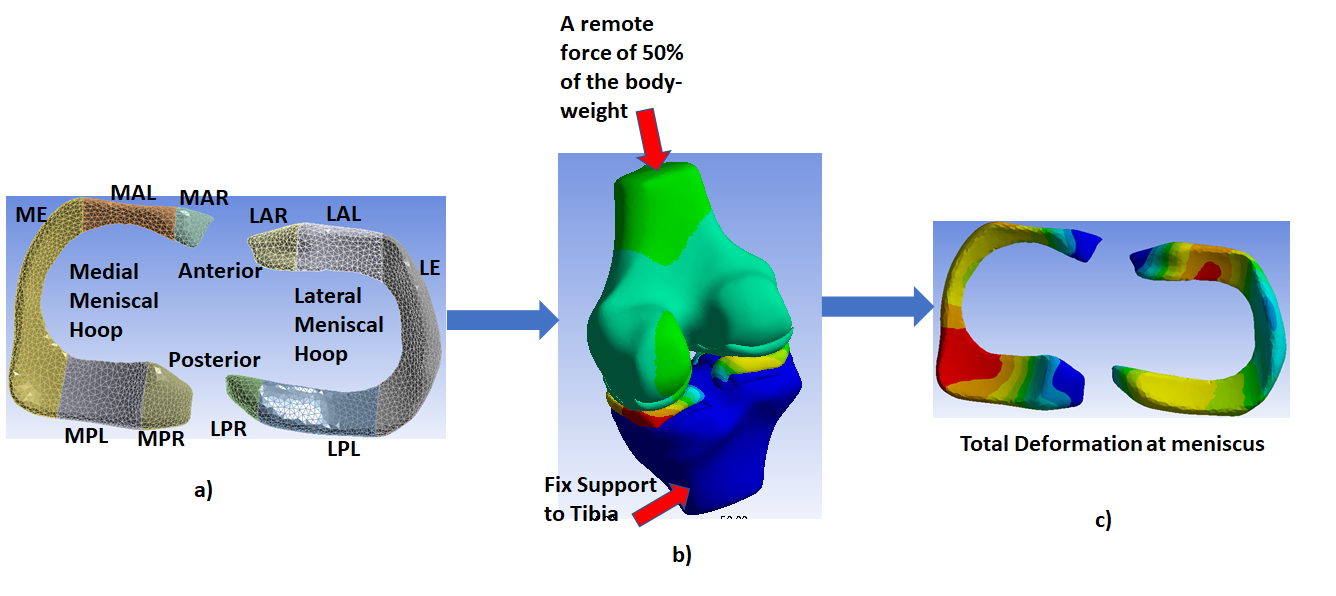
Further, a FEM simulation study (Ansys 18.1 Workbench (Ansys Inc., Canonsburg, Pennsylvania, United States)) was conducted to simulate the total-deformation in the meniscus due to 50%BW. Each lateral and medial meniscal-hoop was divided into five-segments (Figure 2a). The degraded meniscus segment was assigned 1MPa Young’s Modulus in the simulation study, whereas other meniscus segments were assigned as 3MPa of Young’s Modulus.
RESULT
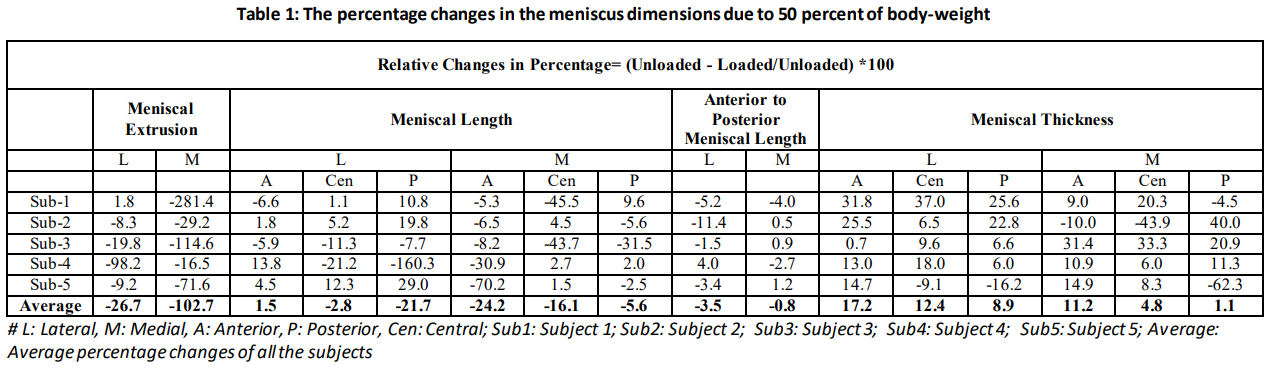
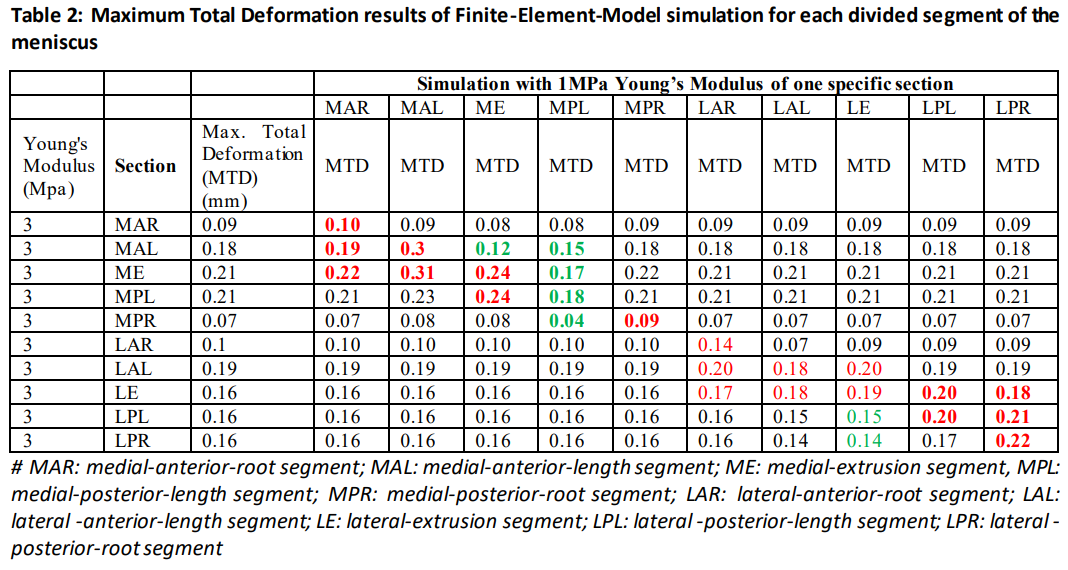
The study observed a narrow range of 1.3-2.3 mm of meniscal extrusion in the healthy subject in loading and unloading conditions. The average-RPC(ARPC) of meniscal-extrusion in the lateral and medial hoops were 26.7% and 102.7%, respectively. The largest ARPC of meniscal length is observed in lateral PML as 21.7% (0.3 mm absolute change (AbsC)) and medial AML as 24.2% (1.4 mm AbsC). The ARPC observed in AP-ML in lateral and medial hoops are 3.5% and 0.8%, respectively; however, absolute changes are <0.3 mm. The ARPC in meniscal thickness was observed more on both lateral and medial hoops anterior segments as 17.2% (0.22 mm AbsC) and 11.2% (0.45 mm AbsC), respectively. The detailed RPC in each segment is given in Table 1.The results of the FEM simulation study are shown in Table 2. The bold red font in the table shows the substantial deformation in the segments due to the degraded component in the respective segment. However, the green value shows the reduction in the deformation due to load redistribution. Anterior and posterior length degraded segments have a substantial (>10%) effect on meniscal-extrusion.
DISCUSSION
The current study proposed a method to evaluate segment-specific meniscal-laxity and specific segment laxity contribution to meniscal-extrusion using load-bearing MRI technique 7. The observed deformation in the study reflects the meniscal-segment laxity. The meniscus deforms more in loading conditions than unloading; thus, the load-bearing MRI can evaluate early-stage meniscal-degradation. The study included a holistic approach to measuring the various dimension of the meniscus, where no substantial changes were observed in AP-ML (<5% and <0.3 mm changes); however, medial meniscus hoop’s AML, PML, CML, and meniscus-extrusion shows substantial change (>5%) during load. Besides, the FEM simulation study observed the segments having substantial deformation (>5%) due to load in the degraded or adjacent to degraded segments. This reflects the degraded segment’s effects on adjacent segments and meniscal-extrusion. This deformation leads may to a change in the load distribution on the cartilage. In the current study, measurement of parameters such as AML, PML, CML, and meniscus-extrusion were carried manually and should be automatized to reduce subjectivity. This preliminary study included FEM analysis from a single subject’s data and shall be extended to more subjects. Moreover, the current study should be evaluated on the subjects with meniscal degradation or tear.CONCLUSION
A holistic load-bearing meniscal study has the potential to examine the laxity of individual meniscal segments and their contribution to deformation in adjacent segments and meniscal-extrusion.Acknowledgements
The authors acknowledge the grant support from IRD, IIT Delhi (Project No. MI01422). The authors would like to thank Mahajan Imaging Centre, New Delhi, for providing the MRI facility for the data acquisition.References
1. Lefevre, N., Naouri, J.F., Herman, S., Gerometta, A., Klouche, S. and Bohu, Y., 2016. A current review of the meniscus imaging: proposition of a useful tool for its radiologic analysis. Radiology research and practice, 2016.
2. Howell, R., Kumar, N.S., Patel, N. and Tom, J., 2014. Degenerative meniscus: Pathogenesis, diagnosis, and treatment options. World journal of orthopedics, 5(5), p.597.
3. Muzaffar, N., Kirmani, O., Ahsan, M. and Ahmad, S., 2015. Meniscal extrusion in the knee: should only 3 mm extrusion be considered significant? An assessment by MRI and arthroscopy. Malaysian orthopaedic journal, 9(2), p.17.
4. Patel, R., Eltgroth, M., Souza, R.B., Zhang, C.A., Majumdar, S., Link, T.M. and Motamedi, D., 2016. Loaded versus unloaded magnetic resonance imaging (MRI) of the knee: effect on meniscus extrusion in healthy volunteers and patients with osteoarthritis. European journal of radiology open, 3, pp.100-107.
5. Stehling, C. and Souza, R.B., Hellio Le Graverand MP et al (2012) Loading of the knee during 3.0 T MRI is associated with significantly increased medial meniscus extrusion in mild and moderate osteoarthritis. Eur J Radiol, 81(8), pp.1839-1845.
6. Vedi, V., Spouse, E., Williams, A., Tennant, S.J., Hunt, D.M. and Gedroyc, W.M.W., 1999. Meniscal movement: an in-vivo study using dynamic MRI. The Journal of bone and joint surgery. British volume, 81(1), pp.37-41.
7. Jogi, S.P., Thaha, R., Rajan, S., Mahajan, V., Venugopal, V.K., Mehndiratta, A. and Singh, A., 2021. Device for Assessing Knee Joint Dynamics During Magnetic Resonance Imaging. Journal of Magnetic Resonance Imaging. https://doi.org/10.1002/jmri.27877
Figures