1485
Dynamic Changes in Lung Water Density and Volume with Changes in Body Position1The Department of Biomedical Engineering, University of Alberta, Edmonton, AB, Canada
Synopsis
We aim to describe the dynamic response of the distribution of lung water to the change in position from standing to supine. An efficient UTE MRI trajectory (Yarnball) provided 3D images (free-breathing, 74 seconds acquisition) in 3 volunteers, with 10 repeated scans over ~14 minutes. Lung water density (LWD) increased over time but total lung water content remained constant, consistent with a measured decrease in lung volume over time. LWD increased by a larger extent towards the back, suggesting a larger lung volume reduction in gravity dependent regions (the back) over time. Steady-state LWD was not achieved in 14 minutes.
Introduction
Increased lung water density (LWD) measured with MRI has been shown to predict health outcomes in heart failure1, with regional variations in water density in health and disease. For example, a gradient in LWD from the chest to back is routinely observed2,3, associated with increased compressive forces in the gravity-dependent or dorsal lung regions, termed the “Slinky effect”3. The goal of the current study was to measure the changes in LWD, as a function of location in the healthy lung, with a change in position from standing up to the standard supine MRI body position, which is currently unknown.Methods
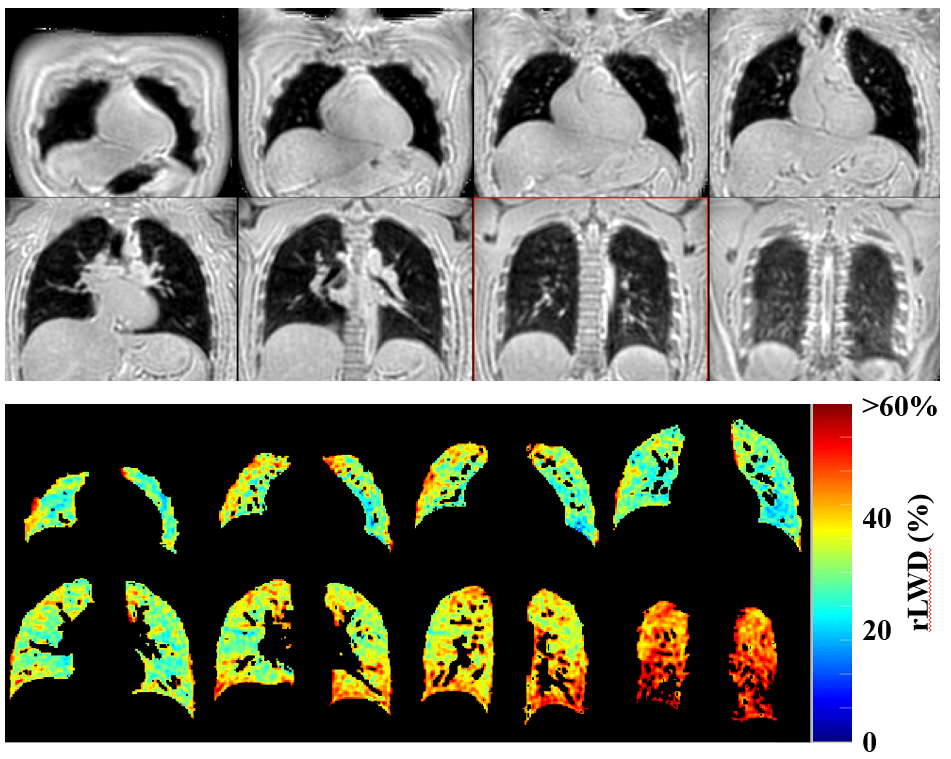
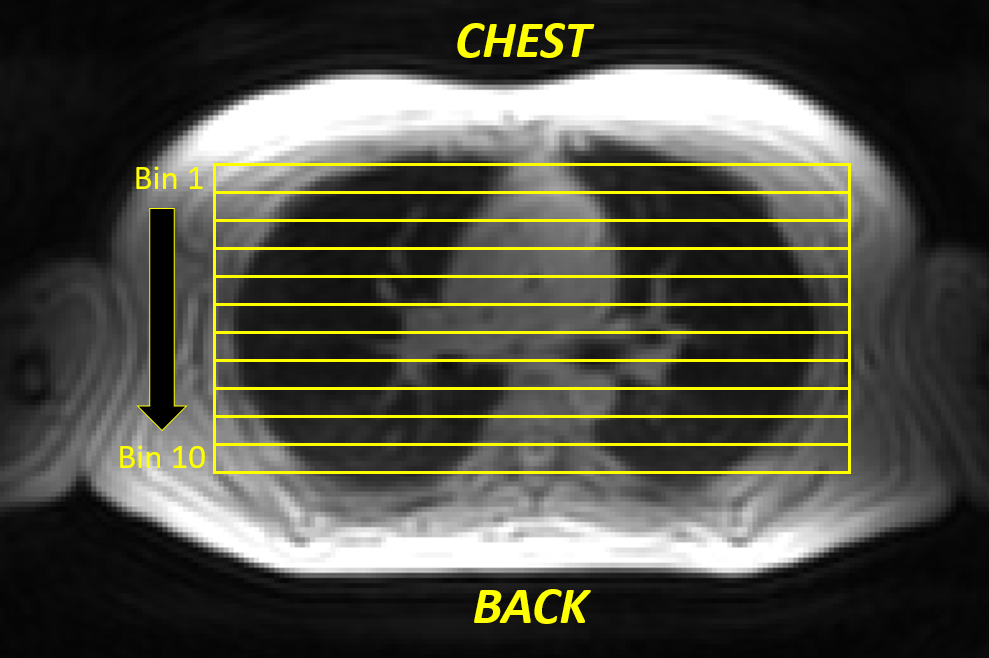
MRI Acquisition – An efficient UTE k-space trajectory (Yarnball) provided 3D water-density weighted lung images in a free-breathing acquisition2,4: 350 mm field of view, TR = 2.72 ms, TE = 0.10 ms, 1 degree flip angle, readout time = 1.3 ms, voxel size = 3.5 mm x 3.5 mm x 3.5mm (2 mm reconstructed), 2738 trajectories (golden angle increments), 7.4 seconds per 3D image with 10 repetitions during free-breathing for a total acquisition time of 74 seconds (MAGNETOM Prisma; Siemens Healthcare; Erlangen, Germany). A timer was started with supine positioning on the scanner bed after standing with 10 repetitions of the free-breathing LWD scan (74 seconds each) for a total scan time of ~14 minutes. Raw data was saved for off-line reconstruction and processing. This process was repeated for 3 volunteers. Image-Processing – Reconstructed 3D images at end-expiration were processed as previously described, including spatial normalization and signal referencing (to units of relative LWD, rLWD) and automated segmentation of the lung parenchyma using region-growing segmentation technique2 (Fig. 1). The following parameters were calculated for all 3 subjects, for all 10 time points: total lung volume, average rLWD, total lung water volume and regional rLWD, with 10 equally sized “binned” regions from chest to back, right to left and head to foot (Fig. 2).Results
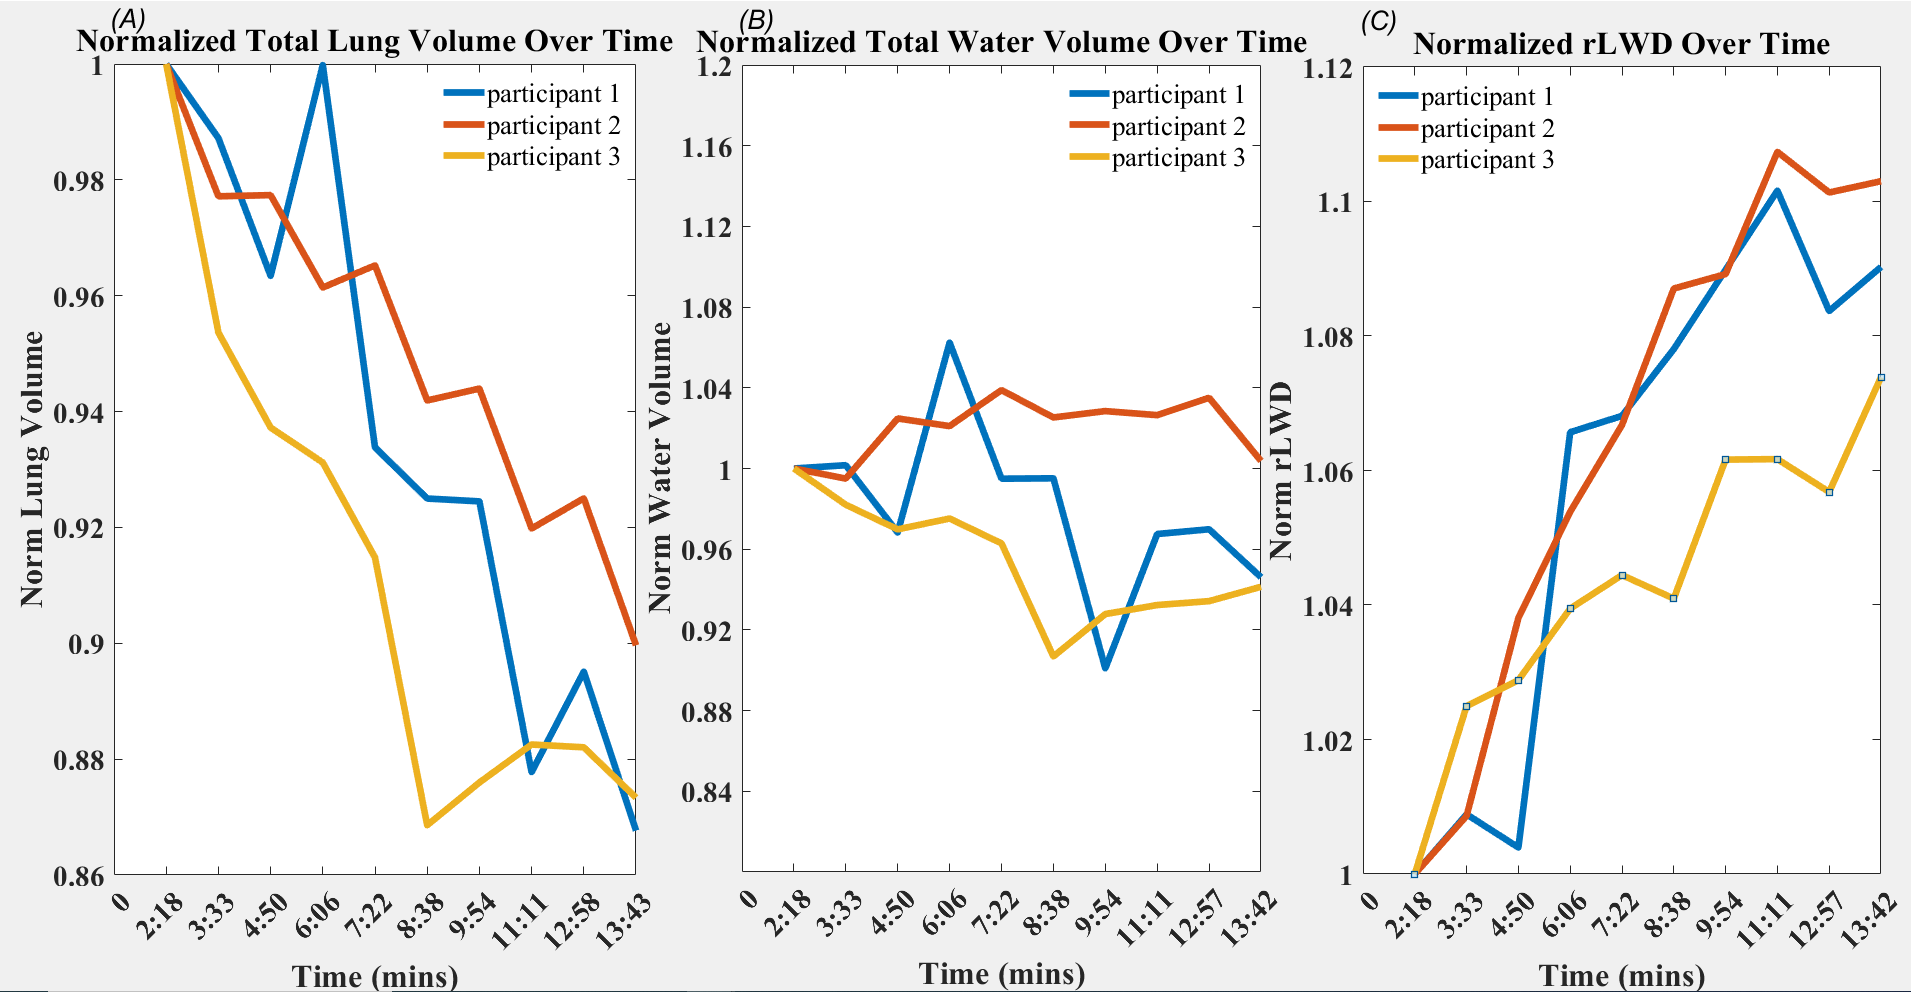
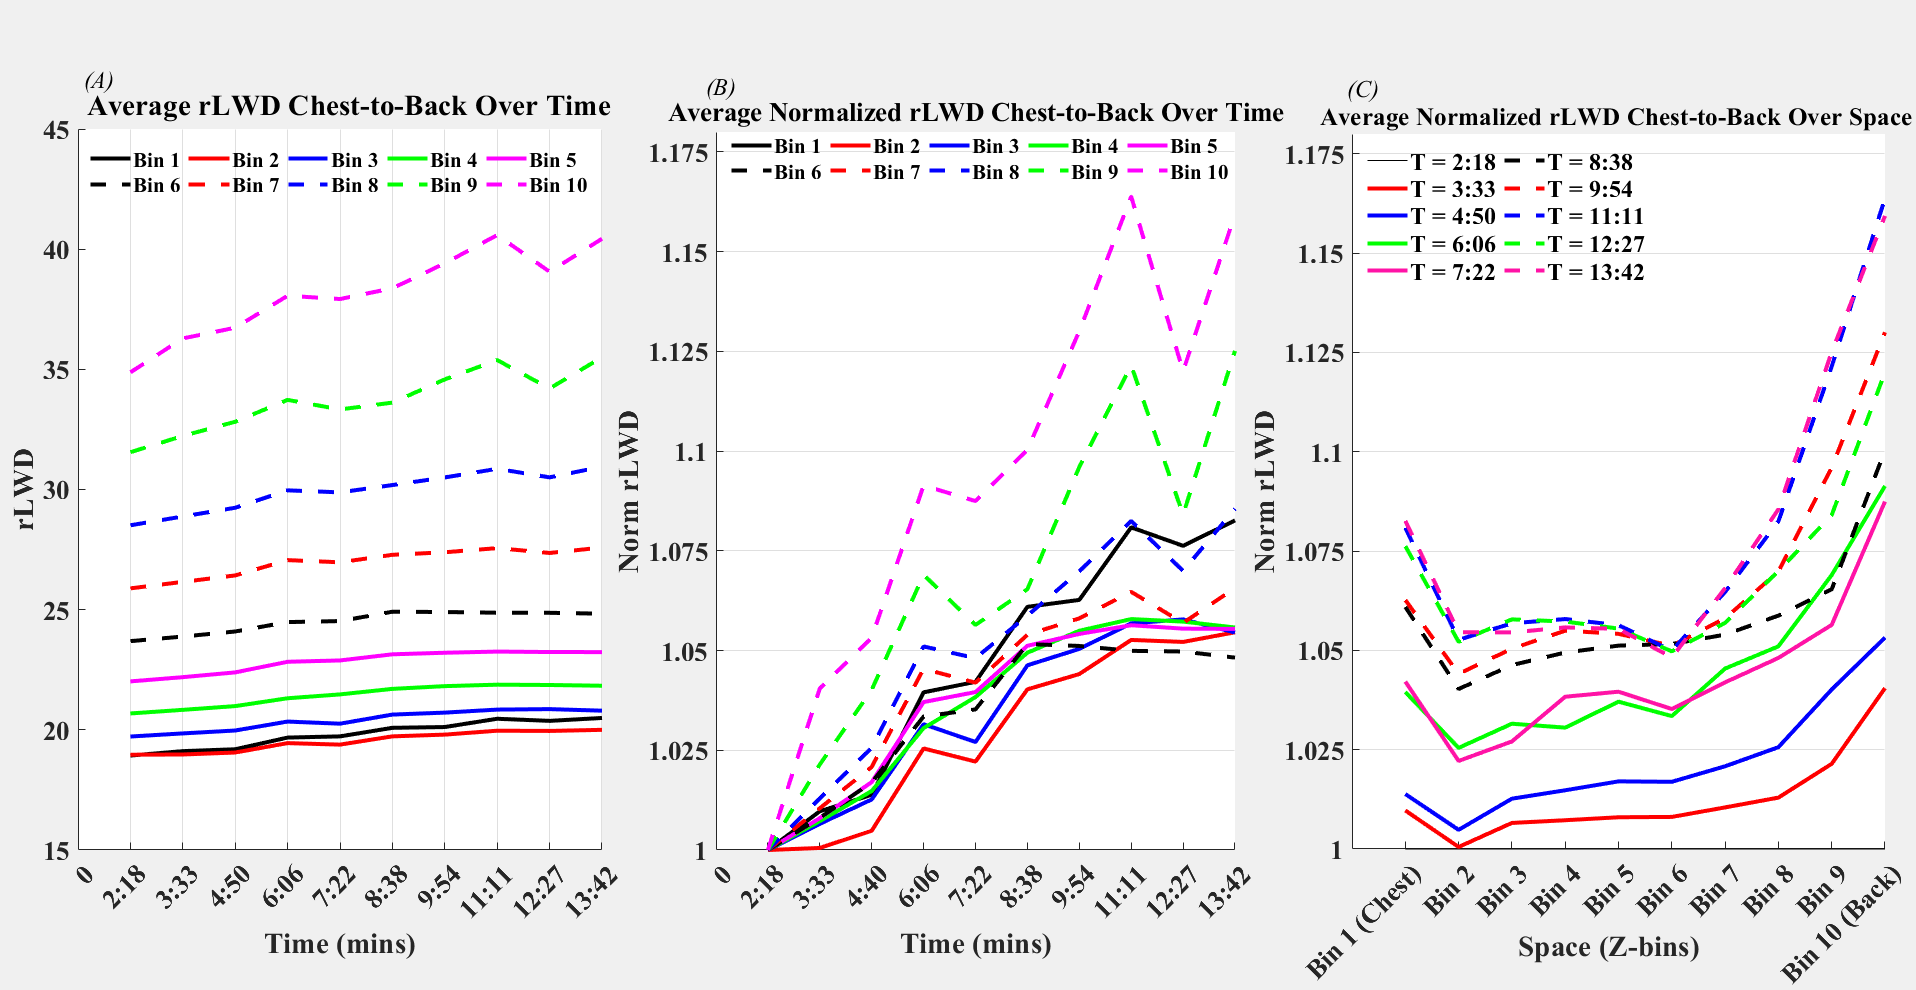
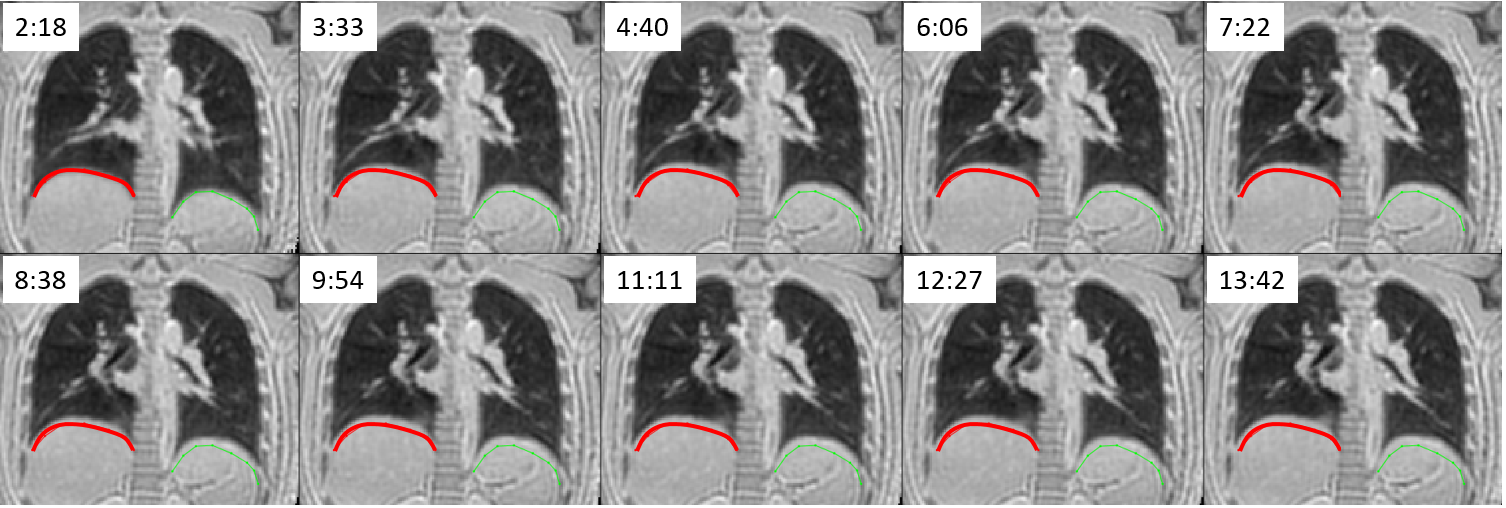
During free-breathing at end-expiration, total lung volume decreased continuously in all subjects to ~90% of the starting volume (Fig. 3A). Total lung water content did not change significantly over time (Fig. 3B) and rLWD increased continuously over time to ~110% of starting values (Fig. 3C). rLWD values had a gradient from chest to back, as expected, with all regions increasing continuously over time, with absolute values in Fig. 4A and relative values in Fig. 4B, normalized to the first time point. There were larger increases in rLWD in the back as compared to the middle and chest values (Fig. 4C). There were no significant regional variations in rLWD in the right to left and head to foot directions (not shown). The change in lung shape and volume over time is most pronounced near the diaphragm, as illustrated in Fig. 5.Discussion
The primary findings of the current study are that lung volumes at end-expiration, during free-breathing, decrease continuously over time, after supine positioning, that give rise to a corresponding increase in water density (rLWD). The change in body position from standing to supine is also associated with a shift in blood volume from the lower body to the upper body, but no change in total lung water volume was measured in the current study, suggesting that all observed increases in rLWD were associated with reduced volumes (i.e. displacement of air from the lungs). The larger increase in rLWD at the back as compared to middle and chest regions is in agreement with the slinky model of the lungs3, where the more dependent regions of the lungs are more compressed as a consequence of their lower position in the chest cavity (i.e. more loading tissue on top). The current data has shown, for the first time to our knowledge, the temporal evolution of formation of these chest to back gradients in water density. It is unclear if 14 minutes is sufficient to reach stead-state lung water distributions.Conclusion
The dynamic response of healthy lungs to the change in positon from standing upright to the standard supine MRI positon is a continuous compression the lungs (largely with a change in diaphragm position), resulting in lower total lung volume and proportionally increasing rLWD. Separate from these global changes, there is likely a change in the regional lung volumes, with larger gravity-dependent drops towards the back, with an associated larger increase in rLWD over time. Longer duration studies, with more participants, will be necessary to determine the time required to reach steady-state.Acknowledgements
No acknowledgement found.References
1. Thompson, R.B., Chow, K., Pagano, J.J. et al. Quantification of lung water in heart failure using cardiovascular magnetic resonance imaging. J Cardiovasc Magn Reson 21, 58 (2019).
2. Meadus WQ, Stobbe RW, Grenier JG, Beaulieu C, Thompson RB. Quantification of lung water density with UTE Yarnball MRI. Magn Reson Med. 2021;86:1330– 1344.
3. Hopkins SR, Henderson AC, Levin DL, Yamada K, Arai T, Buxton RB, Prisk GK. Vertical gradients in regional lung density and perfusion in the supine human lung: the Slinky effect. J Appl Physiol (1985). 2007 Jul;103(1):240-8.
4. Stobbe RW, Beaulieu C. Three-dimensional Yarnball k-space acquisition for accelerated MRI. Magn Reson Med. 2021;85:1840– 1854.
Figures