1484
Imaging biomarkers of ventilation in Interstitial Lung Disease from 129Xe and Oxygen Enhanced 1H MRI1Bioxydyn Ltd, Manchester, United Kingdom, 2POLARIS, University of Sheffield MRI unit, The University of Sheffield, Sheffield, United Kingdom, 3MCMR, Manchester University NHS Foundation Trust, Manchester, United Kingdom, 4Centre for Imaging Sciences, University of Manchester, Manchester, United Kingdom, 5North West Lung Centre, Manchester University NHS Foundation Trust, Manchester, United Kingdom, 6Royal National Hospital for Rheumatic Diseases, Royal United Hospitals Bath NHS Foundation Trust, Bath, United Kingdom, 7NIHR Manchester Biomedical Research Centre, Manchester University NHS Foundation Trust, Manchester, United Kingdom, 8Centre for Musculoskeletal Research, University of Manchester, Manchester, United Kingdom, 9Academic Directorate of Respiratory Medicine, Sheffield Teaching Hospitals NHS Foundation Trust, Sheffield, United Kingdom, 10nsigneo Institute for in silico Medicine, Sheffield, United Kingdom, 11Centre for Medical Image Computing, Department of Medical Physics and Biomedical Engineering, University College London, London, United Kingdom
Synopsis
Interstitial lung diseases (ILD) are a heterogeneous group of conditions exhibiting inflammation and scarring of the lung parenchyma. Here, we compare imaging biomarkers from hyperpolarised 129Xe ventilation MRI and oxygen-enhanced MRI (OE-MRI) with standard pulmonary function tests in cohorts of ILD patients with mixed origins. We also evaluated whether disease resolution or progression could be detected over two visits. None of the imaging biomarkers considered completely differentiated ILD subtypes. OE-MRI biomarkers are feasible in ILD patients and do not correlate strongly with PFT. Both OE-MRI and 129Xe MRI revealed spatially heterogeneous ventilation in patients with DI-ILD and IPF.
Introduction
Interstitial lung diseases (ILD) are a heterogeneous group of conditions exhibiting inflammation and scarring of the lung parenchyma1. There is a need for improved biomarkers for diagnosis, prognosis, and monitoring of disease progression and treatment efficacy, as well as predictive biomarkers for treatment selection. Here, we compare imaging biomarkers from hyperpolarised 129Xe ventilation MRI and oxygen-enhanced MRI (OE-MRI) with standard pulmonary function tests (PFT) in different cohorts of ILD patients. From the biomarkers studied we also evaluated whether disease resolution or progression could be detected.Methods
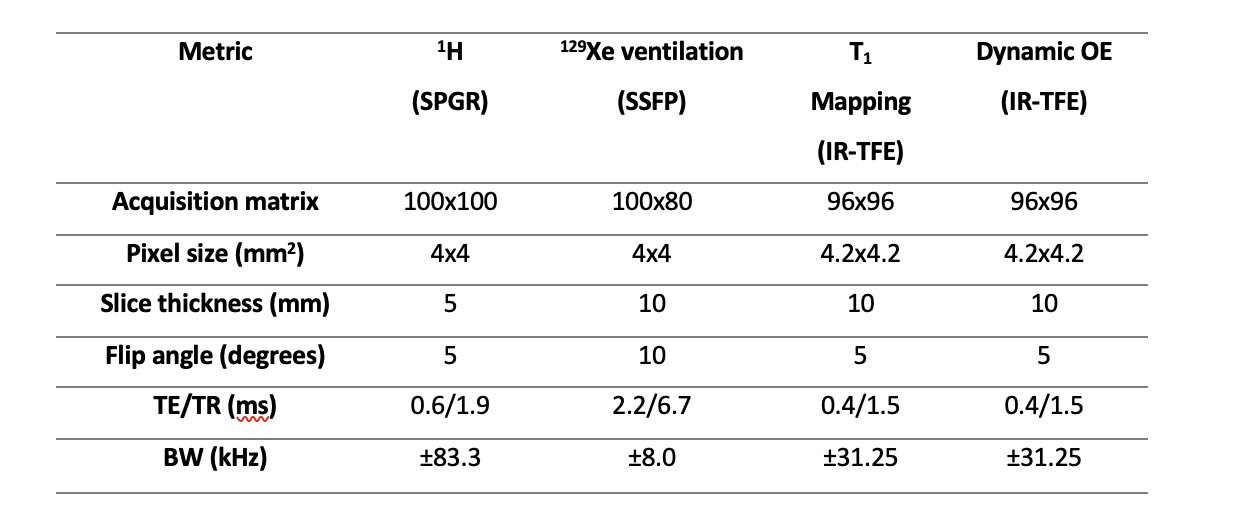
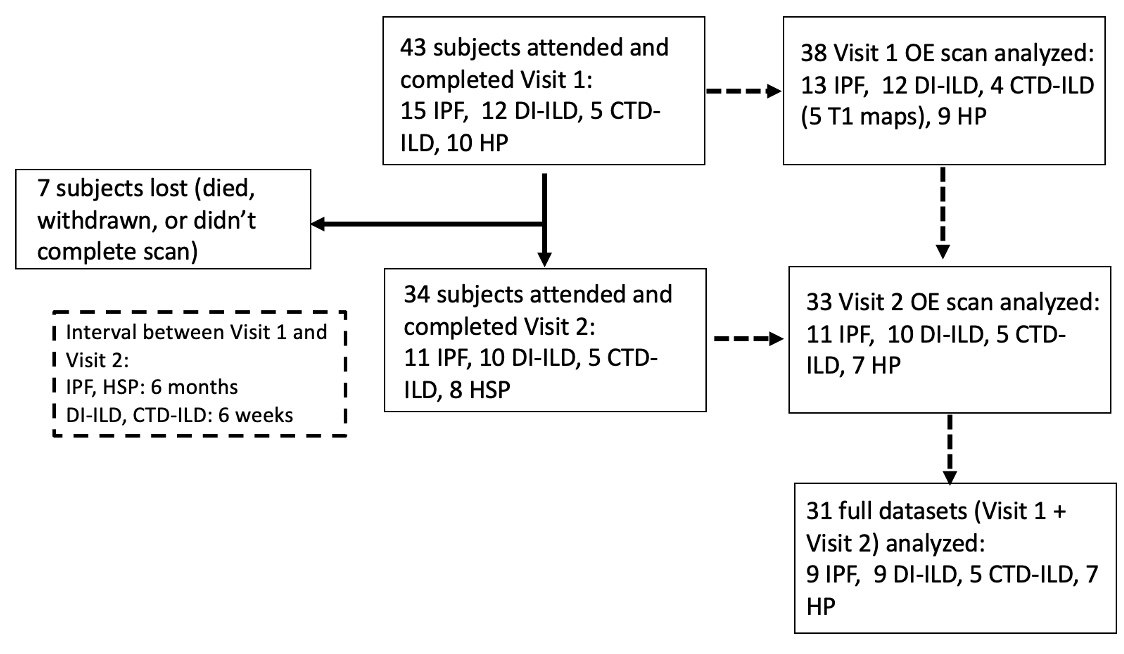
Patients with a diagnosis of idiopathic pulmonary fibrosis (IPF), hypersensitivity pneumonitis (HP), drug-induced ILD (DI-ILD) or connective tissue disease related-ILD (CTD-ILD) were recruited and attended two visits: V1 at baseline, and V2 six (DI-ILD and HP) or 26 weeks later (IPF and CTD-ILD), to capture change expected for the respective groups. Additionally, ten healthy volunteers (HV) attended for a single visit (V1). All imaging was carried out on a 1.5 T whole body system (GE HDx, GE Healthcare, Milwaukee, WI). Imaging comprised HP 129Xe ventilation MRI2, followed by inversion recovery (IR) T1 mapping plus a 15 min long dynamic OE-MRI acquisition3, during which gas was delivered at 15 L/min through a non-rebreather mask and switched from medical air to 100% O2 at minute 2, and back to air at minute (see Table 1). On the same day, subjects underwent pulmonary function testing (spirometry and gas transfer testing).Five 1H MRI biomarkers (T1, change in partial pressure of oxygen (ΔpO2), wash-in time of oxygen (τup), OE ventilation heterogeneity index (OE-VHI), OE ventilated volume fraction (OE-VVF)) and two 129Xe ventilation biomarkers (ventilated volume fraction (%VV), ventilation heterogeneity index (VHI)) were compared with spirometry biomarkers and gas transfer biomarkers (FEV1%, FVC%, TLCO% and KCO%).
Statistics
To evaluate differences at V1 between subgroups, ANOVA or Kruskal-Wallis rank tests with correction for multiple comparisons were used. To assess the relationships between imaging biomarkers, PFTs, age and gender at V1 and for the change between V1 and V2, multilinear regression models were run. Significance was defined as p ≤ 0.05.Results
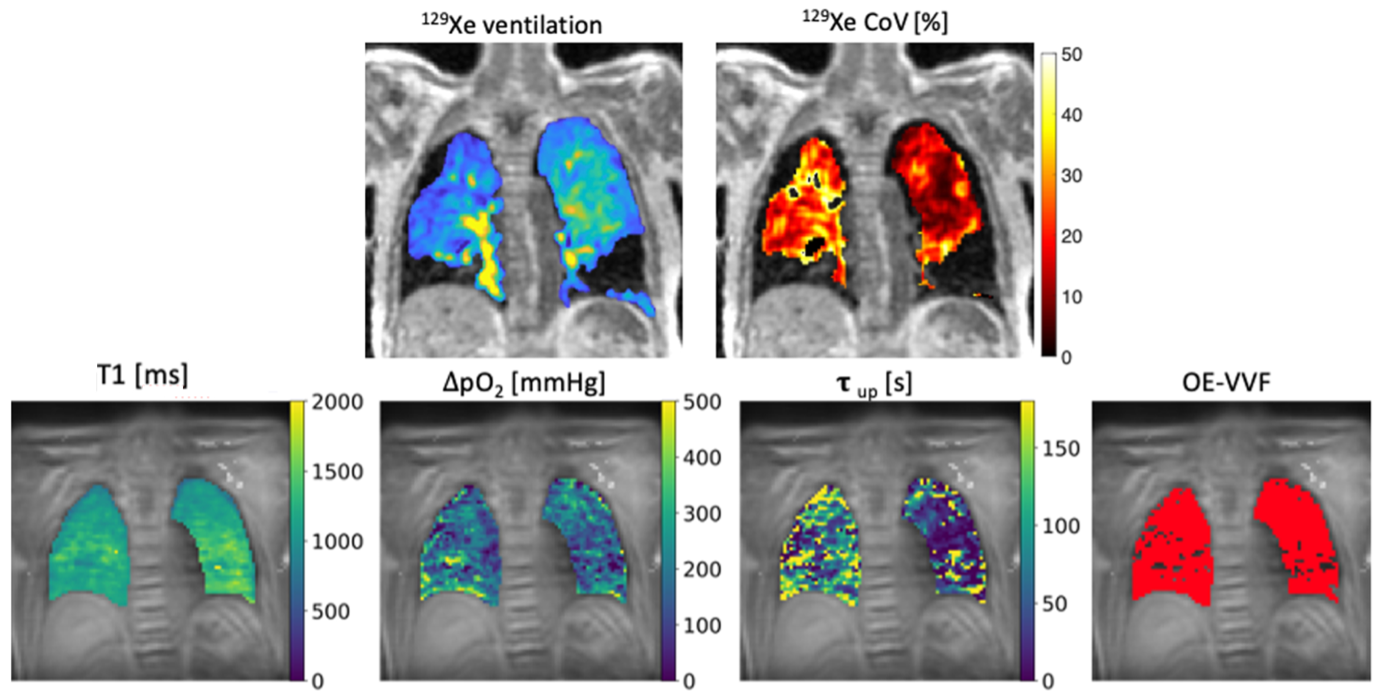
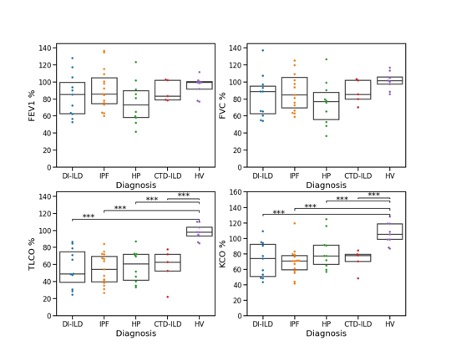
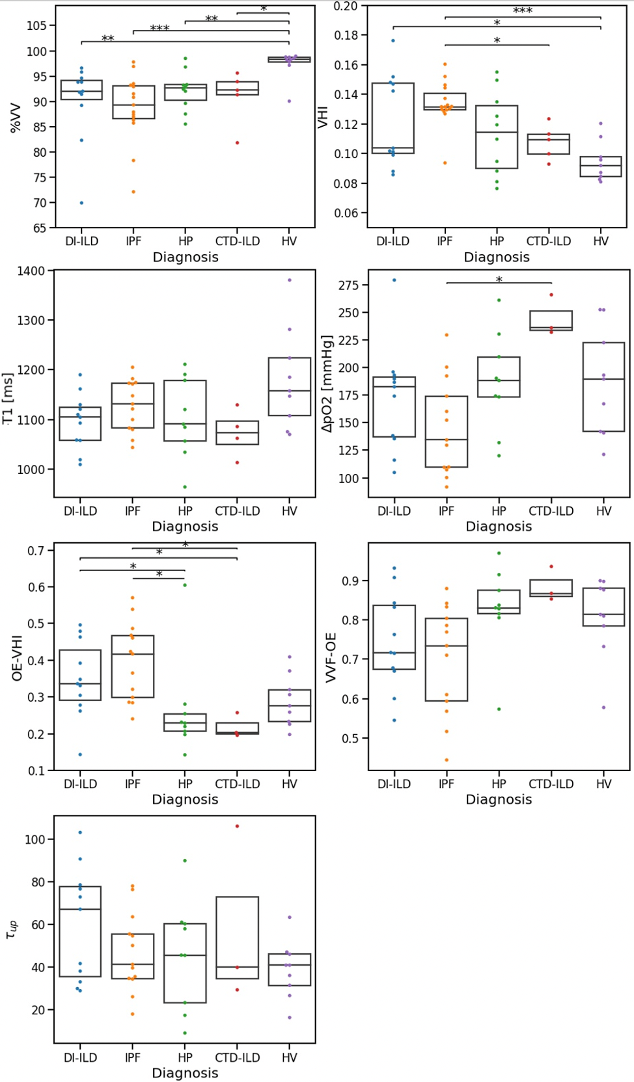
Population characteristics: Forty-one ILD (fifteen IPF, ten HSP, eleven DI-ILD, five CTD-ILD) patients were recruited. Thirty-four ILD patients completed V2 (eleven IPF, eight HP, ten DIILD, five CTD-ILD). Figure 2 presents a flow chart representing patients’ recruitment.PFTs and imaging biomarkers at V1: Figure 1 shows an example of 129Xe, CT, and OE-MRI maps from a patient with IPF. Figures 3 and 4 show the comparisons of the PFTs and imaging biomarkers at V1. PFT biomarkers did not distinguish ILD subtypes. %VV was lower in ILD patients than in HV when measured with 129Xe MRI (CTD-ILD: p= 0.017, DI-ILD p=0.003, HSP p= 0.008, IPF p<0.001), but not with OE-MRI. There were significant differences in ventilation heterogeneity between ILD groups. VHI was lower in HV than in IPF (p<0.0001) and DI-ILD (p=0.012). VHI was lower in the CTD-ILD group than in IPF (p=0.023). OE-VHI was lower in CTD-ILD than in DI-ILD (p=0.04) and lower than in IPF (p=0.011); OE-VHI was also lower in HP than in DI-ILD (p=0.031) and lower than in IPF (p=0.004).
Multilinear regression models demonstrated that age (b=-0.2; 95%CI=-0.33,-0.11; p<0.001) and TLCO (b=0.07; 95%CI=0.005,0.136; p=0.035) were significant predictors of %VV (R2=0.39). Age (b=0.0007; 95%CI=10-4,10-3; p=0.001), TLCO (b=-0.0003, 95%CI = 10-4, 10-3; p=0.013) and gender (b=0.019; 95%CI=0.009,0.031; p=0.001) were significant predictors of VHI (R2=0.53). Age (b=-2.32; 95%CI=-3.85, -0.79; p=0.004), FVC% (b=0.97, 95%CI = 0.13,1.81; p=0.025), and IPF diagnosis (b=33.2; 95%CI=-14.53,80.99; p=0.168) were significant predictors of T1 (R2 =0.24).
Changes between visits: In the overall ILD population, only KCO%, decreased between V1 and V2 (V1: 73.9±20.4; V2: 67.91±21.1; difference: -4.8±12.4, p=0.033). No significant changes were seen between any biomarker for individual ILD subgroups.
Multilinear models – imaging biomarkers (V2 – V1): Only age at V1 was a significant predictor of the change in OE-VVF between visits (R2=0.145; b=0.2; 95%CI=0.026,0.44; p=0.029). Change of FEV1% was a significant predictor of change in T1 between visits (R2=0.138, b=-0.47; 95%CI=-9.33,-0.157; p=0.043)
Discussion
None of the biomarkers differentiated ILD subtypes, although biomarkers of focal variation (OE-VHI and VHI) seemed to reveal differences in ventilation heterogeneity between ILD subtypes. Similarly, the longitudinal change in the imaging biomarkers did not correlate with PFT changes between the two timepoints.The multilinear regression analysis showed that lung T1 correlated negatively with age, but sex was not found to predict T1, in contrast to previous reports 4. As expected, %VV and VHI correlate strongly with age5.Ventilated volume fractions derived from OE-MRI and 129Xe-MRI did not correlate. This lack of correlation may be due to the significant difference in the time scales over which the measurements are performed (single breath hold for 129Xe-MRI, 10 minutes for OE-MRI), or possibly because OE-MRI interrogates the parenchyma while ventilation 129Xe-MRI interrogates the airways and the alveoli; alternatively, it may simply reflect the relative variability and small numbers in this work.Conclusion
None of the imaging biomarkers completely differentiated ILD subtypes, although some measures detected differences in individual groups. OE-MRI biomarkers are feasible in ILD patients and do not correlate strongly with PFT. Both OE-MRI and 129Xe MRI revealed spatially heterogeneous ventilation in patients with DI-ILD and IPF.Acknowledgements
The research leading to these results received funding from the Innovative Medicines Initiatives 2 Joint Undertaking under grant agreement No 116106. This Joint Undertaking receives support from the European Union’s Horizon 2020 research and innovation programme and EFPIA. This work was also supported by the National Institute of Health Research (RP-R3-12-027), Medical Research Council (MR/M008894/1) and GlaxoSmithKline (PJCH:BIDS3000032592). The views expressed are those of the authors and not necessarily those of the NHS, NIHR, the Department of Health, GlaxoSmithKline nor the TRISTAN consortium.References
1: Travis, William D., et al. "An official American Thoracic Society/European Respiratory Society statement: update of the international multidisciplinary classification of the idiopathic interstitial pneumonias." American journal of respiratory and critical care medicine 188.6 (2013): 733-748.
2: Hughes, P.J.C.; Horn, F.C.; Collier, G.J.; Biancardi, A.; Marshall, H.; Wild, J.M. Spatial Fuzzy C‐means Thresholding for Semiautomated Calculation of Percentage Lung Ventilated Volume from Hyperpolarized Gas and 1H MRI. Journal of Magnetic Resonance Imaging 2018, 47, 640–646.
3: Zhang, W.-J.; Niven, R.M.; Young, S.S.; Liu, Y.-Z.; Parker, G.J.M.; Naish, J.H. Dynamic Oxygen-Enhanced Magnetic Resonance Imaging of the Lung in Asthma—Initial Experience. European journal of radiology 2015, 84, 318–326.
4: Kindvall, S.S.I.; Diaz, S.; Svensson, J.; Wollmer, P.; Slusarczyk, D.; Olsson, L.E. Influence of Age and Sex on the Longitudinal Relaxation Time, T1, of the Lung in Healthy Never‐smokers. Journal of Magnetic Resonance Imaging 2016, 43, 1250–1257.
5: Virgincar, R.S.; Cleveland, Z.I.; Sivaram Kaushik, S.; Freeman, M.S.; Nouls, J.; Cofer, G.P.; Martinez‐Jimenez, S.; He, M.; Kraft, M.; Wolber, J. Quantitative Analysis of Hyperpolarized 129Xe Ventilation Imaging in Healthy Volunteers and Subjects with Chronic Obstructive Pulmonary Disease. NMR in Biomedicine 2013, 26, 424–435.
Figures