1483
PREFUL-MRI evaluation of dynamic hyperinflation induced by metronome-paced tachypnea in COPD patients1Institute of Diagnostic and Interventional Radiology, Hannover Medical School, Hannover, Germany, 2Biomedical Research in Endstage and Obstructive Lung Disease Hannover (BREATH), German Center for Lung Research (DZL), Hannover, Germany, 3Department of Radiology, Weill Cornell Medical College, New York, NY, United States, 4Department of Radiology, Columbia College of Physicians and Surgeons, New York, NY, United States, 5Exercise Physiology Research Laboratory, Departments of Medicine and Physiology, David Geffen School of Medicine, UCLA, Los Angeles, CA, United States, 6Division of General Medicine, Department of Medicine, New York-Presbyterian/Columbia University Irving Medical Center, New York, NY, United States, 7Department of Respiratory Medicine, Hannover Medical School, Hannover, Germany, 8Fraunhofer Institute of Toxicology and Experimental Medicine, Hannover, Germany
Synopsis
Metronome-paced tachypnea (MPT) is a technique where a patient breathes with a fixed frequency (40 breaths / minute). MPT induces dynamic hyperinflation and allows investigation of potential stress-driven effects on ventilation parameters. Fourteen patients with chronic obstructive pulmonary disease (COPD) underwent phase-resolved functional lung (PREFUL) MRI with 2D coronal lung MR images acquired during normal tidal breathing (NTB) and MPT. Compared to NTB, ventilation defect percentages increased in COPD patients during MPT. Thus, MPT in conjunction with PREFUL-MRI will be further investigated as a possible sensible ventilation test for COPD patients.
Introduction:
Hyperinflation in chronic obstructive pulmonary disease (COPD) patients worsens on exertion / exercise when their breathing frequency increases1,2. Fast breathing, paced at 40 breaths per minute using a metronome, referred to as metronome-paced tachypnea (MPT), can be performed during MRI. MPT has shown to induce dynamic hyperinflation in COPD patients3-5. Conventionally, phase-resolved functional lung (PREFUL) MRI is used in order to assess regional ventilation dynamics during normal tidal breathing (NTB)6. Hereby, areas of lung parenchyma not adequately ventilated can be detected. Until now, the potential effects of MPT on pulmonary ventilation function derived by MRI have not been assessed. Therefore, in this study, the regional lung ventilation is compared during NTB and MPT using PREFUL-MRI in COPD patients.Methods:
Twenty patients with stable, moderate to severe COPD and hyperinflation have been examined in an ongoing single center study. Patients who did not perform the MPT maneuver correctly were excluded, leaving 14 patients (9 males, 5 females; age range 40-77 years) in this study cohort. All study participants underwent body plethysmography. A 90-second long time series of one coronal slice, centered to the trachea, was acquired for PREFUL-MRI at 1.5T (MAGNETOM Avanto, Siemens Healthineers, Erlangen, Germany) under the following breathing maneuver:1) 60 seconds of NTB
2) 30 seconds of MPT at 40 breaths / minute
and following sequence parameters: FoV 500x500mm², slice thickness 15mm, matrix size 128x128, TR 3ms, TE 0.82ms, flip angle 5°, pixel bandwidth 1500/Hz.
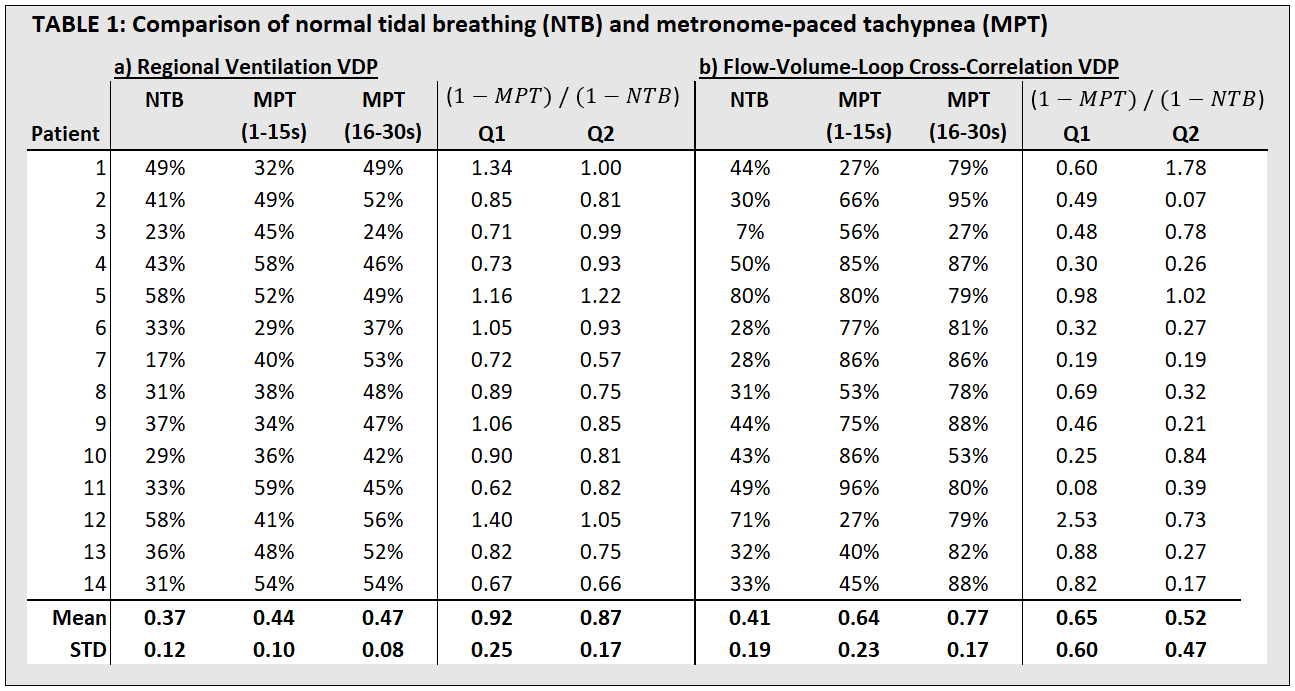
Both parts of the time series were split and analyzed separately with PREFUL-MRI. The increased breathing frequency has shown to affect the regional lung ventilation, which reaches a stable state in the 2nd half of the MPT maneuver. For data analysis, the MPT time was further divided into two sets of 15 seconds resulting in three image sets. Figure 1 shows the lung area change of a central, coronal slice over 90 seconds. Prior to PREFUL post-processing, all images were registered towards the middle respiratory state of the respective part using Advanced Normalization Tools7. Regional ventilation (RVent) derived ventilation defect percentages (VDP) and flow volume loop cross correlation (FVL-CC) derived VDP as described by Kaireit et al.8 were chosen as parameters and calculated for each series. To better compare the first 15 seconds as well as the second 15 seconds of MPT with NTB, quotients between VDPMPT and VDPNTB (Q1 & Q2) were calculated as follows:
$$Q_1 = \frac{1-VDP_{MPT1}}{1-VDP_{NTB}} , Q_2 = \frac{1-VDP_{MPT2}}{1-VDP_{NTB}}$$
With 1-VDPNTB depicting the percentage of healthy lung area in NTB and 1-VDPMPT1 and 1-VDPMPT2 the percentage of healthy lung area in MPT. With Q1 , Q2 < 1 indicating higher VDP values during the first and second part of MPT, respectively. A paired t-test with Bonferroni correction for multiple comparisons was used (α=0.025).
Results:
The 14 COPD patients included showed a mean forced expiratory volume in 1 second (FEV1% pred.) of 46.0 +/- 14.6, a forced vital capacity (FVC %-pred.) of 83.8 +/- 13.4 and a residual volume (RV) of 3.69 +/- 0.94 L (RV %pred.: 166.2 +/- 27.7) at same day body plethysmography.VDPRVent:
Table 1a shows the VDPRVent values for every patient during NTB and MPT as well as the respective quotients Q1 and Q2. During the 2nd part of MPT, the VDPRVent is significantly higher (p2=0.0076) compared to NTB (see Figure 2a).
VPDFVL-CC:
The VDPFVL-CC values were significantly higher (p1=0.0099, p2=0.00002) during both parts of MPT compared to NTB. Figure 2b visualizes mean VDPFVL-CC values for all three sets with their respective standard deviation. Table 1b shows the VDPFVL-CC values as well as the respective quotients Q1 and Q2. Figure 3 shows an example of VDPRVent and VPDFVL-CC maps of a COPD patient during NTB and the second half of MPT.
Discussion:
MPT leads to significantly increased ventilation defects in COPD patients as demonstrated by VDPRVent and VDPFVL-CC ventilation parameters derived by PREFUL. The VDPFVL-CC has shown to be more sensitive to MPT as it includes ventilation information of the complete breathing cycle in contrast to VDPRVent, which only considers the maximum inspiration and maximum expiration as well as a reference in mid-cycle. The decreased regional lung ventilation can be explained with temporarily increased hyperinflation as a consequence of a higher breathing frequency in COPD patients. However, the effect of dynamic hyperinflation during MPT increases over time as the split analysis of the MPT series demonstrates. The studied method exhibits some limitations. Some patients did not perform the MPT correctly, probably due to difficulties hearing the metronome sound covered with loud scanning noise. Thus, verification of the breathing frequency is necessary. High variations of inspiratory volume and breathing position between NTB and MPT have an impact on regional ventilation calculations. Moreover, the severity of the COPD affects the role of dynamic hyperinflation during MPT3. Even though the results are promising, further investigation in larger patient cohorts and comparisons with healthy subjects is needed to show the robustness and clinical potential of PREFUL-MRI in combination with MPT.Conclusion:
This study shows that more ventilation defects can be detected with PREFUL-MRI in COPD patients during dynamic hyperinflation induced by MPT. Thus, MPT in conjunction with PREFUL-MRI could be a sensitive ventilation test for COPD patients.Acknowledgements
This work was supported by the German Centre for Lung Research (DZL). The authors thank Melanie Pfeifer and Frank Schröder for their help during data acquisition.References
1. O'donnell DE, Revill SM, Webb KA. Dynamic hyperinflation and exercise intolerance in chronic obstructive pulmonary disease. American journal of respiratory and critical care medicine. 2001 Sep 1;164(5):770-7.
2. Klooster K, ten Hacken NH, Hartman JE, Sciurba FC, Kerstjens HA, Slebos DJ. Determining the role of dynamic hyperinflation in patients with severe chronic obstructive pulmonary disease. Respiration. 2015;90(4):306-13.
3. Weigt SS, Abrazado M, Kleerup EC, Tashkin DP, Cooper CB. Time course and degree of hyperinflation with metronome-paced tachypnea in COPD patients. COPD: Journal of Chronic Obstructive Pulmonary Disease. 2008 Jan 1;5(5):298-304.
4. Cooper CB, Calligaro GL, Quinn MM, Eshaghian P, Coskun F, Abrazado M, Bateman ED, Raine RI. Determinants of dynamic hyperinflation during metronome-paced tachypnea in COPD and normal subjects. Respiratory physiology & neurobiology. 2014 Jan 1;190:76-80.
5. Mannée D, Vis E, Hoekstra-Kuik A, van der Maten J, van‘t Hul AJ, van Helvoort H. Is the metronome-paced tachypnea test (MPT) ready for clinical use? Accuracy of the MPT in a prospective and clinical study. Respiration. 2019;97(6):569-75.
6. Voskrebenzev A, Gutberlet M, Klimeš F, Kaireit TF, Schönfeld C, Rotärmel A, Wacker F, Vogel‐Claussen J. Feasibility of quantitative regional ventilation and perfusion mapping with phase‐resolved functional lung (PREFUL) MRI in healthy volunteers and COPD, CTEPH, and CF patients. Magnetic resonance in medicine. 2018 Apr;79(4):2306-14.
7. Avants BB, Tustison NJ, Song G, Cook PA, Klein A, Gee JC. A reproducible evaluation of ANTs similarity metric performance in brain image registration. Neuroimage. 2011;54(3):2033-2044. doi:10.1016/j.neuroimage.2010.09.025
8. Kaireit TF, Kern A, Voskrebenzev A, Pöhler GH, Klimes F, Behrendt L, Gutberlet M, Moher‐Alsady T, Dittrich AM, Wacker F, Hohlfeld J. Flow volume loop and regional ventilation assessment using phase‐resolved functional lung (PREFUL) MRI: Comparison with 129xenon ventilation MRI and lung function testing. Journal of Magnetic Resonance Imaging. 2021 Apr;53(4):1092-105.
Figures
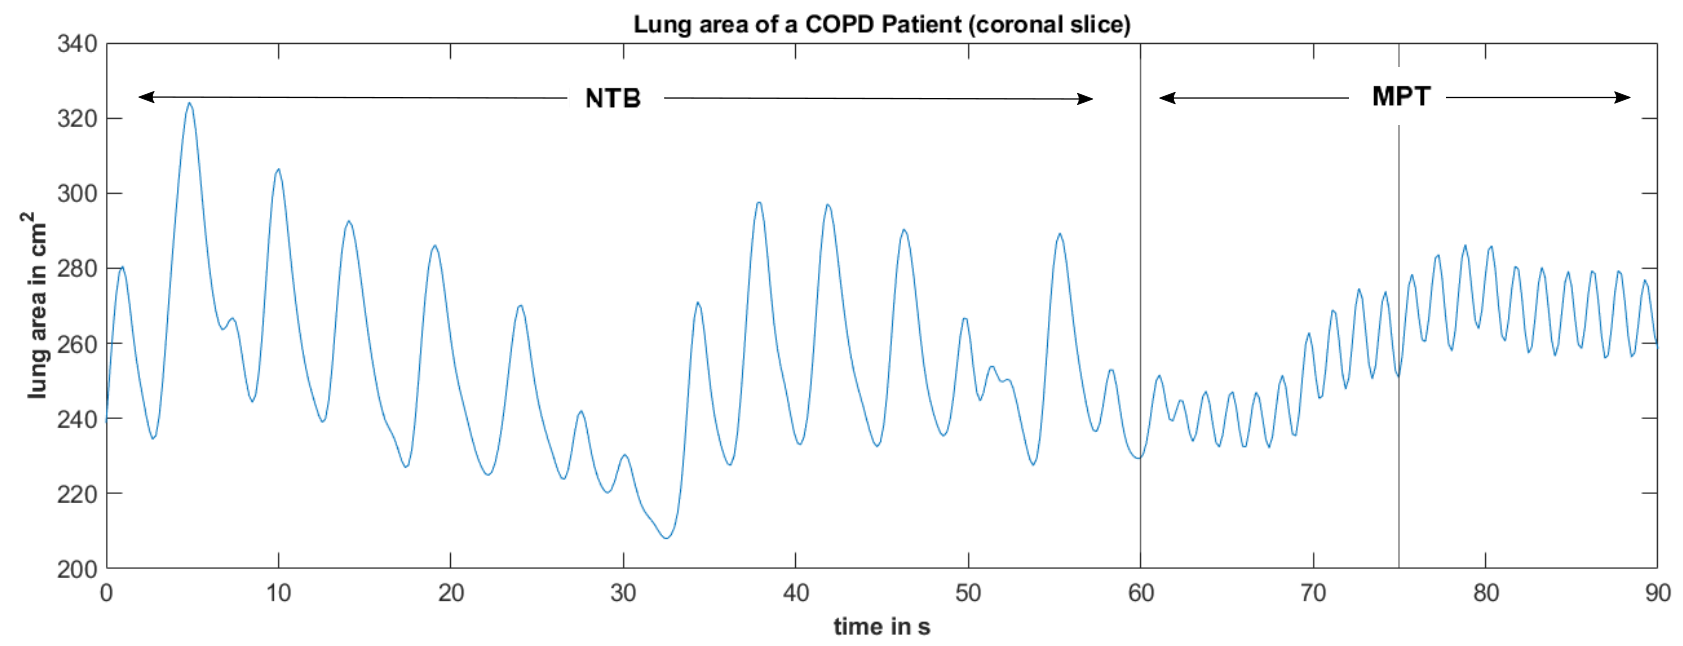
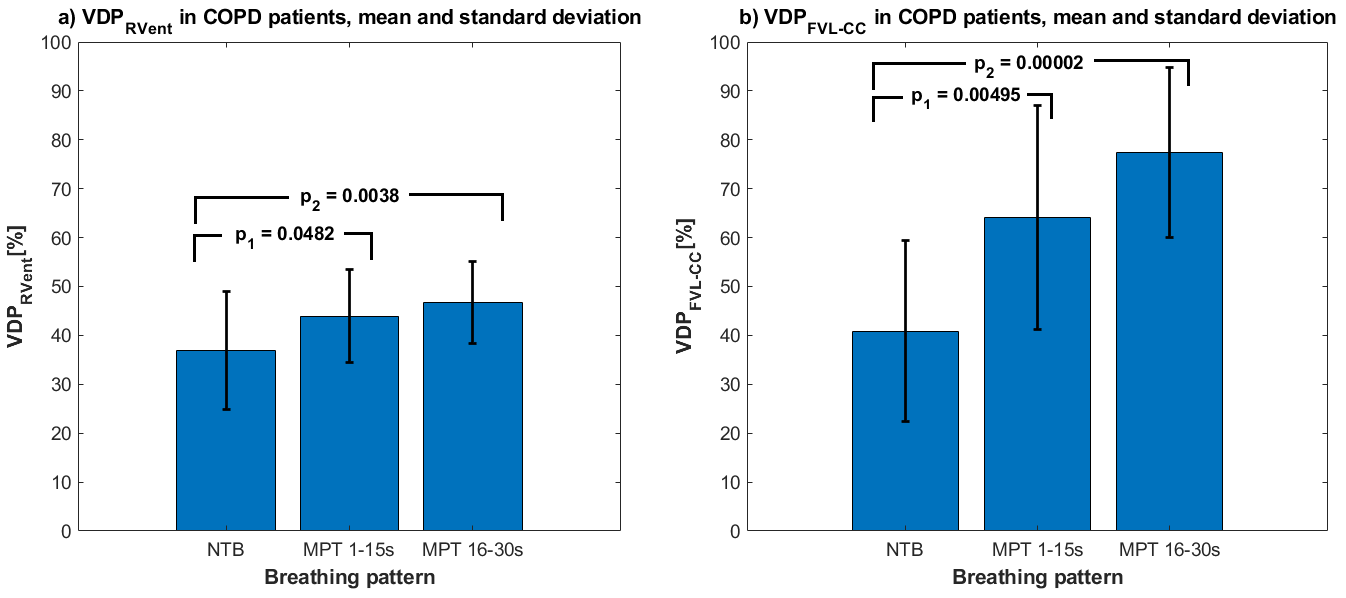
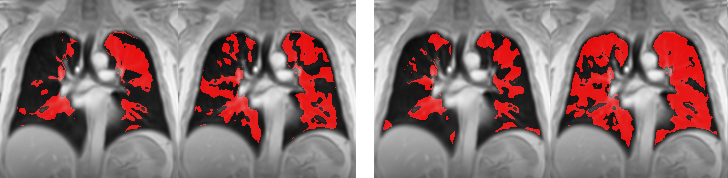
Figure 3: VDPRVent (left) and VDPFVL-CC (right) maps for normal tidal breathing (NTB) and metronome-paced tachypnea (MPT, 16-30s) of a COPD patient (57-years old, male, FEV1%pred.: 38.8%). Ventilation defects are marked with red colour. Please note a significant increase of ventilation defects during the second part of MPT breathing maneuver.