1482
Examining lung microstructure using 19F MR diffusion imaging in COPD patients
Arnd Jonathan Obert1,2, Marcel Gutberlet1,2, Agilo Luitger Kern1,2, Till Frederik Kaireit1,2, Julian Glandorf1,2, Tawfik Moher Alsady1,2, Frank Wacker1,2, Jens M. Hohlfeld2,3,4, and Jens Vogel-Claussen1,2
1Institute for Diagnostic and Interventional Radiology, Hannover Medical School, Hannover, Germany, 2Biomedical Research in Endstage and Obstructive Lung Disease Hannover (BREATH), German Center for Lung Research (DZL), Hannover, Germany, 3Department of Respiratory Medicine, Hannover Medical School, Hannover, Germany, 4Department of Clinical Airway Research, Fraunhofer Institute for Toxicology and Experimental Medicine, Hannover, Germany
1Institute for Diagnostic and Interventional Radiology, Hannover Medical School, Hannover, Germany, 2Biomedical Research in Endstage and Obstructive Lung Disease Hannover (BREATH), German Center for Lung Research (DZL), Hannover, Germany, 3Department of Respiratory Medicine, Hannover Medical School, Hannover, Germany, 4Department of Clinical Airway Research, Fraunhofer Institute for Toxicology and Experimental Medicine, Hannover, Germany
Synopsis
Diffusion of fluorinated gas in the short-time regime was measured using multiple gradient echo sequences with a single pair of trapezoidal gradient pulses. Pulmonary alveolar surface-to-volume ratio (S/V) was calculated using a first-order approximation of the time-dependent diffusion in a study with 20 healthy volunteers and 22 patients with chronic obstructive pulmonary disease (COPD). Median surface-to-volume ratio is significantly decreased in COPD patients compared to healthy volunteers (P<.0001). No significant difference was found between measurements within 7 days. Linear correlations were found with S/V from hyperpolarized 129Xe MRI (r=0.85, P=.001) and the forced expiratory volume in one second (r=0.68, P<.0001).
Introduction
Early detection and adequate phenotyping are highly desirable for diagnosis and treatment of COPD1,2. Therefore, MRI of inhaled fluorinated gas provides a cost-effective and non-invasive tool for direct ventilation measurement in the human lung3. Examining the gas diffusion behavior allows for quantification of pulmonary alveolar surface-to-volume ratio (S/V) which quantifies lung microstructure for assessing e.g. emphysematous changes in COPD4,5.Methods
In this study, 20 healthy volunteers and 22 patients with COPD (GOLD stage I – III) were examined on a 1.5 T scanner. The study participants inhaled a mixture of 79% C3F8 and 21% O2 for nine breath-holds with a fixation of the inhaled gas volume to 1/8 inspiratory vital capacity. During the first eight breath-holds (duration 6 seconds each), ventilation imaging was performed using a 3D gradient echo pulse sequence with golden-angle stack-of-stars k-space encoding. During the ninth breath-hold, four images were acquired for S/V mapping in a single breath-hold (duration 14 seconds). Three images were diffusion weighted using additional 3D trapezoidal gradients with a fixed b-value (b = 12.59 s/cm2), fixed gradient pulse length (δ = 1 ms), and varying diffusion times (Δ = 6 ms, 4 ms, 2 ms) and gradient strengths, respectively (|G| = [18.7, 23.3, 34.6] 10-5 T/cm). The first image was acquired without diffusion weighting as a reference.All patients underwent spirometry and 19F MR imaging on the same day and a second 19F MR scan after maximum 7 days for repeatability measurement. Hyperpolarized 129Xe diffusion-weighted MR imaging was performed in 11 COPD patients prior to the first 19F imaging session using a stack-of-spirals sequence as previously described 6. Detailed information on the imaging parameters is provided in table 1.
19F ventilation images were reconstructed using the parallel imaging and compressed sensing algorithm of the BART toolbox7. In order to counter the low SNR, total variation and directional total variation to the eighth ventilation image were regularized when reconstructing the diffusion weighted images.8,9
To obtain S/V maps, the diffusion weighted images (S) were divided by the unweighted image (S0) followed by voxel-wise fitting to the first-order approximation of the model function for apparent diffusion in a porous medium $$ \frac{S}{S_0} = \exp{\left(-b\cdot D_{app}\right)} = \exp{\left( -b\cdot D_0 \left( 1 - \frac{\alpha}{3}\frac{S}{V}\sqrt{D_0\Delta}\right)\right)}, $$ where α is a prefactor compensating for the deviation from the narrow-pulse approximation10,11. Since the free diffusion D0 depends on the ratio of C3F8 to O2 in the specific voxel, its value was also determined within the fit procedure12.
Results
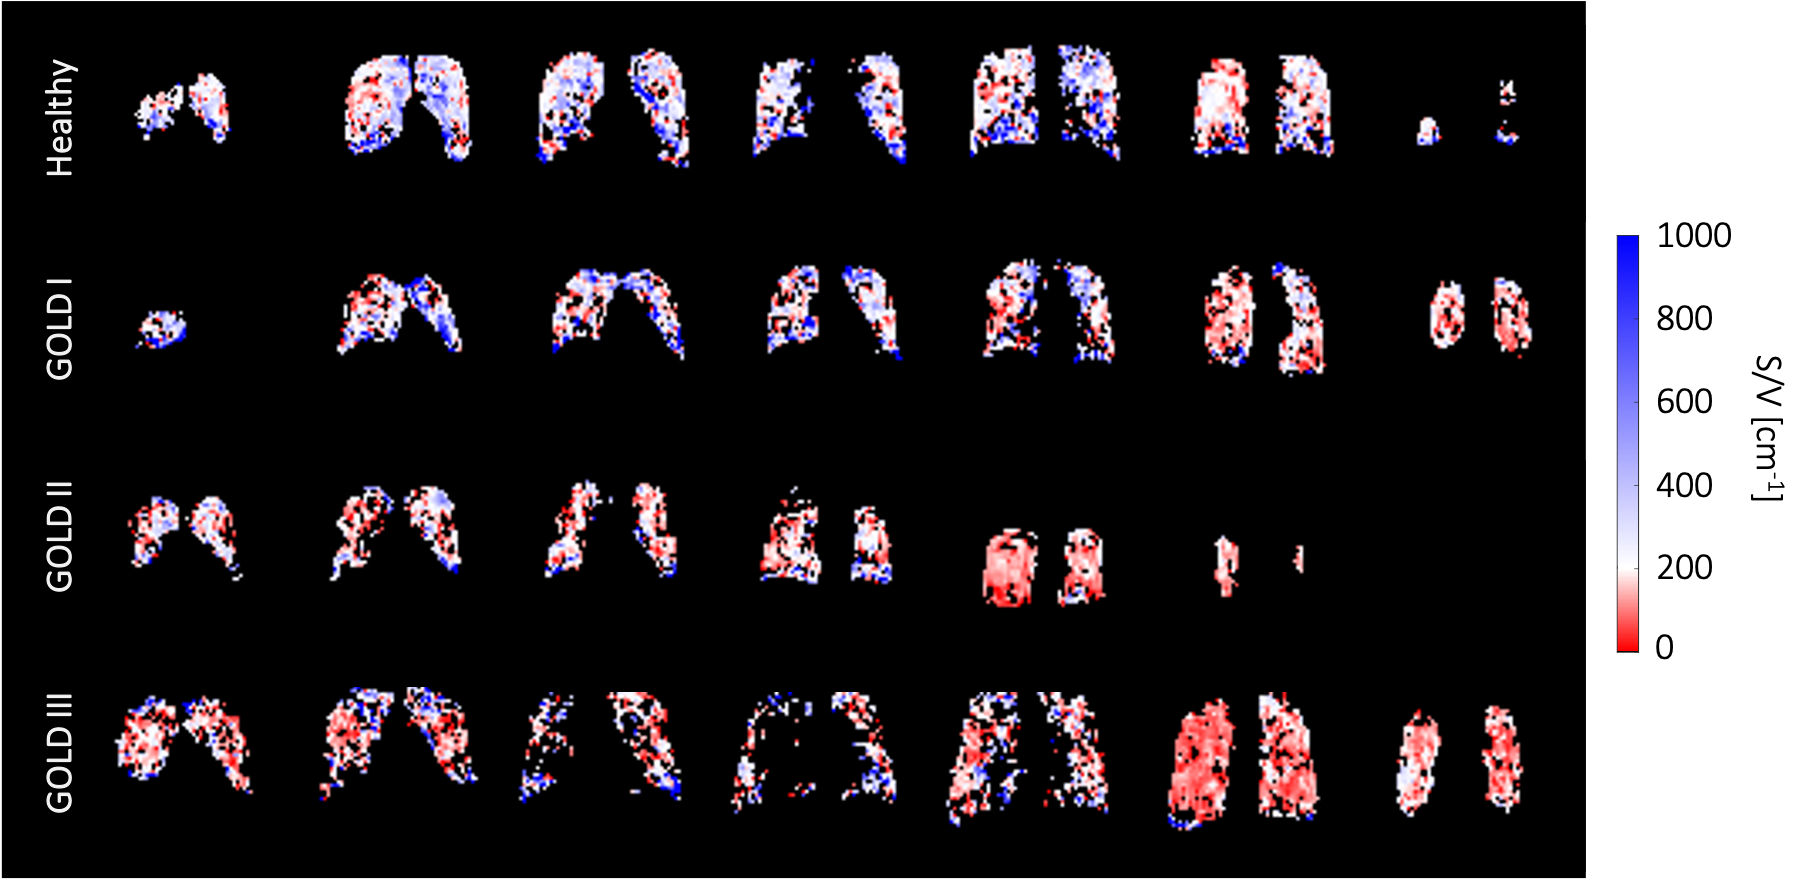
Fluorinated gas imaging procedures and maneuvers were well tolerated and no adverse events were reported. Results are stated as medians over the whole lung with first and third quartile, unless otherwise stated.S/V maps from exemplary patients can be found in figure 1, S/V values in different stages of COPD are shown in figure 2.
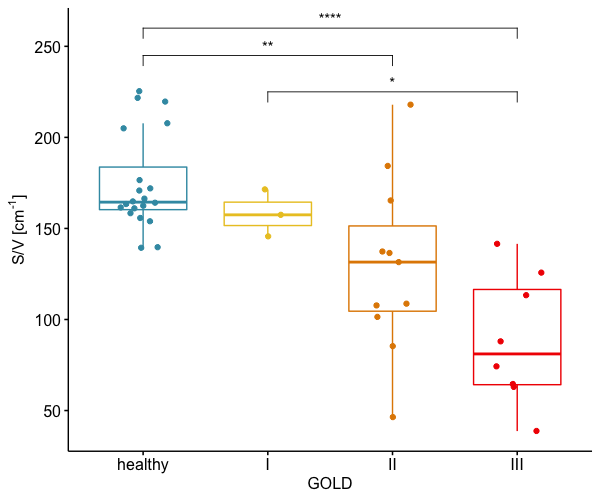
The median S/V was 164 cm-1 (160 cm-1 – 184 cm-1) in healthy volunteers, 157 cm-1 (152 cm-1 – 164 cm-1) in COPD patients with GOLD stage I, 132 cm-1 (105 cm-1 – 151 cm-1) in COPD patients with GOLD stage II, and 81 cm-1 (64 cm-1 – 116 cm-1) in COPD patients with GOLD stage III. Taken together, patients with COPD had a median S/V of 126 cm-1 (87 cm-1 – 144 cm-1).
Significant differences could be found between healthy volunteers and patients with GOLD II (P = .007), between patients with GOLD I and GOLD III (P = .025), and between healthy volunteers and patients with GOLD III (P < .0001). A significant difference in S/V was measured between healthy volunteers and COPD patients (P < .0001).
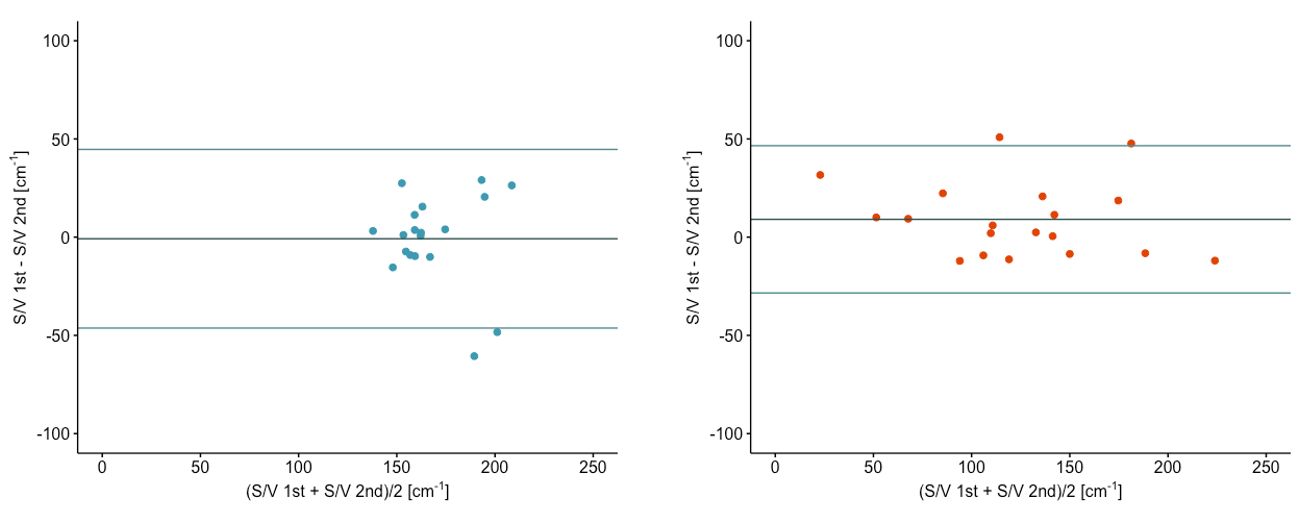
Bland-Altman plots comparing measurements on the first and the second scan day are shown in figure 3. No significant differences for S/V values between first and second scan could be found in any of the patient groups. The Bland-Altman plots show a mean bias of 0.8 cm-1 and the 95% limits of agreement of ± 45 cm-1 for healthy volunteers as well as a mean bias of 9 cm-1 and 95% limits of agreement of ± 37 cm-1 for COPD patients. The median coefficient of variation between first and second measurement for healthy volunteers was 4.3% and for COPD patients 6.7%.
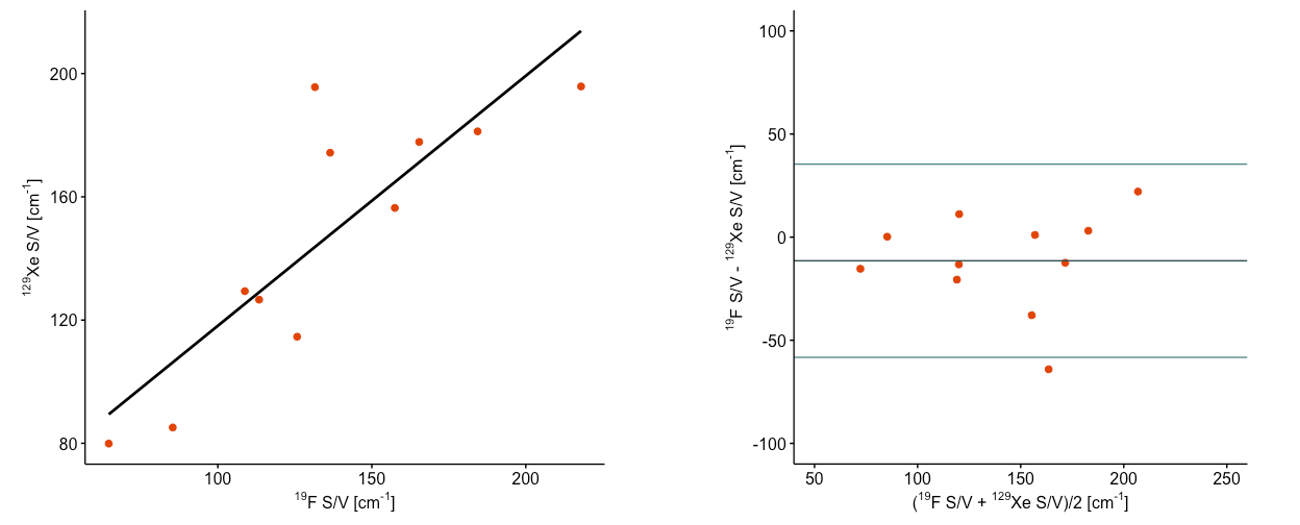
For 11 COPD patients, a strong linear correlation between median S/V values measured with 19F and 129Xe could be found (r = 0.85, P = .001). Bland-Altman plot analysis shows a non-significant bias of -11 cm-1 (P = .145) and the 95% limits of agreement of ± 47 cm-1. Correlation and Bland-Altman plots are shown in figure 4.
A moderate linear correlation between 19F S/V values and the predicted forced expiratory volume in one second (FEV1) could be found in all examined subjects (r = 0.68, P < .0001). A correlation plot is shown in figure 5.
Discussion and Conclusion
Although the sequence design was rather simple, this study shows the general feasibility and the good repeatability of in vivo S/V mapping with 19F diffusion MRI. The provided values seem to be reasonable using the proposed theoretical model and sequence design when compared to measurements from 129Xe and spirometry as well as literature values for histological studies and CT imaging13–15.Acknowledgements
This work was supported by the German Center for Lung Research (DZL) and the Fritz Behrens Foundation. The authors thank Frank Schröder, Melanie Pfeifer, and Cheng-Kai Huang for experimental support, as well as E. Tobias Krause for in-depth advice on statistical evaluation.References
1. Laucho-Contreras ME, Cohen-Todd M. Early diagnosis of COPD: myth or a true perspective. European Respiratory Review. 2020;29(158):200131. doi:10.1183/16000617.0131-20202. Lange P, Halpin DM, O’Donnell DE, MacNee W. Diagnosis, assessment, and phenotyping of COPD: beyond FEV₁. International journal of chronic obstructive pulmonary disease. 2016;11 Spec Is(Spec Iss):3–12. doi:10.2147/COPD.S85976
3. Couch MJ, Ball IK, Li T, Fox MS, Littlefield SL, Biman B, Albert MS. Pulmonary Ultrashort Echo Time 19F MR Imaging with Inhaled Fluorinated Gas Mixtures in Healthy Volunteers: Feasibility. Radiology. 2013;269(3):903–909. doi:10.1148/radiol.13130609
4. Itoh H, Nishino M, Hatabu H. Architecture of the Lung: Morphology and Function. Journal of Thoracic Imaging. 2004;19(4).
5. Thurlbeck WM. Internal surface area and other measurements in emphysema. Thorax. 1967;22(6):483–496. doi:10.1136/thx.22.6.483
6. Kern AL, Gutberlet M, Moher Alsady T, Welte T, Wacker F, Hohlfeld JM, Vogel-Claussen J. Investigating short-time diffusion of hyperpolarized 129Xe in lung air spaces and tissue: A feasibility study in chronic obstructive pulmonary disease patients. Magnetic Resonance in Medicine. 2020;84(4):2133–2146. doi:https://doi.org/10.1002/mrm.28264
7. Uecker M, Ong F, Tamir JI, Bahri D, Virtue P, Cheng JY, Lustig M. Berkeley advanced reconstruction toolbox. Proc. Intl. Soc. Mag. Reson. Med. 2015;23:2486. doi:10.1002/mrm.25176
8. Obert AJ, Gutberlet M, Kern AL, Kaireit TF, Grimm R, Wacker F, Vogel-Claussen J. 1H-guided reconstruction of 19F gas MRI in COPD patients. Magnetic Resonance in Medicine. 2020. doi:10.1002/mrm.28209
9. Ehrhardt MJ, Betcke MM. Multicontrast MRI Reconstruction with Structure-Guided Total Variation. SIAM Journal on Imaging Sciences. 2016;9(3):1084–1106. doi:10.1137/15M1047325
10. Mitra PP, Sen PN, Schwartz LM. Short-time behavior of the diffusion coefficient as a geometrical probe of porous media. Physical Review B. 1993;47(14):8565–8574. doi:10.1103/PhysRevB.47.8565
11. Miller GW, Carl M, Mata JF, Cates GD, Mugler JP. Simulations of Short-Time Diffusivity in Lung Airspaces and Implications for S/V Measurements Using Hyperpolarized-Gas MRI. IEEE Transactions on Medical Imaging. 2007;26(11):1456–1463. doi:10.1109/TMI.2007.903192
12. Chang Y V., Conradi MS. Relaxation and diffusion of perfluorocarbon gas mixtures with oxygen for lung MRI. Journal of Magnetic Resonance. 2006;181(2):191–198. doi:10.1016/j.jmr.2006.04.003
13. Coxson HO, Rogers RM, Whittall KP, D’Yachkova Y, Paré PD, Sciurba FC, Hogg JC. A Quantification of the Lung Surface Area in Emphysema Using Computed Tomography. American Journal of Respiratory and Critical Care Medicine. 1999;159(3):851–856. doi:10.1164/ajrccm.159.3.9805067
14. Yablonskiy DA, Sukstanskii AL, Woods JC, Gierada DS, Quirk JD, Hogg JC, Cooper JD, Conradi MS. Quantification of lung microstructure with hyperpolarized 3He diffusion MRI. Journal of Applied Physiology. 2009;107(4):1258–1265. doi:10.1152/japplphysiol.00386.2009
15. West JB. Respiratory physiology: the essentials. Lippincott Williams & Wilkins; 2012.
Figures
Figure
1: Exemplary S/V maps for a healthy volunteer (top), COPD patient with GOLD stage I
(2nd row), with GOLD stage II (3rd row), and with GOLD stage III
(bottom).
Figure
2: Median S/V values for healthy volunteers and COPD patients with different
GOLD stages. Statistically significant differences could be found between healthy volunteers and patients with GOLD stage II (P = .007), healthy volunteers and
patients with GOLD stage III (P < .0001), as well as patients with GOLD stage I and GOLD
stage III (P = .025).
Figure
3: Bland-Altman plots for repetition of S/V measurements after maximum 7 days
for healthy volunteers (left) and COPD patients (right). Horizontal lines show
the mean bias as well as the 95% limits of agreement.
Figure
4: Comparison of median S/V values measured with 19F and 129Xe.
Left: Linear correlation (r = 0.85, P = .001). Right: Bland-Altman plot.
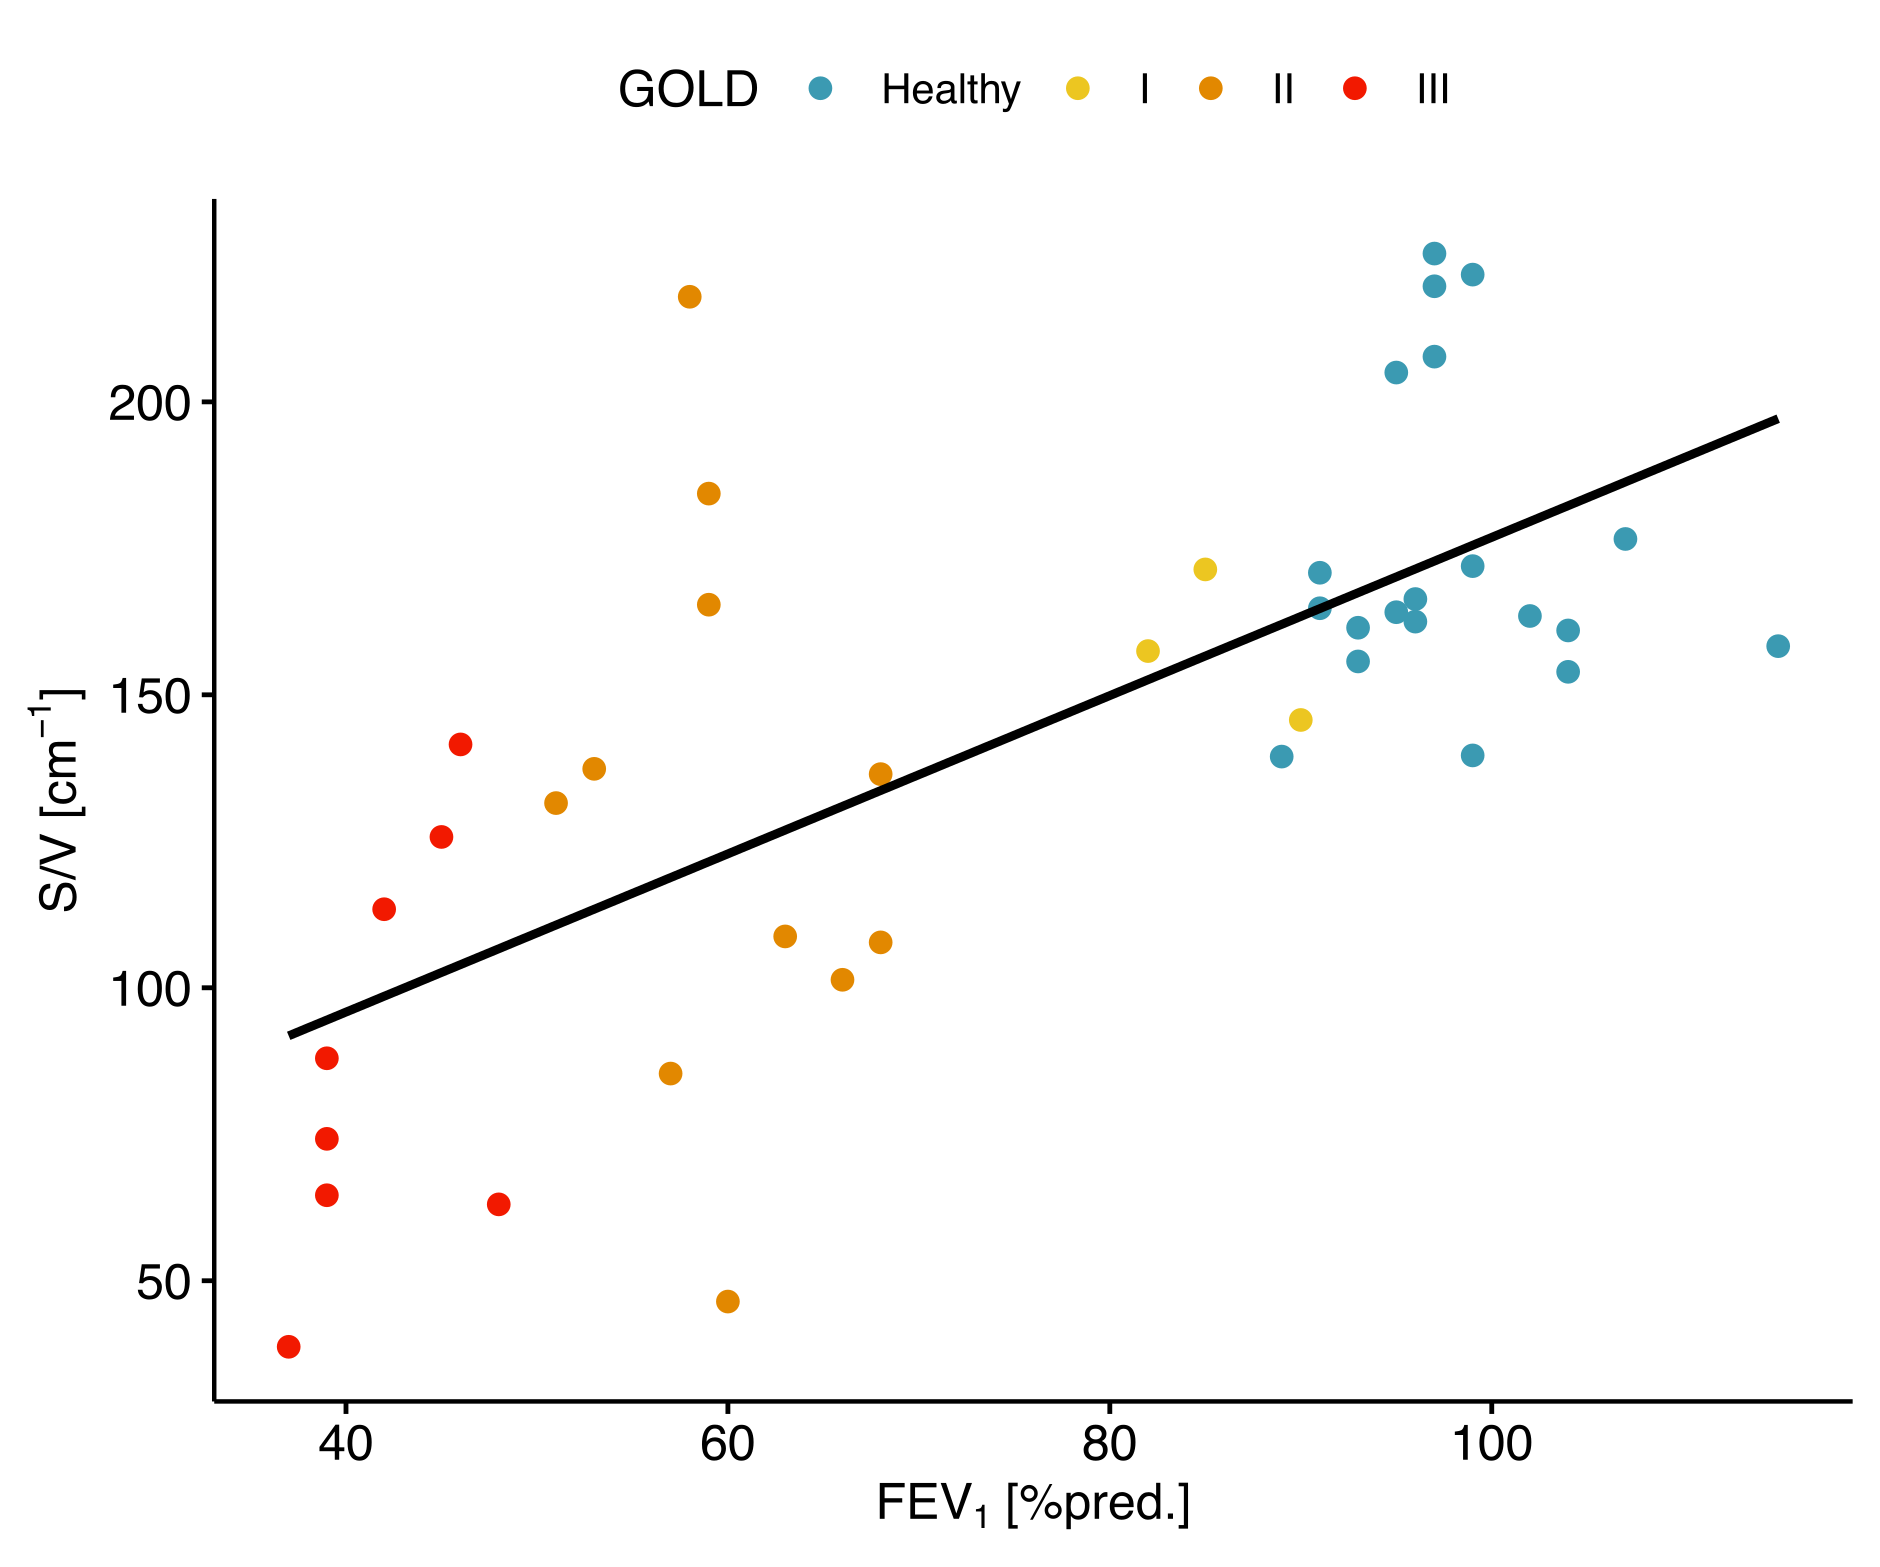
Figure
5: Linear correlation between median S/V from 19F MRI and FEV1%pred. from spirometry (r = 0.68, P < .001)
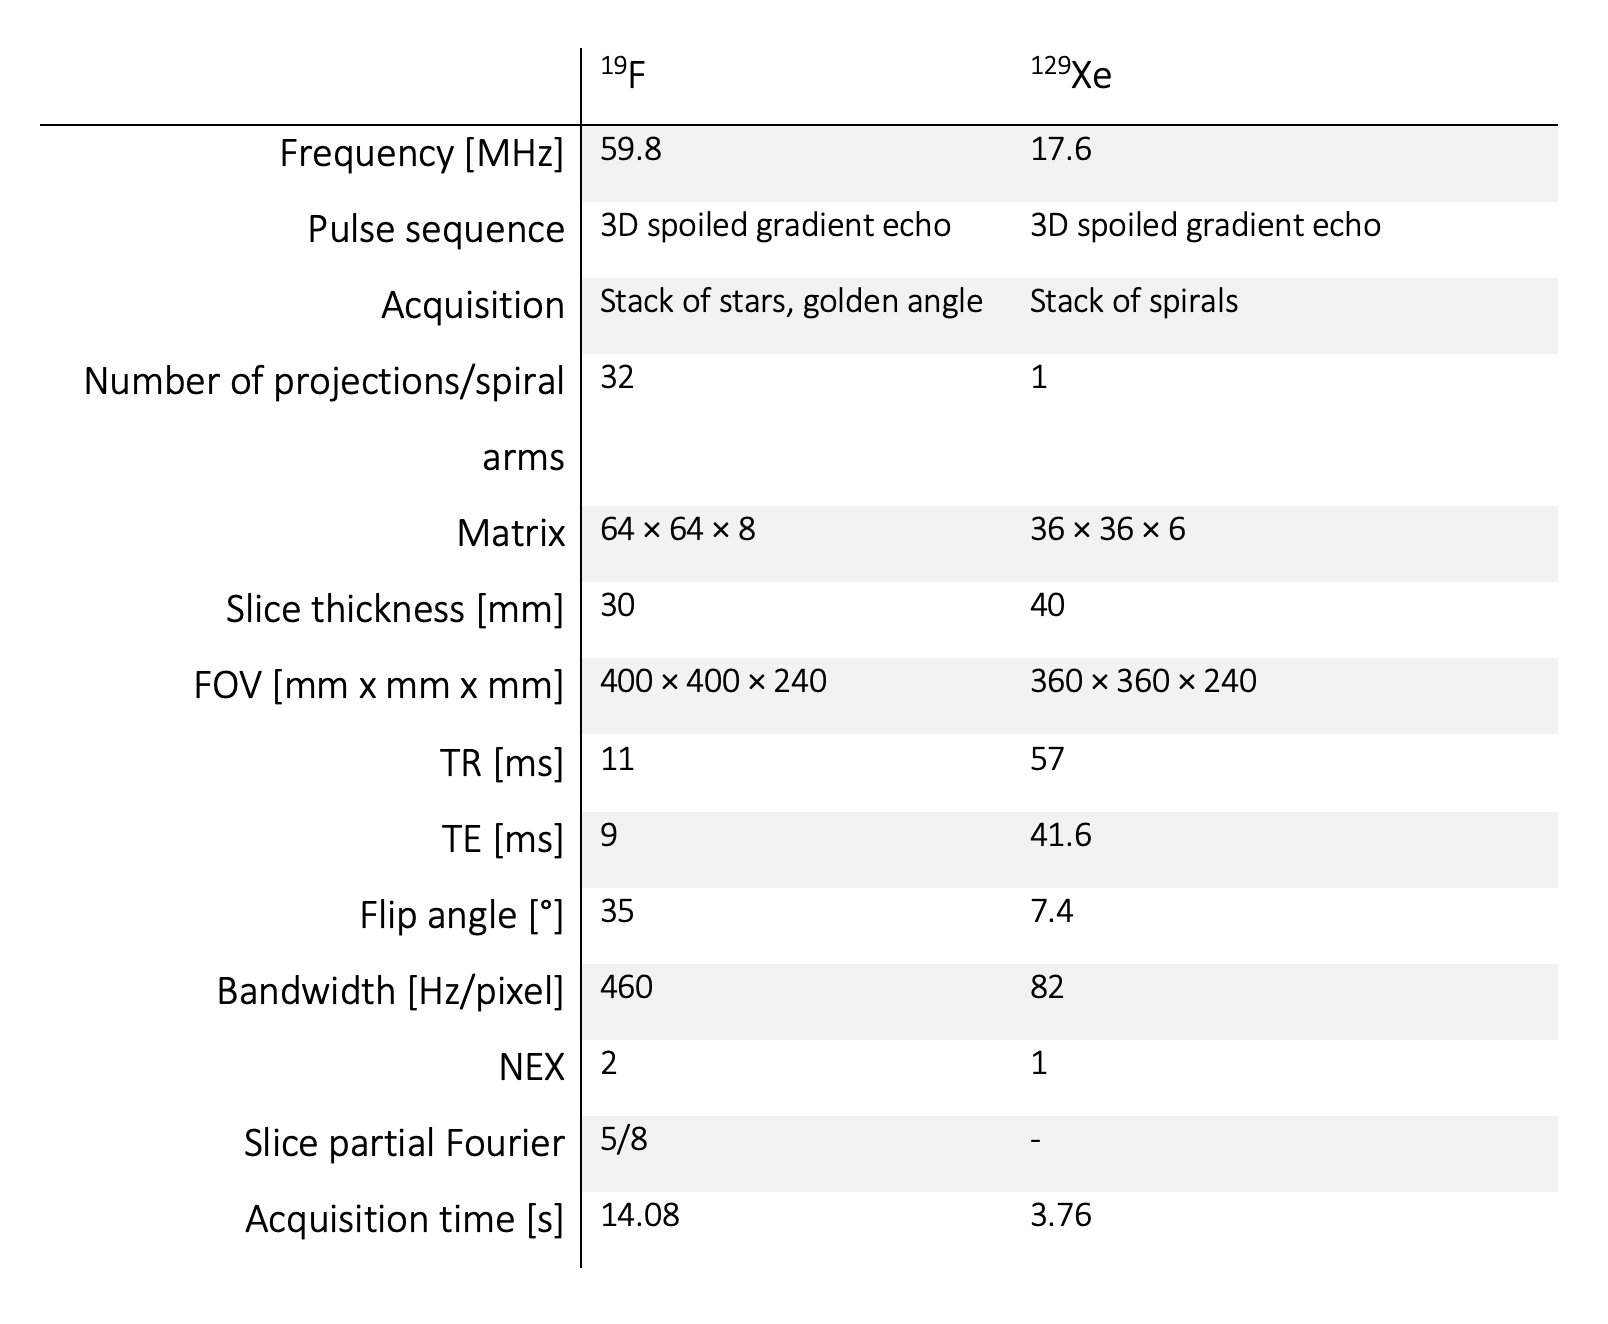
Table 1: Detailed
scanning parameters for 19F and 129Xe diffusion weighted imaging.
DOI: https://doi.org/10.58530/2022/1482