1481
Oxygen-enhanced MRI of the lung at 3 tesla: R2* contrast in smokers and non-smokers1Centre for Medical Image Computing (CMIC), University College London, London, United Kingdom, 2Bioxydyn Limited, Manchester, United Kingdom, 3BHF Manchester Centre for Heart and Lung Magnetic Resonance Research (MCMR), Manchester University NHS Foundation Trust, Manchester, United Kingdom, 4Philips, Farnborough, United Kingdom, 5Division of Cancer Sciences, University of Manchester, Manchester, United Kingdom, 6Division of Radiotherapy and Imaging, Institute of Cancer Research, London, United Kingdom
Synopsis
T1-weighted dynamic lung OE-MRI is challenging at 3 T using gradient echo acquisitions due to decreased T1 relaxivity of oxygen and substantial ∆R2* contribution. We implemented a dual echo T1-FFE-based method at 3 T and evaluated signal enhancement behaviour and ∆R2*. The proposed method is shown to produce negative contrast on oxygen enhancement signal due to dominance of ∆R2* at TE larger than 0.4 ms. We also demonstrated that the contrast property of the percentage signal enhancement (PSE) is TE dependent. Longer TE enables differentiation on PSE values between non-smokers and smokers.
Introduction
Oxygen-enhanced MRI (OE-MRI) has shown potential for evaluating regional lung function at field strengths of 1.5 tesla (T) or lower1-5. However, standard methodologies for lung OE-MRI have not been established at 3 T6, which limits the ability to deploy OE-MRI. T1 relaxivity of oxygen decreases at higher field strengths, which is expected to hamper the sensitivity of the commonly-used ∆R1-based OE-MRI signal7. Furthermore, if using gradient echo-based methods, the competing ∆R2* effect becomes substantial and dominates over the ∆R1 effect at 3 T, even at short TE8. We aimed to (1) investigate a dual-echo gradient echo method for detecting OE signal change and ∆R2* effect at 3 T; (2) evaluate the utility of this technique by comparing non-smokers with smokers.Subjects & Methods
The expected signal differences in the lung were simulated as a function of TE9 using the following parameters: FA = 5°; TR = 16 ms; T1 (21% O2)10 = 1281 ms, T1 (100% O2)10 = 1102 ms. T2* (21% O2) = 0.64 ms and T2* (100% O2) = 0.60 ms were calculated from this study (mean T2* of non-smokers).After local ethical approval, 8 healthy volunteers (5 males and 3 females, age range = 26-49 years, median = 32; 4 non-smokers and 4 current smokers) with no previous record of lung diseases provided signed informed consent and underwent lung MRI on a 3 T whole-body scanner (Philips Ingenia). Subjects breathed medical air (21% O2) and 100% O2 via non-rebreathing face mask (Intersurgical Ltd., Wokingham, UK) at a flow rate of 15 Lmin-1.
Six 10 mm-thick coronal slices (4 mm gap) were positioned posteriorly in the chest and initial 60 dynamic acquisitions were obtained with breathing medical air using a 2D dual echo RF spoiled T1-fast field echo (T1-FFE) sequence. The gas supply was then switched to 100% O2 for the following 150 dynamic acquisitions, after which the supply was returned to medical air for further 130 acquisitions. Other scanning parameters: TR = 16 ms, TE1 = 0.71 ms; TE2 = 1.2 ms FA = 5°, matrix size = 96×96, pixel size = 4.69 mm x 4.69 mm and dynamic temporal resolution = 1.54 s. Total scanning time was approximately 9 min. Images were acquired during free breathing.
Lung images were registered automatically to a mean lung position using ANTs11-12. The lung parenchyma, excluding central major vasculature, was manually segmented from registered images. Analysis was performed in MATLAB R2021b (MathWorks, Natick, MA). Percent signal enhancement (PSE) maps were calculated by the subtraction of averaged hyperoxia images (61st to 210th) from averaged normoxia images (1st to 60th), normalized to the averaged normoxia images, following image registration. This was done twice, with and without correction for tissue density using a voxel-wise correction method.
R2* at each time point was calculated. Subsequently, mean ∆R2* maps were calculated by the subtraction of averaged normoxia R2* maps (10th to 60th) from averaged hyperoxia R2* maps (90th to 210th).
Results
Simulations show that at TE > 0.4 ms, ∆T2* dominates the signal change and produces negative contrast (Fig 1). The expected OE signal change at TE1 (0.71 ms) is about 50 % more sensitive to changes in ∆T1 and about 20 % more sensitive to changes in ∆T2* than a scan with TE2 (1.2 ms).While mean PSE at both TEs shows clear O2 delivery in the entire lung, maps at TE2 display greater contrast than for TE1 (Fig 2A, 2C). Note that map polarity is reversed for display purposes. Representative time course plots of mean PSE exhibit negative contrast due to 100% O2 inhalation (Fig 2B, 2D), in agreement with the simulated results. Mean PSE values between non-smoker and current smoker groups are not significantly different at TE1 whereas they are significantly different at TE2 (Fig 3) (p = 0.019, student’s t-test).
Baseline R2* maps of six slices show reasonable R2* values on a voxel-by-voxel basis (Fig 4A). Mean ∆R2* maps (Fig 4B) illustrate clear O2 delivery in the entire lung. Representative mean R2* time course plots show the positive contrast of R2* enhancement due to 100% O2 inhalation (Fig 4C). Mean lung ∆R2* is significantly greater for non-smokers than for current smokers (p = 0.005, student’s t-test) (Fig 5).
Discussion
Negative PSE at gradient echo TE longer than 0.4 ms is due to the significant oxygen-level dependent ∆R2* effect dominating the signal change in the lung. Our results show the greater PSE at 1.2 ms than 0.71 ms, suggesting that PSE at shorter TE is affected by both ∆T1 and ∆T2*, whereas PSE at longer TE becomes more purely ∆T2* dependent. PSE measurements at longer TE are sensitive to smoking status, possibly indicating ventilation-related differences in lungs.Conclusions
We have implemented a new lung OE-MRI method at 3 T using a dual echo T1-FFE-based sequence and evaluated signal enhancement behaviour in the lung. This method enabled a differentiation of lung characteristics between non-smokers and smokers, suggesting a potential utility in clinical studies.Acknowledgements
This work is supported by the Cancer Research UK National Cancer Imaging Translational Accelerator (NCITA) awards C1519/A28682 (UCL) and C19221/A28683 (University of Manchester), by the EPSRC-funded UCL Centre for Doctoral Training in Medical Imaging (EP/L016478/1), and by Innovate UK award 104629. We thank Lucy Caselton for the technical assistance.
References
1. Edelman RR et al. Noninvasive assessment of regional ventilation in the human lung using oxygen–enhanced magnetic resonance imaging. Nat Med. 1996; 2: 1236–1239.
2. Dietrich O et al. Fast oxygen-enhanced multislice imaging of the lung using parallel acquisition techniques. Magn Reson Med. 2005; 53: 1317–1325.
3. Ohno Y et al. Oxygen-enhanced MR imaging: correlation with postsurgical lung function in patients with lung cancer. Radiology. 2005; 236: 704–711.
4. Naish JH et al. Improved quantitative dynamic regional oxygen-enhanced pulmonary imaging using image registration. Magn Reson Med. 2005; 54: 464–469.
5. Bhattacharya I et al. Oxygen‐enhanced functional lung imaging using a contemporary 0.55 T MRI system. NMR in Biomedicine. 2021; 34(8), 1–10.
6. Ohno Y et al. 3D Oxygen-Enhanced MRI at 3T MR System: Comparison With Thin-Section CT of Quantitative Capability for Pulmonary Functional Loss Assessment and Clinical Stage Classification of COPD in Smokers. J Magn Reson Imaging. 2021; Apr;53(4):1042-1051.
7. Mirhej ME. Proton spin relaxation by paramagnetic molecular oxygen. Can J Chem. 1965;43(5):1130-1138.
8. Pracht ED et al. Oxygen-enhanced proton imaging of the human lung usingT2*. Magn Reson Med. 2005; 53(5), 1193–1196.
9. Kruger SJ et al. Oxygen-enhanced 3D radial ultrashort echo time magnetic resonance imaging in the healthy human lung. NMR Biomed. 2014; Dec;27(12):1535-41.
10. Dietrich et al. Oxygen-enhanced MRI of the lung at 3 Tesla: Feasibility and T1 relaxation times. Proc Intl Soc Magn Reson Med. 2006; 14: 1307.
11. Avants BB et al. Symmetric diffeomorphic image registration with cross-correlation: evaluating automated labeling of elderly and neurodegenerative brain. Med Image Anal. 2008;12(1):26-41.
12. Avants BB et al. A reproducible evaluation of ANTs similarity metric performance in brain image registration. NeuroImage. 2011;54(3):2033-2044.
Figures
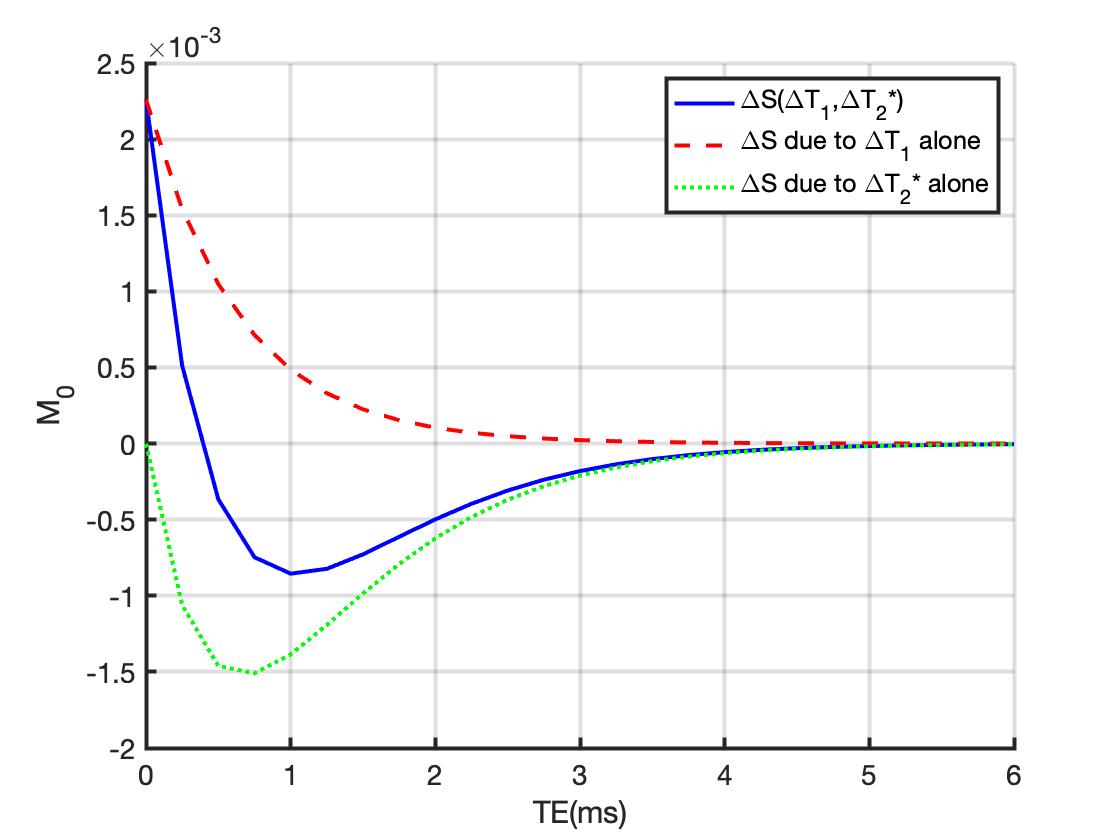
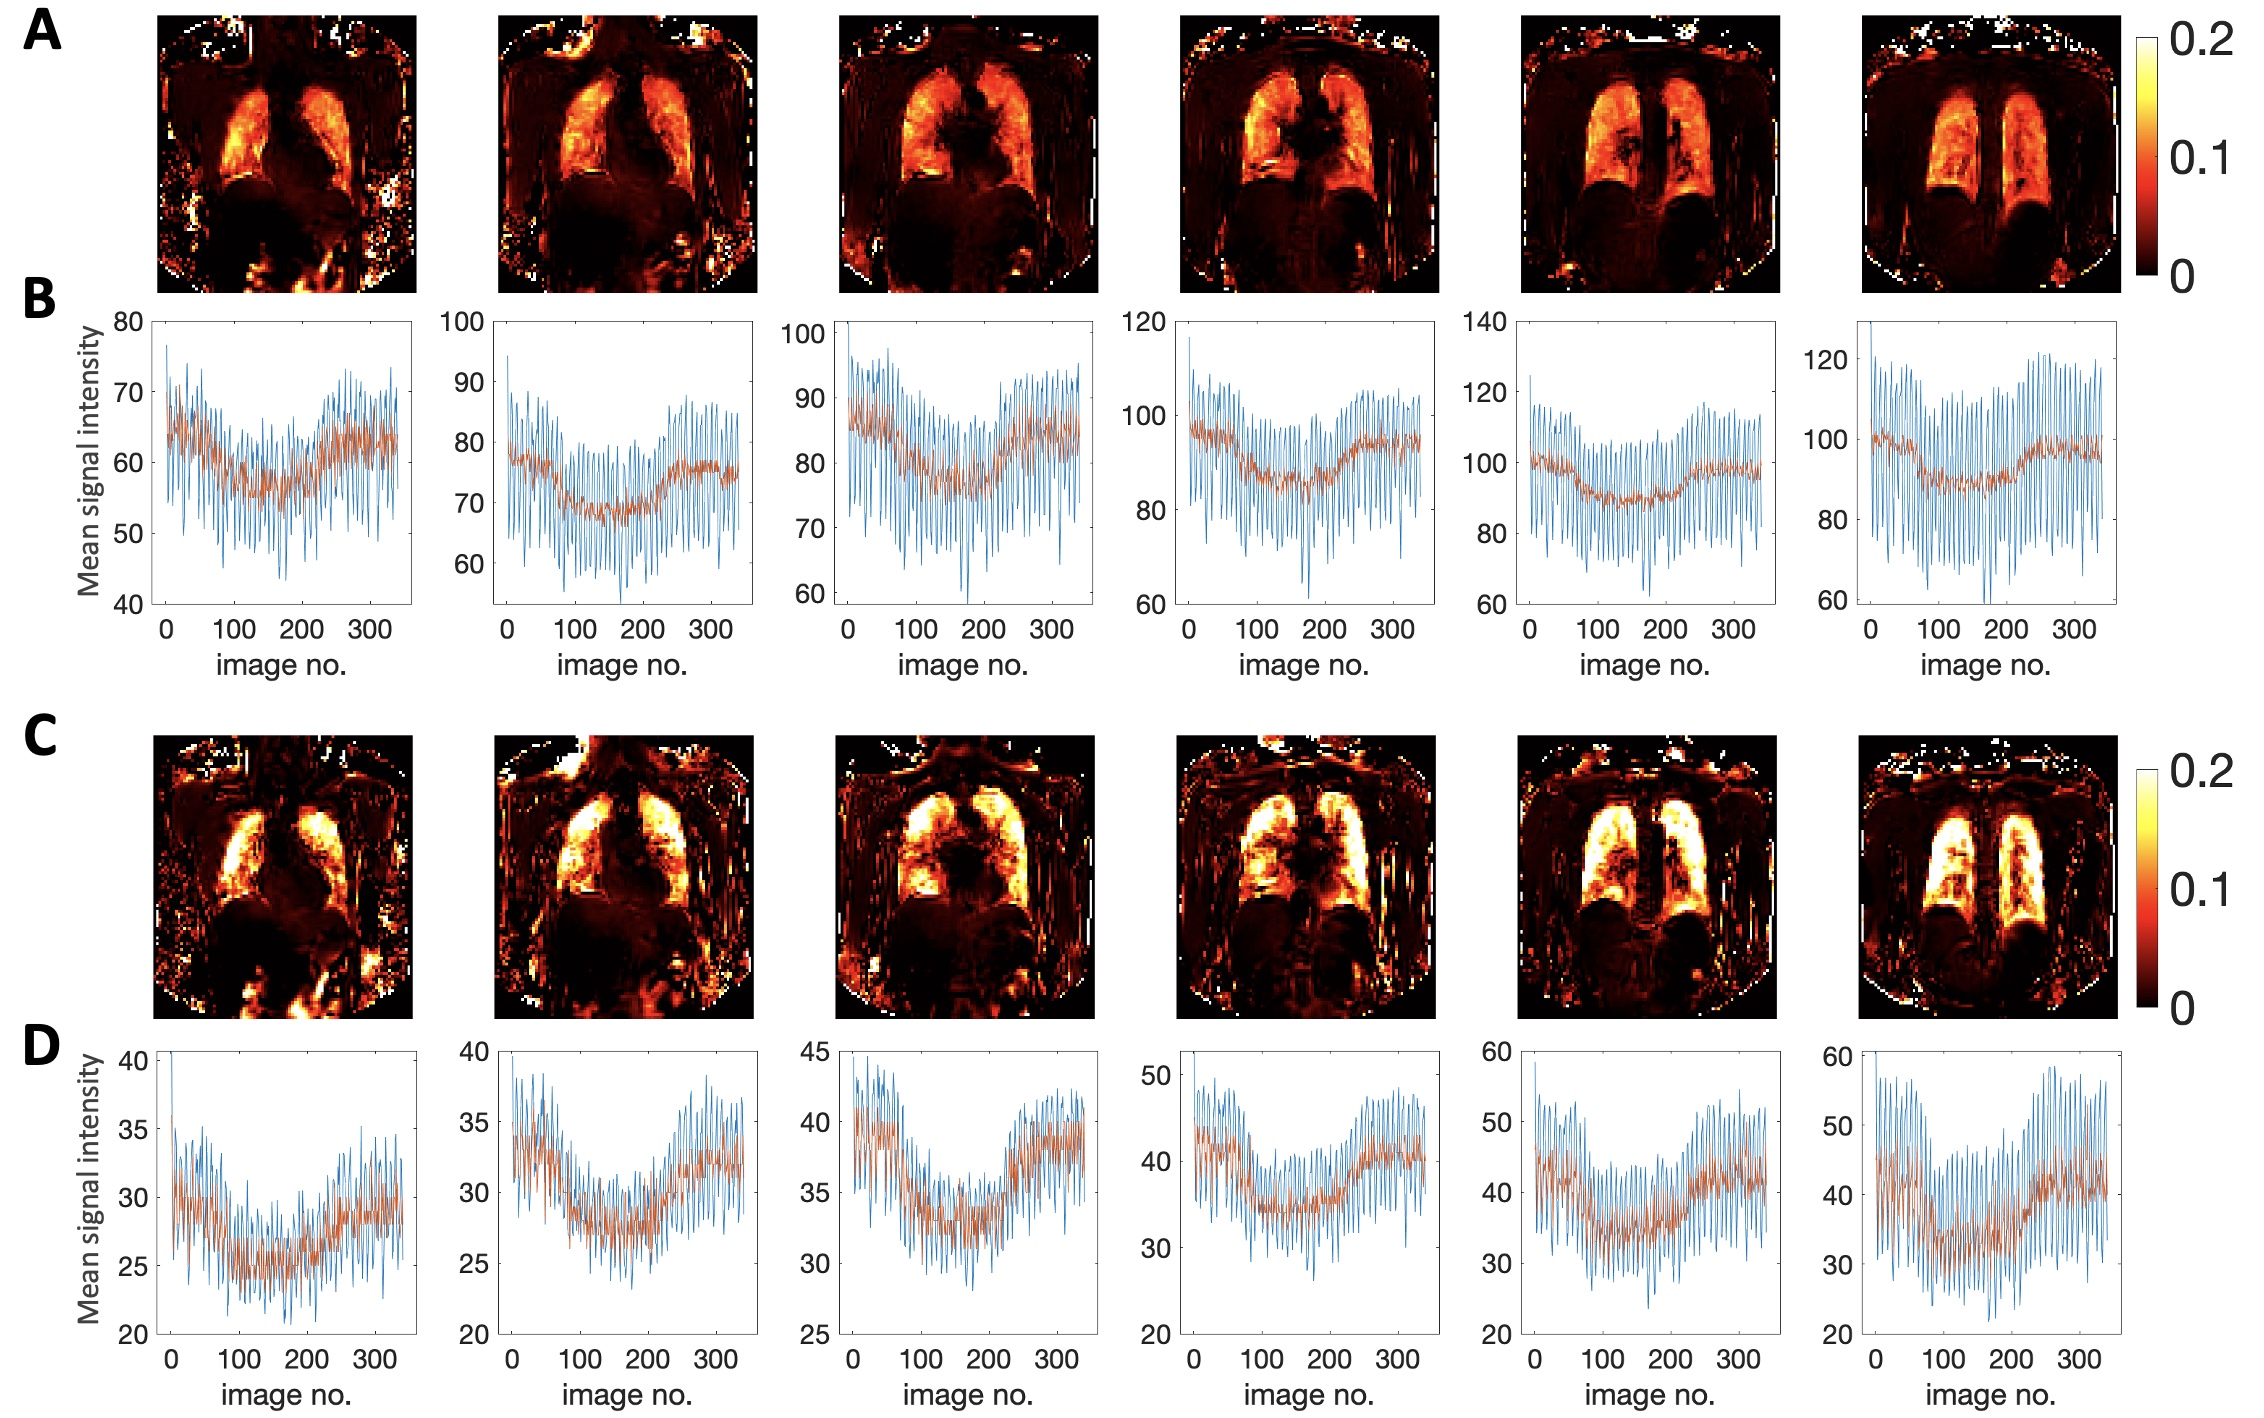
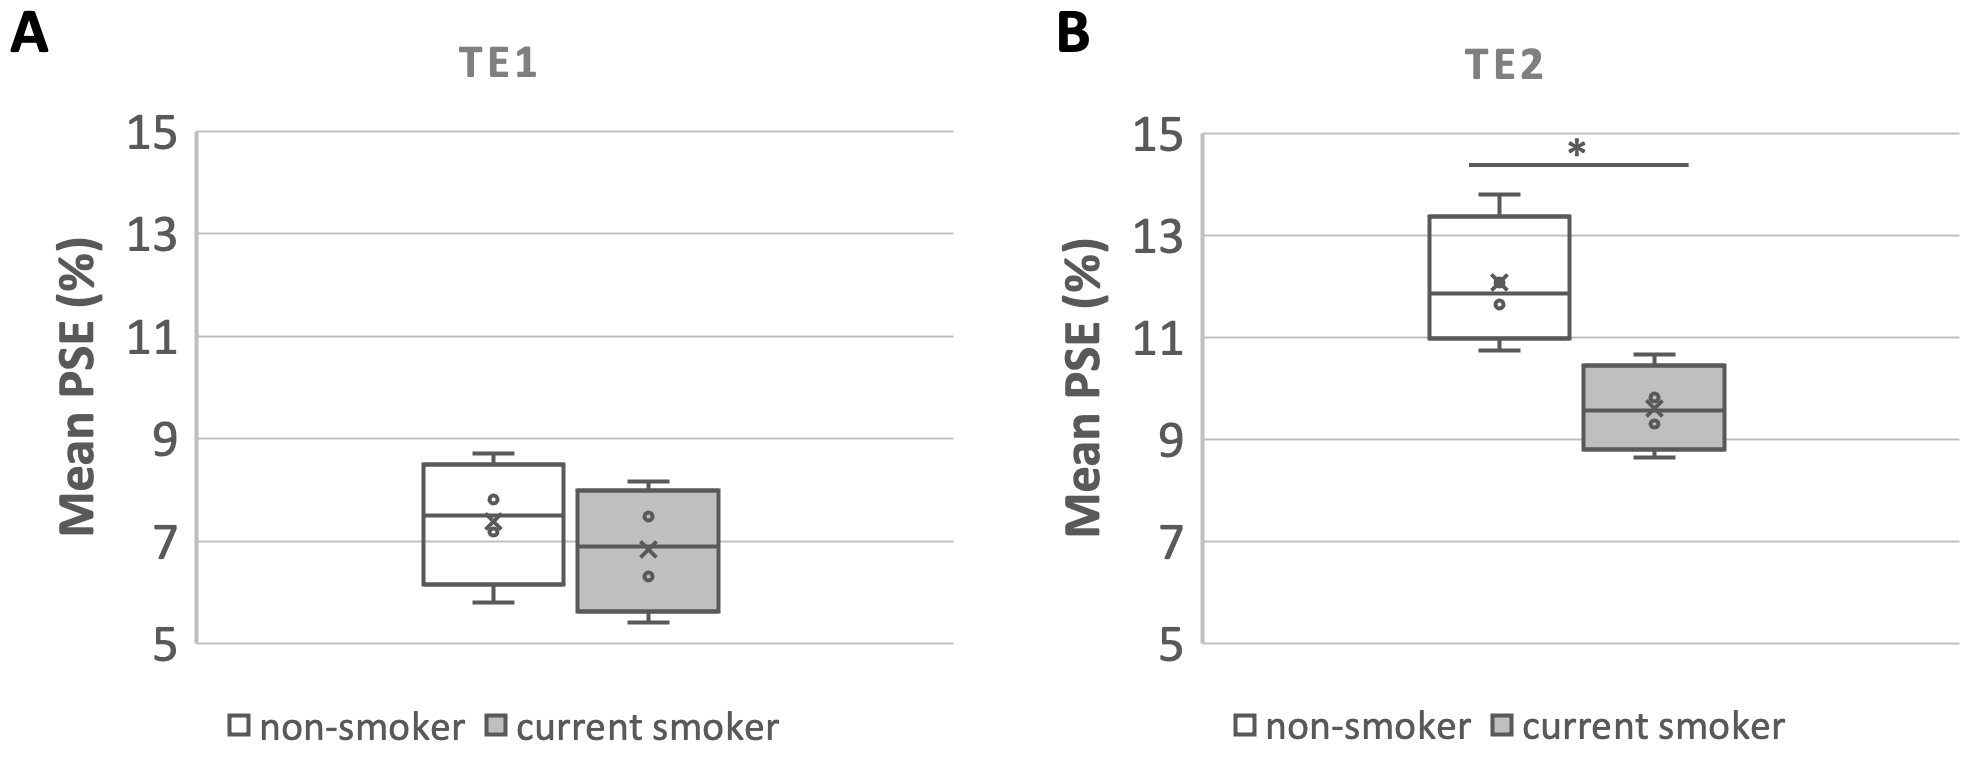
Figure 3. Boxplot of the mean lung PSE in six slices for all subjects split into non-smoker or current smoker, obtained with (A) TE1 (0.71 ms) and in all slices obtained with (B) TE2 (1.2 ms). Non-smoker mean PSE is significantly greater than current smoker PSE at TE2 (p-value* = 0.019) while significant difference between the mean PSE of the two groups is not observed at shorter TE1 (p-value = 0.556).
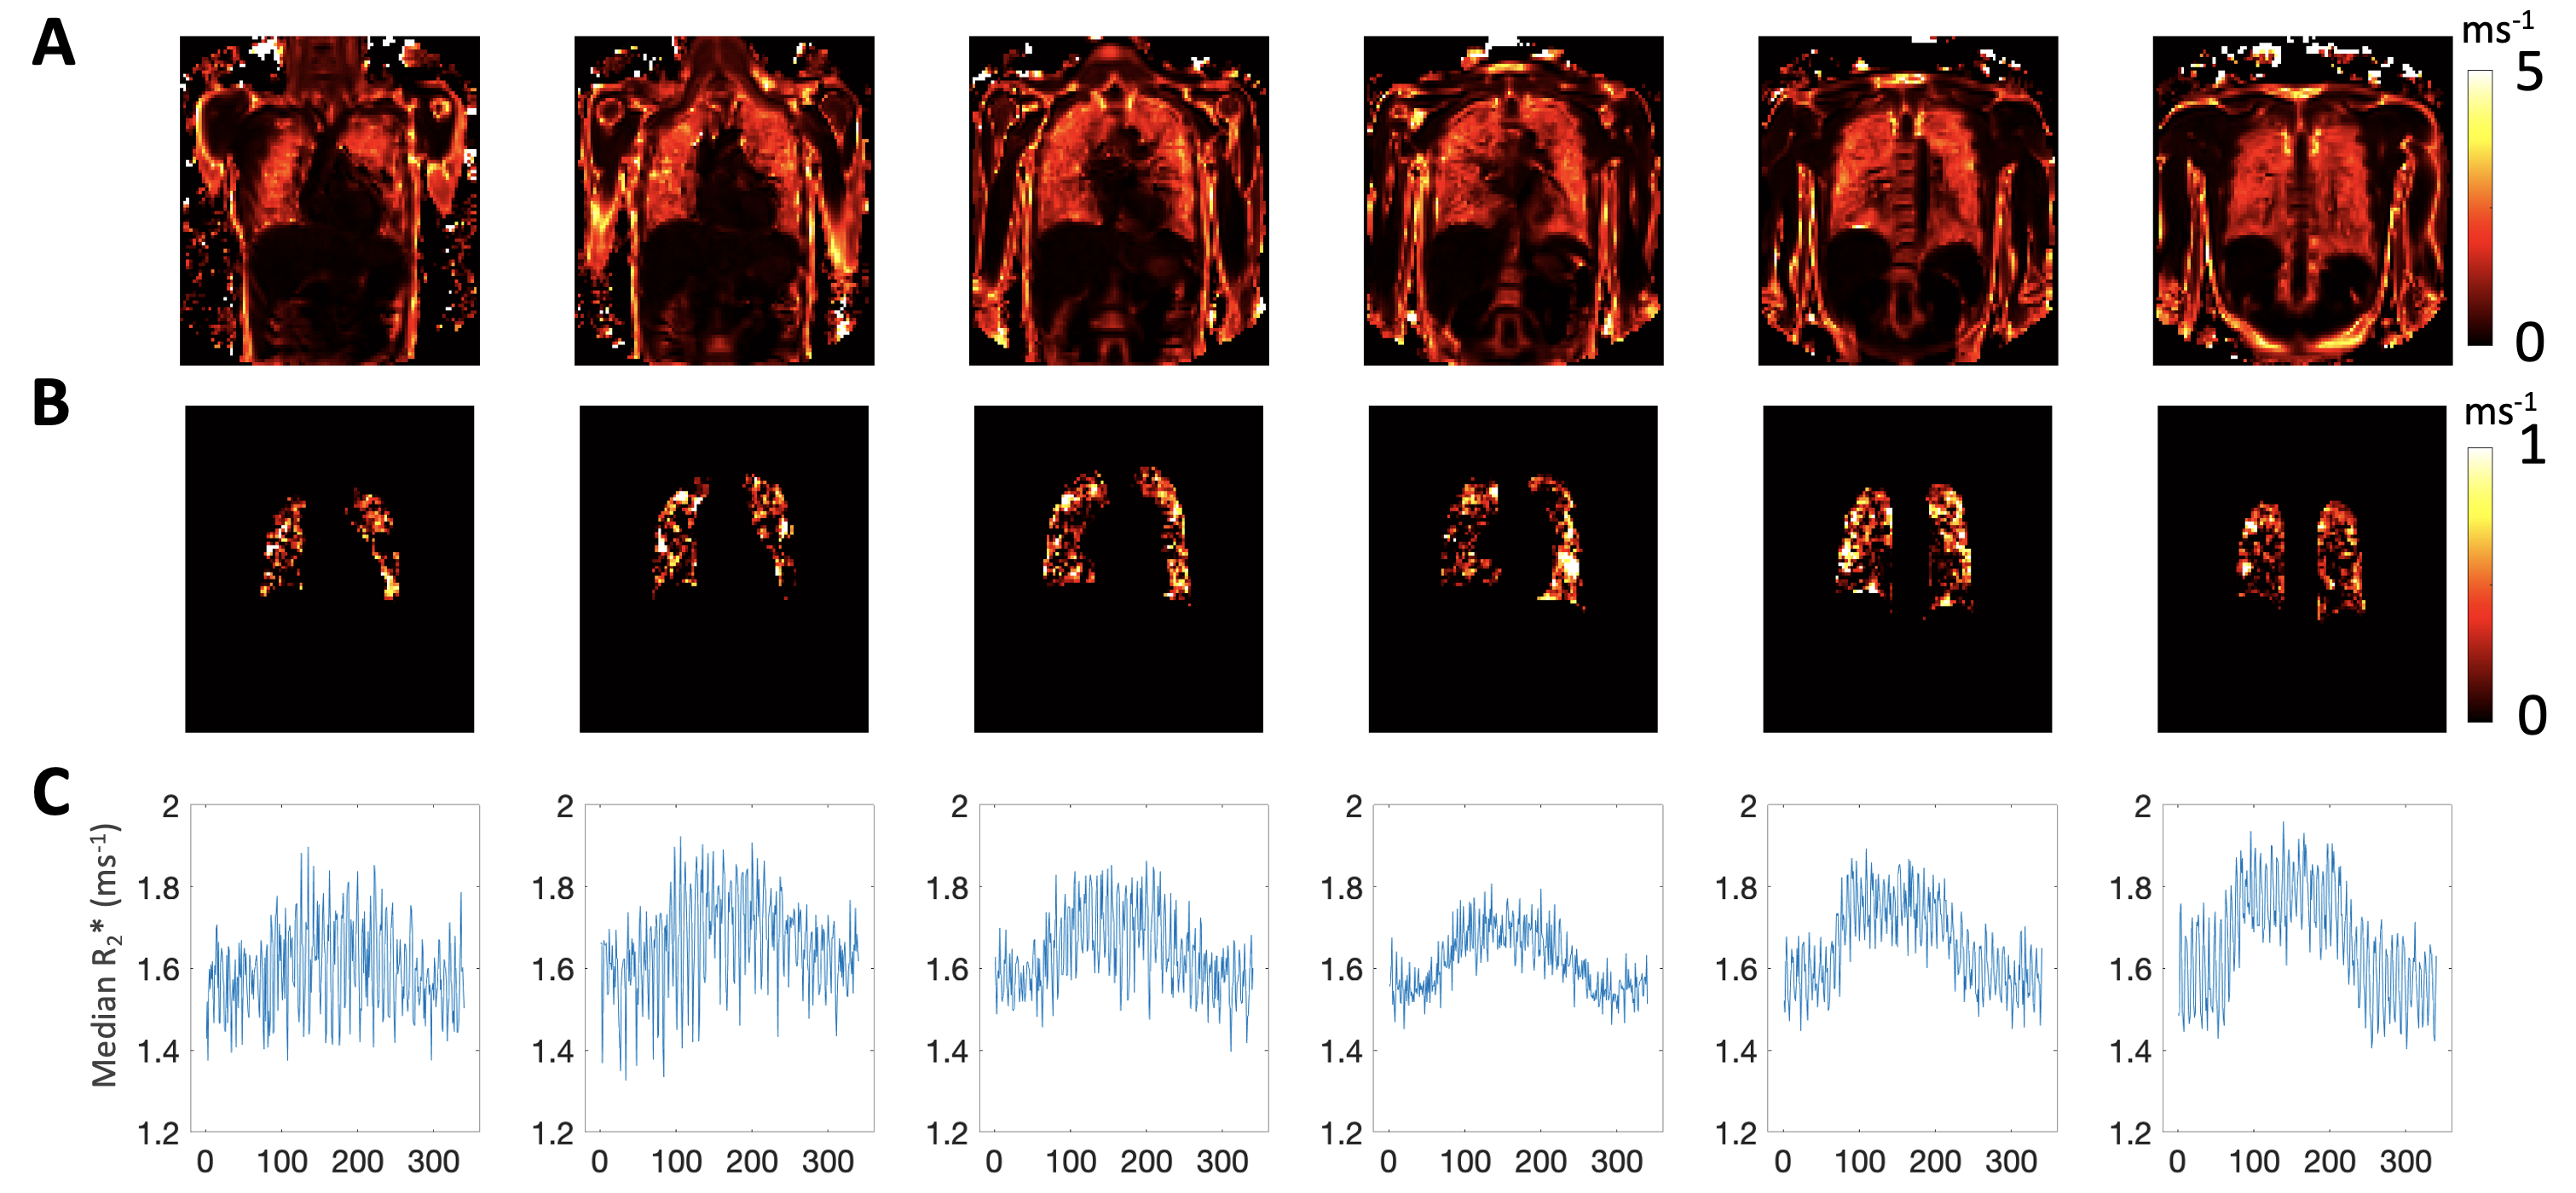
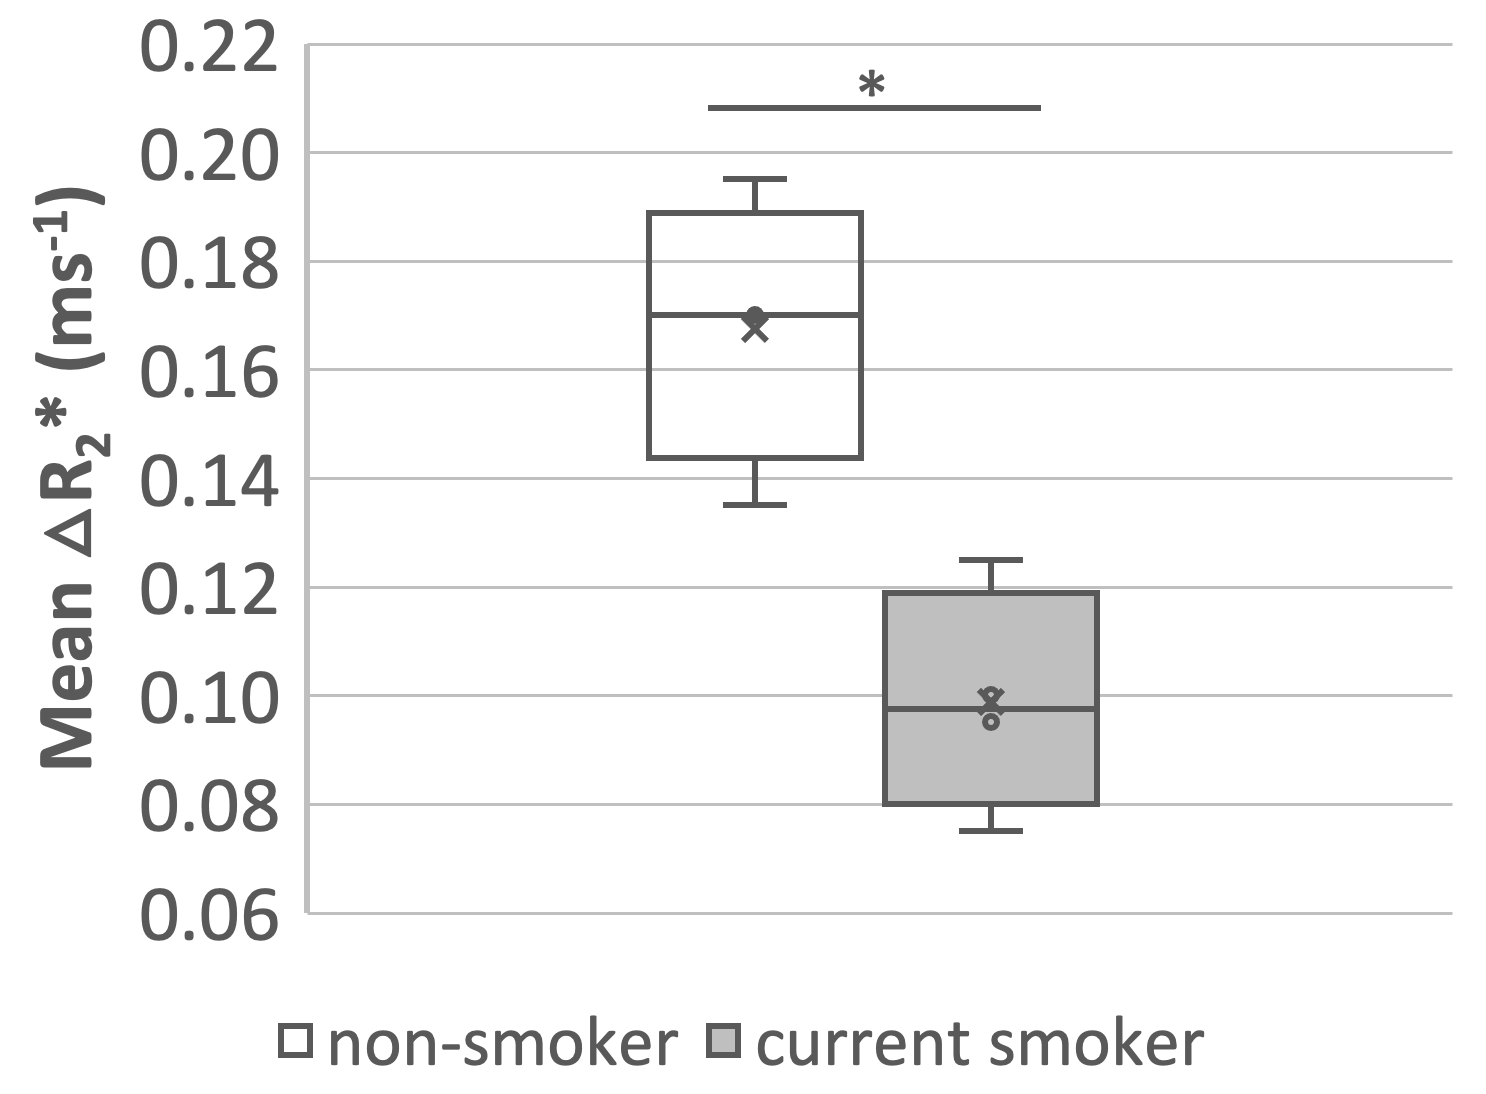
Figure 5. Boxplot of the mean lung ∆R2* from two posterior slices (slices 5-6) for all subjects and within two groups (non-smoker or current smoker), showing the significant difference between the mean ∆R2* of the two groups. Non-smoker mean ∆R2* is higher than for current smokers, p-value* = 0.005.