1480
Use of Phase Resolved Functional Lung Imaging (PREFUL) to Assess Response to Kaftrio® Therapy in Cystic Fibrosis1Sir Peter Mansfield Imaging Centre, University of Nottingham, Nottingham, United Kingdom, 2The Nottingham Biomedical Research Centre (BRC), Respiratory Medicine Dept, School of Medicine, University of Nottingham, Nottingham, United Kingdom, 3The Toronto Lung Transplant Program, University Hospital Network, Toronto, ON, Canada, 4Respirology Medicine Dept, University of Toronto, Toronto, ON, Canada, 5School of Medicine, University of Nottingham, Nottingham, United Kingdom, 6Nottingham NIHR Biomedical Research Centre, Nottingham, United Kingdom, 7The Hospital for Sick Children, Toronto, ON, Canada; Dept. of Medical Biophysics, University of Toronto, Toronto, ON, Canada, 8The Hospital for Sick Children, Toronto, ON, Canada, University of Toronto, Toronto, ON, Canada, 9The Wolfson Centre for Adult Cystic Fibrosis, Nottingham City Hospital, Nottingham University Hospitals NHS Trust, Nottingham, United Kingdom
Synopsis
Phase resolved functional lung imaging (PREFUL) was carried out before and 12 weeks after commencement of Kaftrio® therapy in a small Cystic Fibrosis (CF) group, and in healthy controls (HC). No significant differences were found in measures characterising the PREFUL signal between HC and CF, or before and after Kaftrio® therapy. This could be explained by the small sample size or lack of age matching. It was found that fractional ventilation measures with PREFUL can be sensitive to subjective thresholding and the method of image registration. Also, the impact of irregular breathing patterns, especially in patients, should be further explored.
Introduction
IntroductionCystic Fibrosis (CF) is an inherited condition characterised by viscous secretions, especially in the lungs. As a result, people with CF are susceptible to recurrent chest infections and ultimately chronic respiratory disease. New treatments for CF, such as Kaftrio® have recently been licenced in the UK and significantly improve lung function. Traditional clinical methods of monitoring lung function, e.g., spirometry, can only provide a global assessment and so are insensitive to regional or heterogeneous lung disease. Hyperpolarized gas MRI and oxygen-enhanced MRI have been used to assess regional ventilation1, but recent work has shown that proton MRI can potentially provide a regionally-sensitive measure of lung function through methods such as phase resolved functional lung imaging (PREFUL)2,3. The aim of this pilot study is to study the effect of Kaftrio® therapy in patients with CF on lung function as assessed using PREFUL-MRI at 3T, and to assess repeatability of PREFUL measures in these subjects.
Methods
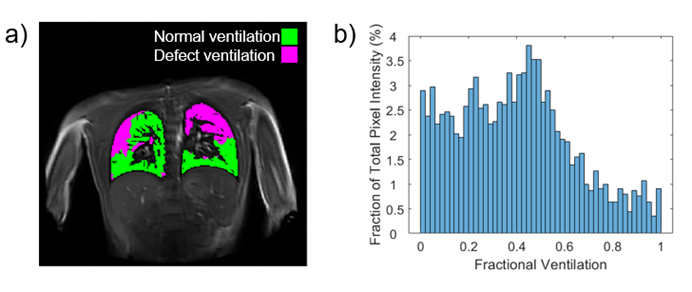
6 people with CF (12-21 years) and 5 healthy controls (HCs) (23-25 years) were recruited to undergo non-contrast enhanced proton MRI on a 3T Philips Ingenia scanner. PREFUL-MRI was performed with a 2D dynamic Fast Field Echo (FFE) acquisition (TE/TR 0.57/1.9 ms, image acquisition time = 239 ms) to acquire a single coronal slice placed just posterior to the heart (~ 1cm); 512 images were collected during free breathing over 117 s. In CF participants, scans were collected at baseline (Visit 1), and 12 weeks after commencement of Kaftrio® therapy (Visit 2). Repeat PREFUL scans were collected in Visit 2. Spirometry was performed for the CF patients at the Visit 1 to determine baseline forced expiratory volume in 1 second (FEV1). Repeated PREFUL dataset were acquired for the HCs.PREFUL analysis was performed using the pipeline of Couch et al.3. Fractional ventilation (FV) maps were calculated, and k-means clustering4 used to distinguish regions of normal ventilation from poorly ventilated areas of the lung from ventilation defect percentage (VDP) maps. Histograms of the FV maps, and the skewness of the histogram (which was generally skewed to higher values of FV) and fractional area under histogram for values less than FV=0.2 (%FV<0.2) were calculated. For repeat scans, the standard deviation in VDP was computed along with the coefficient of variation, Cv, of VDP and each histogram metric. A two-sample t-test was performed to compare the CF group (Visit 1) to healthy controls, and to compare the CF group between Visit 1 and 2.
Results
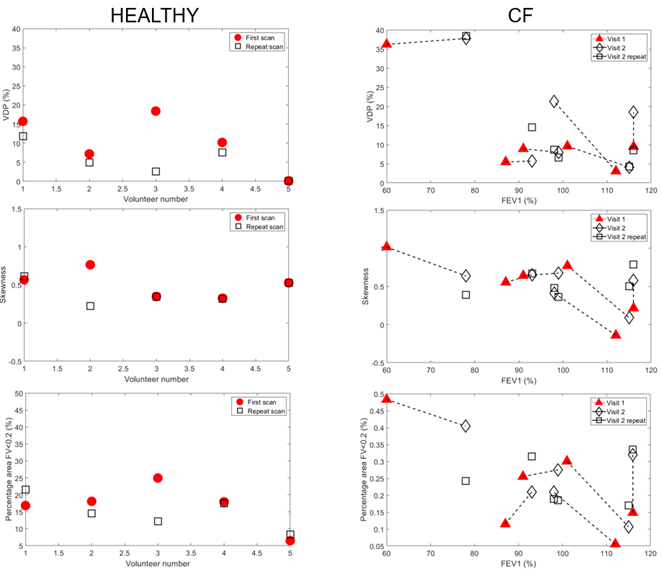
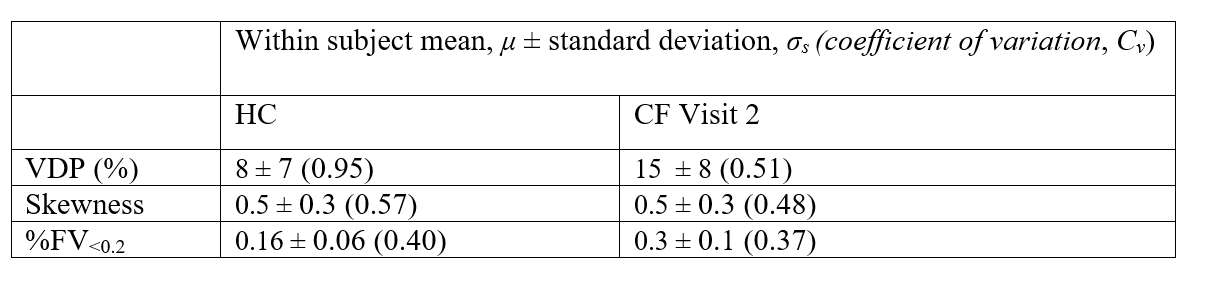
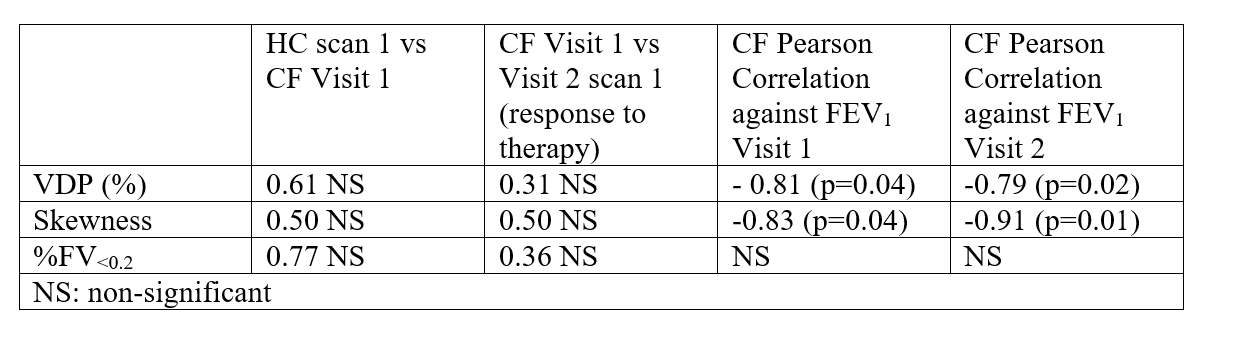
Figure 1 shows an example clustered FV map separated into areas of normal ventilation and defect ventilation, and the corresponding FV histogram for a person with CF. Figure 2 shows VDP, skewness of FV histogram and %FV<0.2 for healthy controls, and CF participants plotted against FEV1. Figure 2 also indicates repeated measures for the healthy controls and CF patients (Visit 2 only). Table 1 provides the between subject coefficient of variation, Cv, Table 2 gives the within subject mean, standard deviation and coefficient of variation (assessment of repeatability). Table 3 shows that no change was detected between controls and CF in this small group that was not age matched, and no change was observed between visits in CF. Table 3 also gives the p-values from the two-sample t-test between visits and shows that negative correlations were observed for both VPD and skewedness against FEV1 for the CF group, although these correlations may have been strongly influenced by a few data points.Discussion
In this small study we detected no significant difference in the measures we used to characterize the PREFUL signal, between HC and CF patients, or before and after Kaftrio® therapy in the CF group, (t-test or simply comparing changes to Cv for repeated measures). There was a trend for %FV<0.2 to be increased in CF Visit 1 compared to HC (according to hypothesis).This may be due to the small sample size in this preliminary study and also lack of age matching. However, it was notable that repeatability was lower in the patient group. This poorer repeatability in the CF group may be because these young subjects tended to move more than the HCs. We reanalysed HC subject 3 first scan (outlier) which resulted in a change in the mask threshold and registration target image and led to a VDP of 5.7 % more in line with other HC and closer to the repeat value. This indicates the sensitivity of the measures to subjective thresholding and arbitrary choice of target for image registration. Finally, FV is calculated from the change in the parenchyma MR signal between inspiratory and expiratory phases of respiration. Hence, the measured value of FV may be affected by irregular breathing patterns (breathing with varying respiratory frequency and amplitude), particularly in patients. These sources of intra-observer and inter-observer repeatability will now be assessed in more detail.
Acknowledgements
No acknowledgement found.References
1. Zha et al. Three-dimensional Isotropic Functional Imaging of Cystic Fibrosis Using Oxygen-enhanced MRI: Comparison with Hyperpolarized 3He MRI.Radiology, vol. 290, no. 1 pp. 229-237 (2018)
2. Andreas Voskrebenzev et al. Feasibility of Quantitative Regional Ventilation and Perfusion Mapping with Phase-Resolved Functional Lung (PREFUL) MRI in Healthy Volunteers and COPD, CTEPH, and CF Patients. Magnetic Resonance in Medicine, vol. 79, no. 4, pp. 2306–2314 (2018)
3. Couch, M. J et al. Comparison of Functional Free-Breathing Pulmonary 1H and Hyperpolarized 129Xe Magnetic Resonance Imaging in Pediatric Cystic Fibrosis. Academic Radiology, vol. 28, no. 8, e209–e218 (2020)
4. Kirby et al. Hyperpolarized 3He Magnetic Resonance Functional Imaging Semiautomated Segmentation. Academic Radiology vol. 19, no. 2, pp141–152 (2012)
Figures