1473
Narcosis depresses the BOLD-CVR response to acetazolamide in pediatric moyamoya vasculopathy1Neurosurgery, UMC Utrecht, Utrecht, Netherlands, 2Imaging, UMC Utrecht, Utrecht, Netherlands, 3Spinoza Centre for Neuroimaging, Amsterdam, Netherlands, 4Pediatric Neurology, UMC Utrecht, Utrecht, Netherlands
Synopsis
Measuring cerebrovascular reactivity (CVR) under narcosis is underreported, while narcosis is often necessary for pediatric or cognitively impaired patients. When acetazolamide is used in awake patients, maximum CBF increase reaches a plateau after ~12min. Using ASL- and BOLD-MRI with acetazolamide we showed that for pediatric moyamoya patients the response is different. Patients under narcosis show lower CVR and reach peak CBF earlier (after around six minutes), after which CBF decreases again without the plateau-phase. This shows the response to acetazolamide is distinctively different between awake and narcosis patients and caution is warranted during interpretation of narcosis CVR images.
INTRODUCTION
Cerebrovascular reactivity (CVR) measurements are increasingly used for a range of diseases and indications1–3, using gold-standard [15O]H2O-PET, or MRI based measurements (Blood Oxygen Level Dependent (BOLD) and Arterial Spin Labeling (ASL))4–6. Acetazolamide-injection is a commonly used vascular-stimulus7,8. For moyamoya vasculopathy (MMV), cerebral blood flow (CBF) and CVR measurements are essential for the indication and evaluation of revascularization4,9. However, MMV patients are often young or cognitively impaired, thus necessitating narcosis to prevent severe motion related artifacts10,11. Little has been reported on CVR in MMV under narcosis, but typically acetazolamide is used in a similar manner as in awake patients under the assumption that anesthesia does not affect the mechanisms of CVR. To test this assumption, we compared the response to acetazolamide between MMV patients under narcosis and awake, using a dynamic BOLD-series combined with multi-delay ASL (MD-ASL) before and ~15 minutes after injection of acetazolamide.METHODS
We included all pediatric MMV patients without motion artefacts from our clinical MRI-CVR database. All patients provided written informed-consent. Narcosis was either propofol or sevoflurane, at the discretion of the anesthesiologist, using a laryngeal mask without muscle relaxants. Scans were performed at 3T (Philips) using a 32-channel receive coil (Nova Medical). Baseline CBF measurements parameters: 5 post-labeling-delays (1206-3480ms), pCASL, multi-slice EPI, label duration=2s, voxel-size=3.75x3.75x7mm3, 16 slices, FOV=240x240x120mm3, TR/TE=6s/11ms, flip angle=25°, SENSE factor=2, background suppression, 24 volumes, scan-time=5min. Multi-slice gradient-echo BOLD EPI parameters: multi-band (TR=1.1s) or non-multiband (TR=2.8s), voxel-size=2.5mm isotropic, 48 slices, FOV=224x224x120mm3, TR/TE=1.1s/35ms, flip angle=65°, SENSE factor=1.7. Acetazolamide injection (20mg/kg (max 1g)) began between 60-90 seconds after the start of the BOLD-scan. Upon completion of the BOLD-scan, a second MD-ASL scan was acquired and used for the calculation of the ASL-CVR. CBF was computed using BASIL (FSL, FMBRIB, Oxford, UK).BOLD data were motion-corrected (MCFLIRT, FSL), distortion-corrected (TOPUP, FSL), spatially smoothed (3D Gaussian kernel, FWHM=5mm) and normalized (to Delta%BOLD). Considering the variable TRs used, all BOLD data were interpolated to TR=1s. Further timeseries analysis was performed using functions from the seeVR-toolbox (seeVR, Utrecht, NL)13. Cerebellar masks were applied to generate BOLD-CVR ROI time-series, which were temporally smoothed (LOESS filter, 6% window) and averaged for both groups. The mean and 95%CI (1.96*SEM) was plotted. Time-to-peak (TTP), the CVR-slope of the initial linear response and the final CVR amplitude were calculated for each subject and compared using Student’s t-test (Matlab, Natick, USA).
The patients’ MMV-pathology will have heterogeneous spatial effects in the cerebrum. To focus primarily on the effects of the anesthesia on CVR we focused in this study on the cerebellum as this is independently perfused by the vertebrobasilar system, thus unaffected by MMV12.
RESULTS
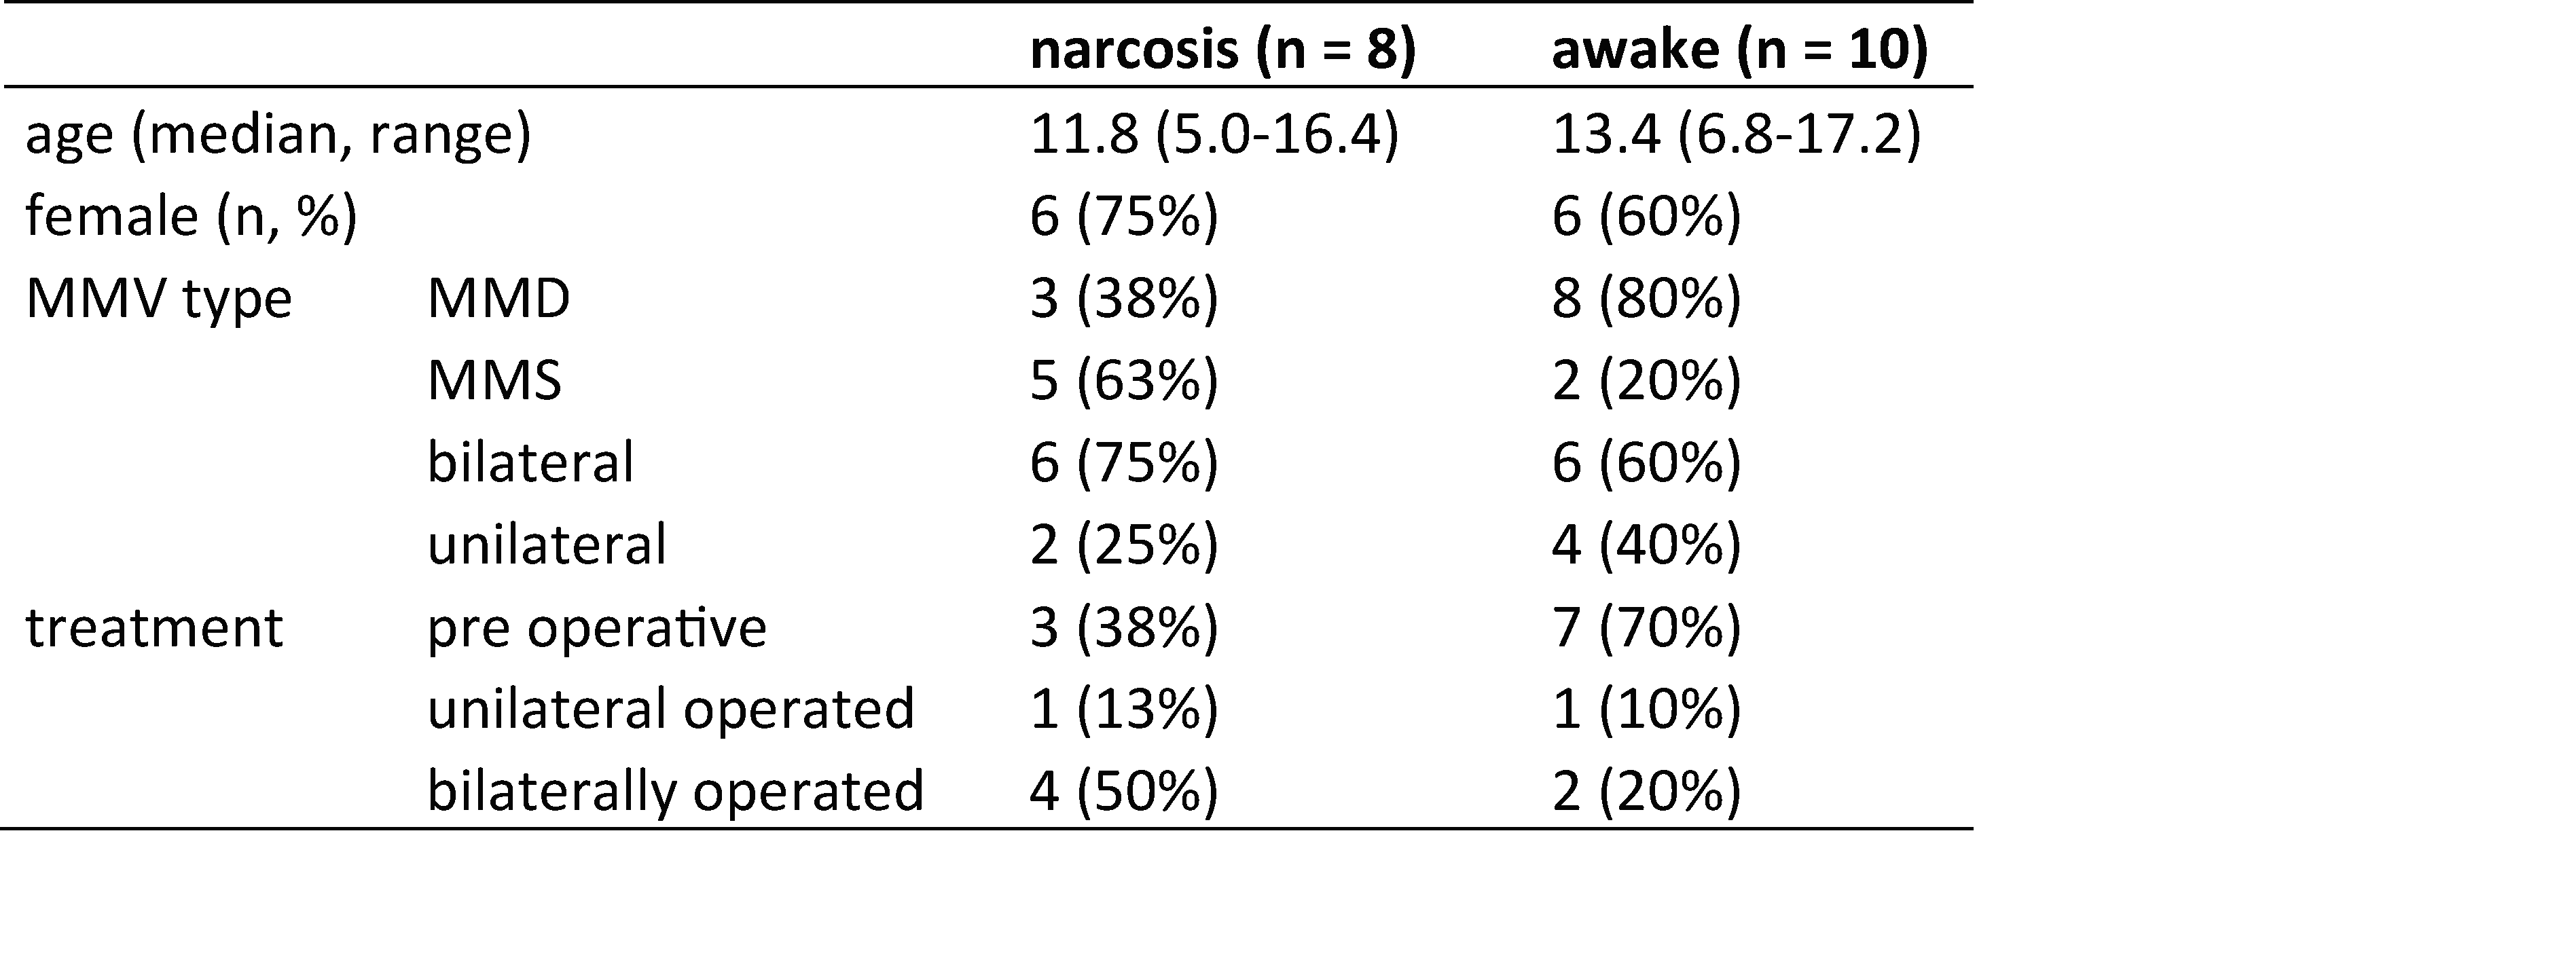
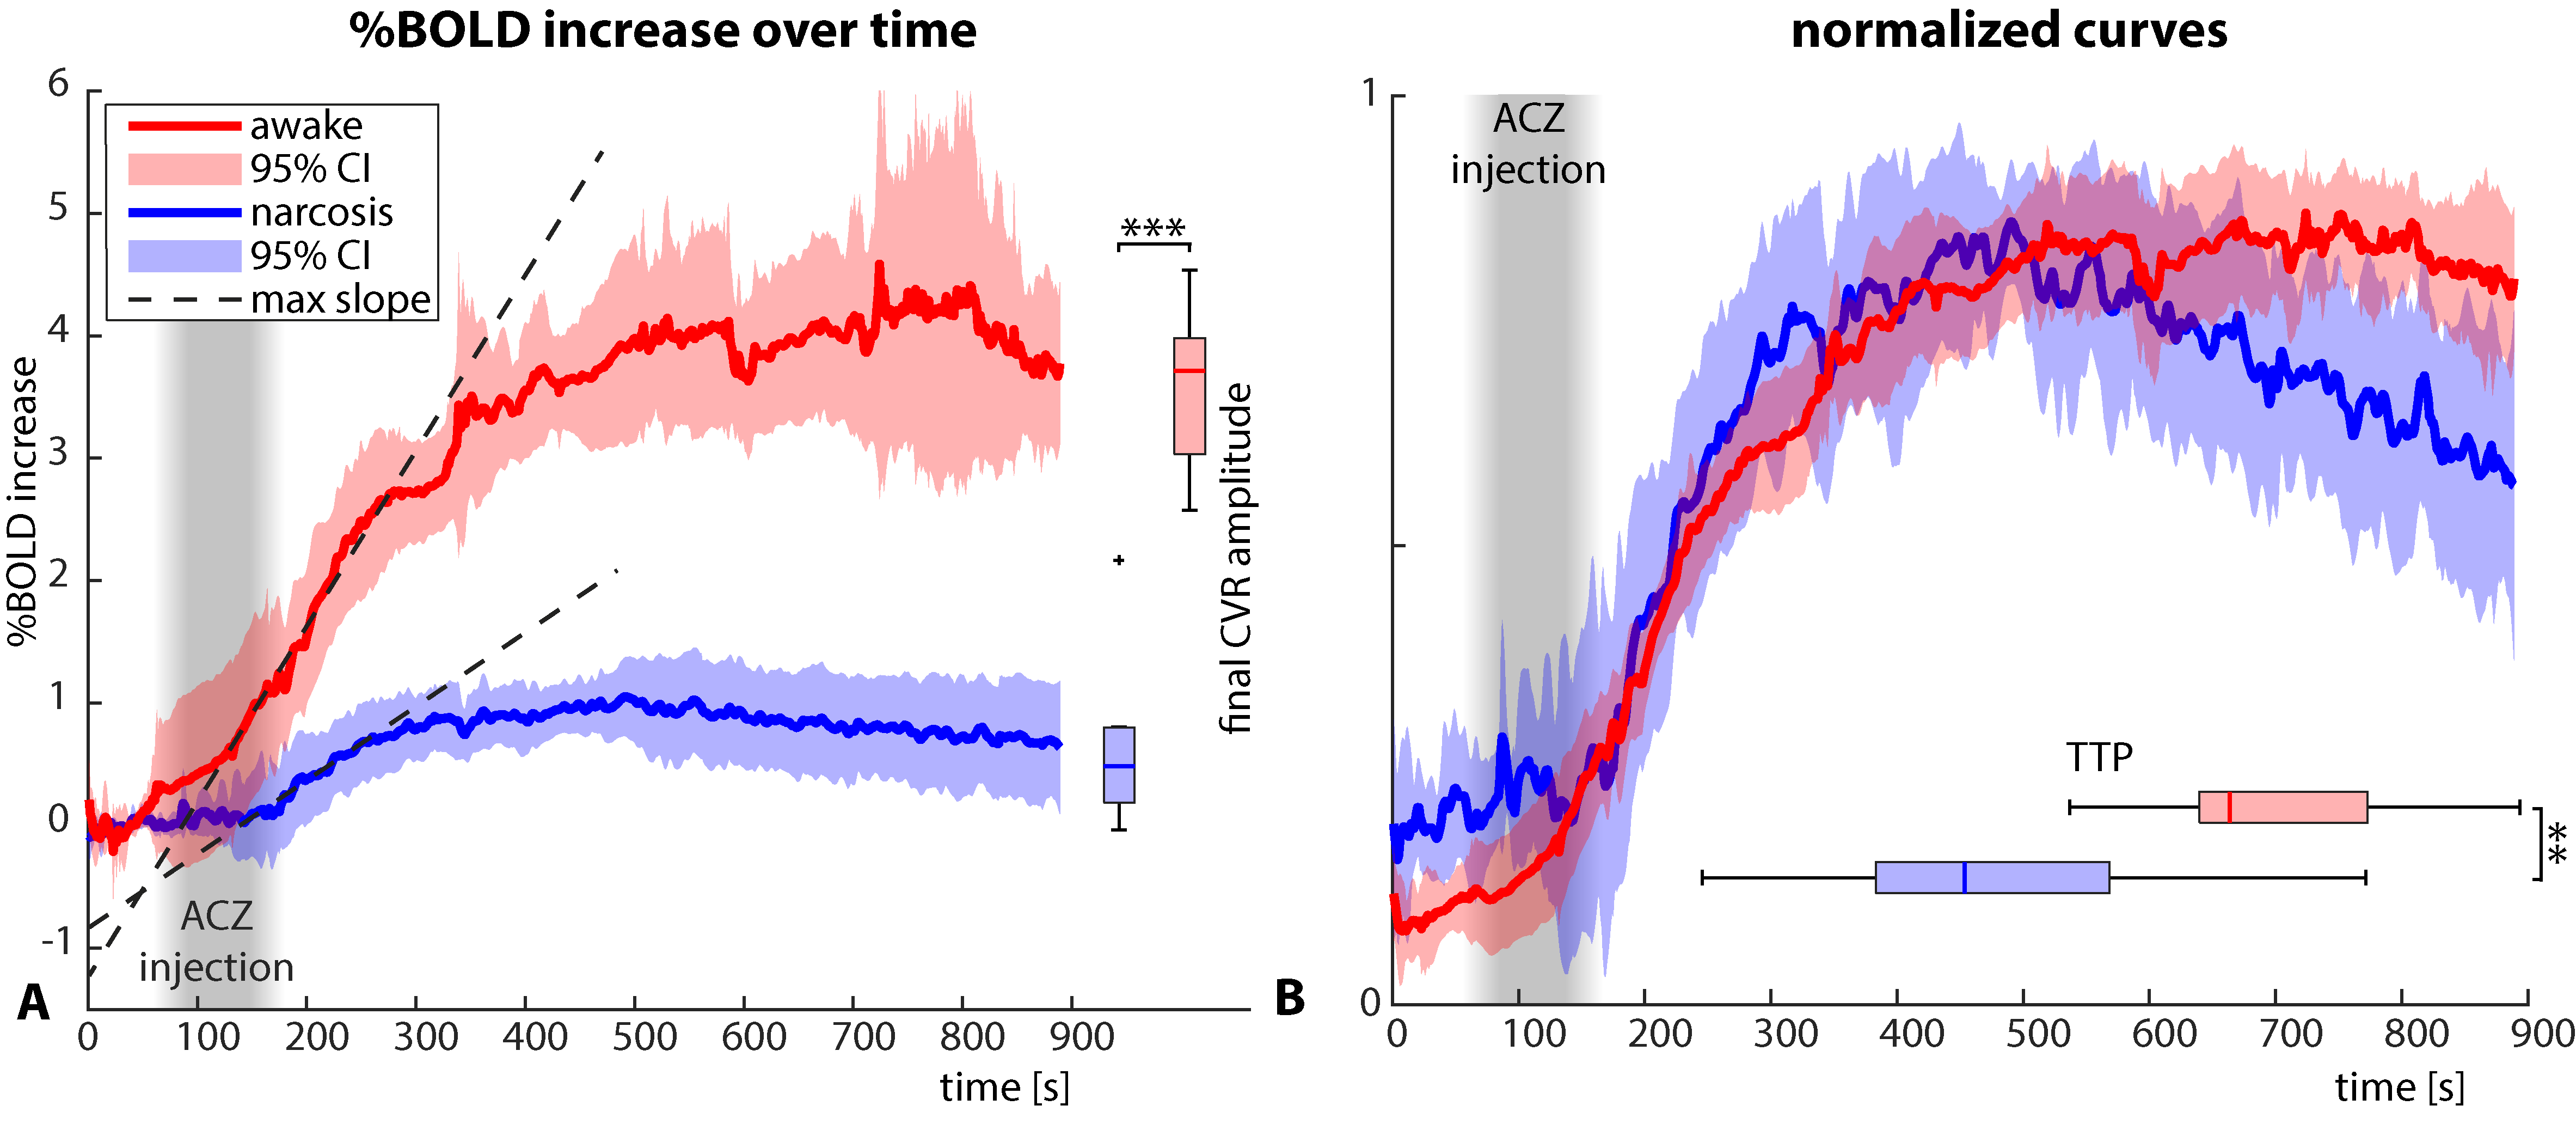
We identified 44 datasets, from 37 unique patients (23 children) and we could include eight (median age 11.8y) narcosis scans and ten (13.4y) awake scans (Fig 1. for table 1).The %BOLD-change in the (unaffected) cerebellum differed significantly between narcosis and awake patients ~120s after starting the acetazolamide injection (Fig 2). The mean TTP were ~413±159s (mean/SD) and ~630±110s in narcosis and awake patients, respectively (p=0.0035, Fig 2B). The final BOLD-CVR amplitude was 0.64±0.70%BOLD for narcosis and 3.8±1.2%BOLD for awake patients (p<0.0001). The CVR-slope was 0.0070±0.0060%/s and 0.016±0.0051%/s for the narcosis and awake patients, respectively (p=0.0035, Fig 2A).
The ASL-CBF values in the cerebellum were comparable between narcosis and awake at baseline (31.5±16.3 resp. 38.4±10.3 ml/100g/min, p=0.3) but after acetazolamide-injection the CBF of awake patients was higher than narcosis patients (67.0±13.6 vs. 47.4±17.5, p=0.02). Delta-CBF was higher in awake patients, but not significantly different (27.5±12.4 vs. 16.1±11.5 ml/100g/min, p=0.07, Fig. 3).
DISCUSSION
We showed a significant difference in BOLD-response in terms of the TTP, CVR-slope and amplitude parameters to acetazolamide between narcosis and awake MMV patients in the unaffected cerebellum. This was supported by ASL results, albeit less strong. This is an important finding since the effect of the anesthesia may lead to an underestimation of true CVR.The mechanisms driving the observed differences is not directly clear and warrants further research. The anesthetic agents may pre-dilate vessels leading to a higher venous oxygen saturation and lower possible BOLD signal increase with acetazolamide14. However, we did not see a difference in baseline CBF-values between awake and narcosis patients. Combining acetazolamide with anesthesia might lead to an physiological interaction, causing more hyperventilation and deeper breathing (i.e. respiratory compensation for pH-decrease) leading to inhibition of the CBF-increase. The lower BOLD response under narcosis could also be due to anesthesia-related reductions in CMRO214. Here, baseline venous saturation would increase leading to less ‘headroom’ to evoke BOLD-contrast changes during acetazolamide-mediated increases in CBF. If true, this would mean BOLD-CVR may be underestimated under narcosis. However, the apparent reduction in the BOLD response at later time-points (after the TTP) suggest that even the post-ACZ ASL -and even [15O]H2O-PET- may be underestimating CVR under narcosis.
CONCLUSION
The use of narcosis has an substantial effect on the CVR response of patients under narcosis, leading to a lower CVR slope, a shorter TTP and lower final CVR amplitude. More research is needed for the implications of this finding, and to find the best way to measure CVR under narcosis. Until then, narcosis CVR scans using acetazolamide need to be interpreted with caution.Acknowledgements
We would like to acknowledge Mathijs B.J. Dijsselhof for his work on the start of the automated ASL analysis pipelineReferences
1. Yonas H, Smith HA, Durham SR, et al. Increased stroke risk predicted by compromised cerebral blood flow reactivity. J Neurosurg 1993; 79: 483–489.
2. Silvestrini M, Pasqualetti P, Baruffaldi R, et al. Cerebrovascular reactivity and cognitive decline in patients with Alzheimer disease. Stroke 2006; 37: 1010–1015.
3. Bacigaluppi S, Dehdashti AR, Agid R, et al. The contribution of imaging in diagnosis, preoperative assessment, and follow-up of moyamoya disease. Neurosurg Focus 2009; 26: E3.
4. Fierstra J, van Niftrik C, Warnock G, et al. Staging Hemodynamic Failure With Blood Oxygen-Level-Dependent Functional Magnetic Resonance Imaging Cerebrovascular Reactivity: A Comparison Versus Gold Standard ((15)O-)H2O-Positron Emission Tomography. Stroke 2018; 49: 621–629.
5. Fan AP, Guo J, Khalighi MM, et al. Long-Delay Arterial Spin Labeling Provides More Accurate Cerebral Blood Flow Measurements in Moyamoya Patients A Simultaneous Positron Emission Tomography / MRI Study. 2017; 2441–2449.
6. Hauser T-K, Seeger A, Bender B, et al. Hypercapnic BOLD MRI compared to H215O PET/CT for the hemodynamic evaluation of patients with Moyamoya Disease. Neuroimage (Amst); 22. Epub ahead of print 2019. DOI: 10.1016/j.nicl.2019.101713.
7. Ringelstein EB, Van Eyck S, Mertens I. Evaluation of cerebral vasomotor reactivity by various vasodilating stimuli: Comparison of CO2 to acetazolamide. J Cereb Blood Flow Metab 1992; 12: 162–168.
8. Fierstra J, Sobczyk O, Battisti-Charbonney A, et al. Measuring cerebrovascular reactivity: What stimulus to use? J Physiol 2013; 591: 5809–5821.
9. Kronenburg A, Braun KPJ, Van Der Zwan A, et al. Recent advances in moyamoya disease: Pathophysiology and treatment. Curr Neurol Neurosci Rep 2014; 14: 1–9.
10. Kronenburg A, van den Berg E, van Schooneveld MM, et al. Cognitive Functions in Children and Adults with Moyamoya Vasculopathy: A Systematic Review and Meta-Analysis. J stroke 2018; 20: 332–341.
11. Scott RM, Smith ER. Moyamoya Disease and Moyamoya Syndrome. N Engl J Med 2009; 360: 1226–1237.
12. Delion M, Dinomais M, Mercier P. Arteries and Veins of the Cerebellum. Cerebellum 2017; 16: 880–912.
13. Bhogal AA. abhogal-lab/seeVR: v1.01 (v1.01). Zenodo. Epub ahead of print 2021. DOI: https://doi.org/10.5281/zenodo.5283595.
14. Szabó EZ, Luginbuehl I, Bissonnette B. Impact of anesthetic agents on cerebrovascular physiology in children. Paediatr Anaesth 2009; 19: 108–118.
Figures