1472
Oxygen Extraction Fraction and Cerebral Metabolic Rate of Oxygen derived from DSC-MRI in Patients with Moyamoya Disease1Surgical Sciences, Uppsala University, Uppsala, Sweden, 2Neuroscience, Uppsala University, Uppsala, Sweden
Synopsis
Moyamoya disease is a cerebrovascular disease where changes to oxygen extraction fraction (OEF) and cerebral metabolic rate of oxygen (CMRO2) are important parameters to assess the risk of future ischemic stroke. By applying a microvasculature model to dynamic susceptibility contrast (DSC) perfusion data parametric maps of both OEF and CMRO2 can be generated. For both OEF and CMRO2 significant differences between affected and unaffected vascular territorial regions were found. OEF and CMRO2 derived from DSC perfusion shows promise in detecting cerebral hemodynamic impairment in patients with moyamoya disease. However, further investigations are needed to clarify the clinical potential.
Introduction
Moyamoya disease (MMD) is a cerebrovascular disease characterized by progressive steno-occlusion of the terminal part of the internal carotid arteries, causing a decline in cerebral perfusion pressure (CPP) distal to the steno-occlusion lesion. This will trigger a haemodynamic and metabolic response to preserve the cerebral metabolic rate of oxygen (CMRO2). Cerebral autoregulation will dilate resistance arteries to maintain adequate cerebral blood flow, and an increase in oxygen extraction fraction (OEF) will contribute to sufficient oxygenation and normal CMRO2 1,2.It is important to assess to what extent the haemodynamic and metabolic changes occur in response to decreased CPP to evaluate the potential benefits of revascularization surgery and the risk of future ischemic stroke 3. Today’s reference standard to measure OEF and CMRO2 is 15O-gas PET, a cumbersome and expensive technique 4. Dynamic susceptibility contrast (DSC) perfusion is a well-established technique for measuring cerebral perfusion parameters such as cerebral blood flow and cerebral blood volume 5. Applying a microvasculature model to DSC perfusion data parametric maps of OEF and CMRO2 can be generated 6,7. The aim of this study was to assess the use of OEF and CMRO2 derived from DSC perfusion data in patients with MMD.
Methods
Nine patients with confirmed unilateral or bilateral MMD and an MRI examination before and/or after indirect revascularisation surgery were retrospectively included in this study. The study was done in accordance with the declaration of Helsinki and was approved by the Swedish Ethical Review Authority, all included patients or legal guardian signed an informed consent.All examinations were performed on a Philips Achieva, 3.0 T (Philips Healthcare, Best, the Netherlands) using a 32-channel head coil. Structural 3D contrast-enhanced T1-weighted (CE-T1WI) images were acquired for grey matter (GM) segmentation and registration purposes. DSC perfusion was performed 30 minutes after intravenous injection of acetazolamide (1 g to adults and 10 mg/kg to children). DSC perfusion data was processed though the automated perfusion analysis software Cercare Medical Neurosuite 2021 (Cercare Medical, Aarhus, Denmark) allowing generation of parametric images of OEF and CMRO2. Standard templates including cerebellum and vascular territory regions were spatially normalized to patient-specific space, including bilateral cerebellum, anterior (ACA), middle (MCA) and posterior cerebral arteries (PCA). All vascular regions and cerebellum were masked with the corresponding GM mask. Parametric images of OEF and CMRO2 were registered to each patient's CE-T1WI images. Vascular regional values of OEF and CMRO2 were extracted from the corresponding parametric images and normalized to cerebellum (nOEF and nCMRO2) 8. All processing steps were performed using the SPM12 toolbox (Wellcome Trust Centre for Neuroimaging, London, UK).
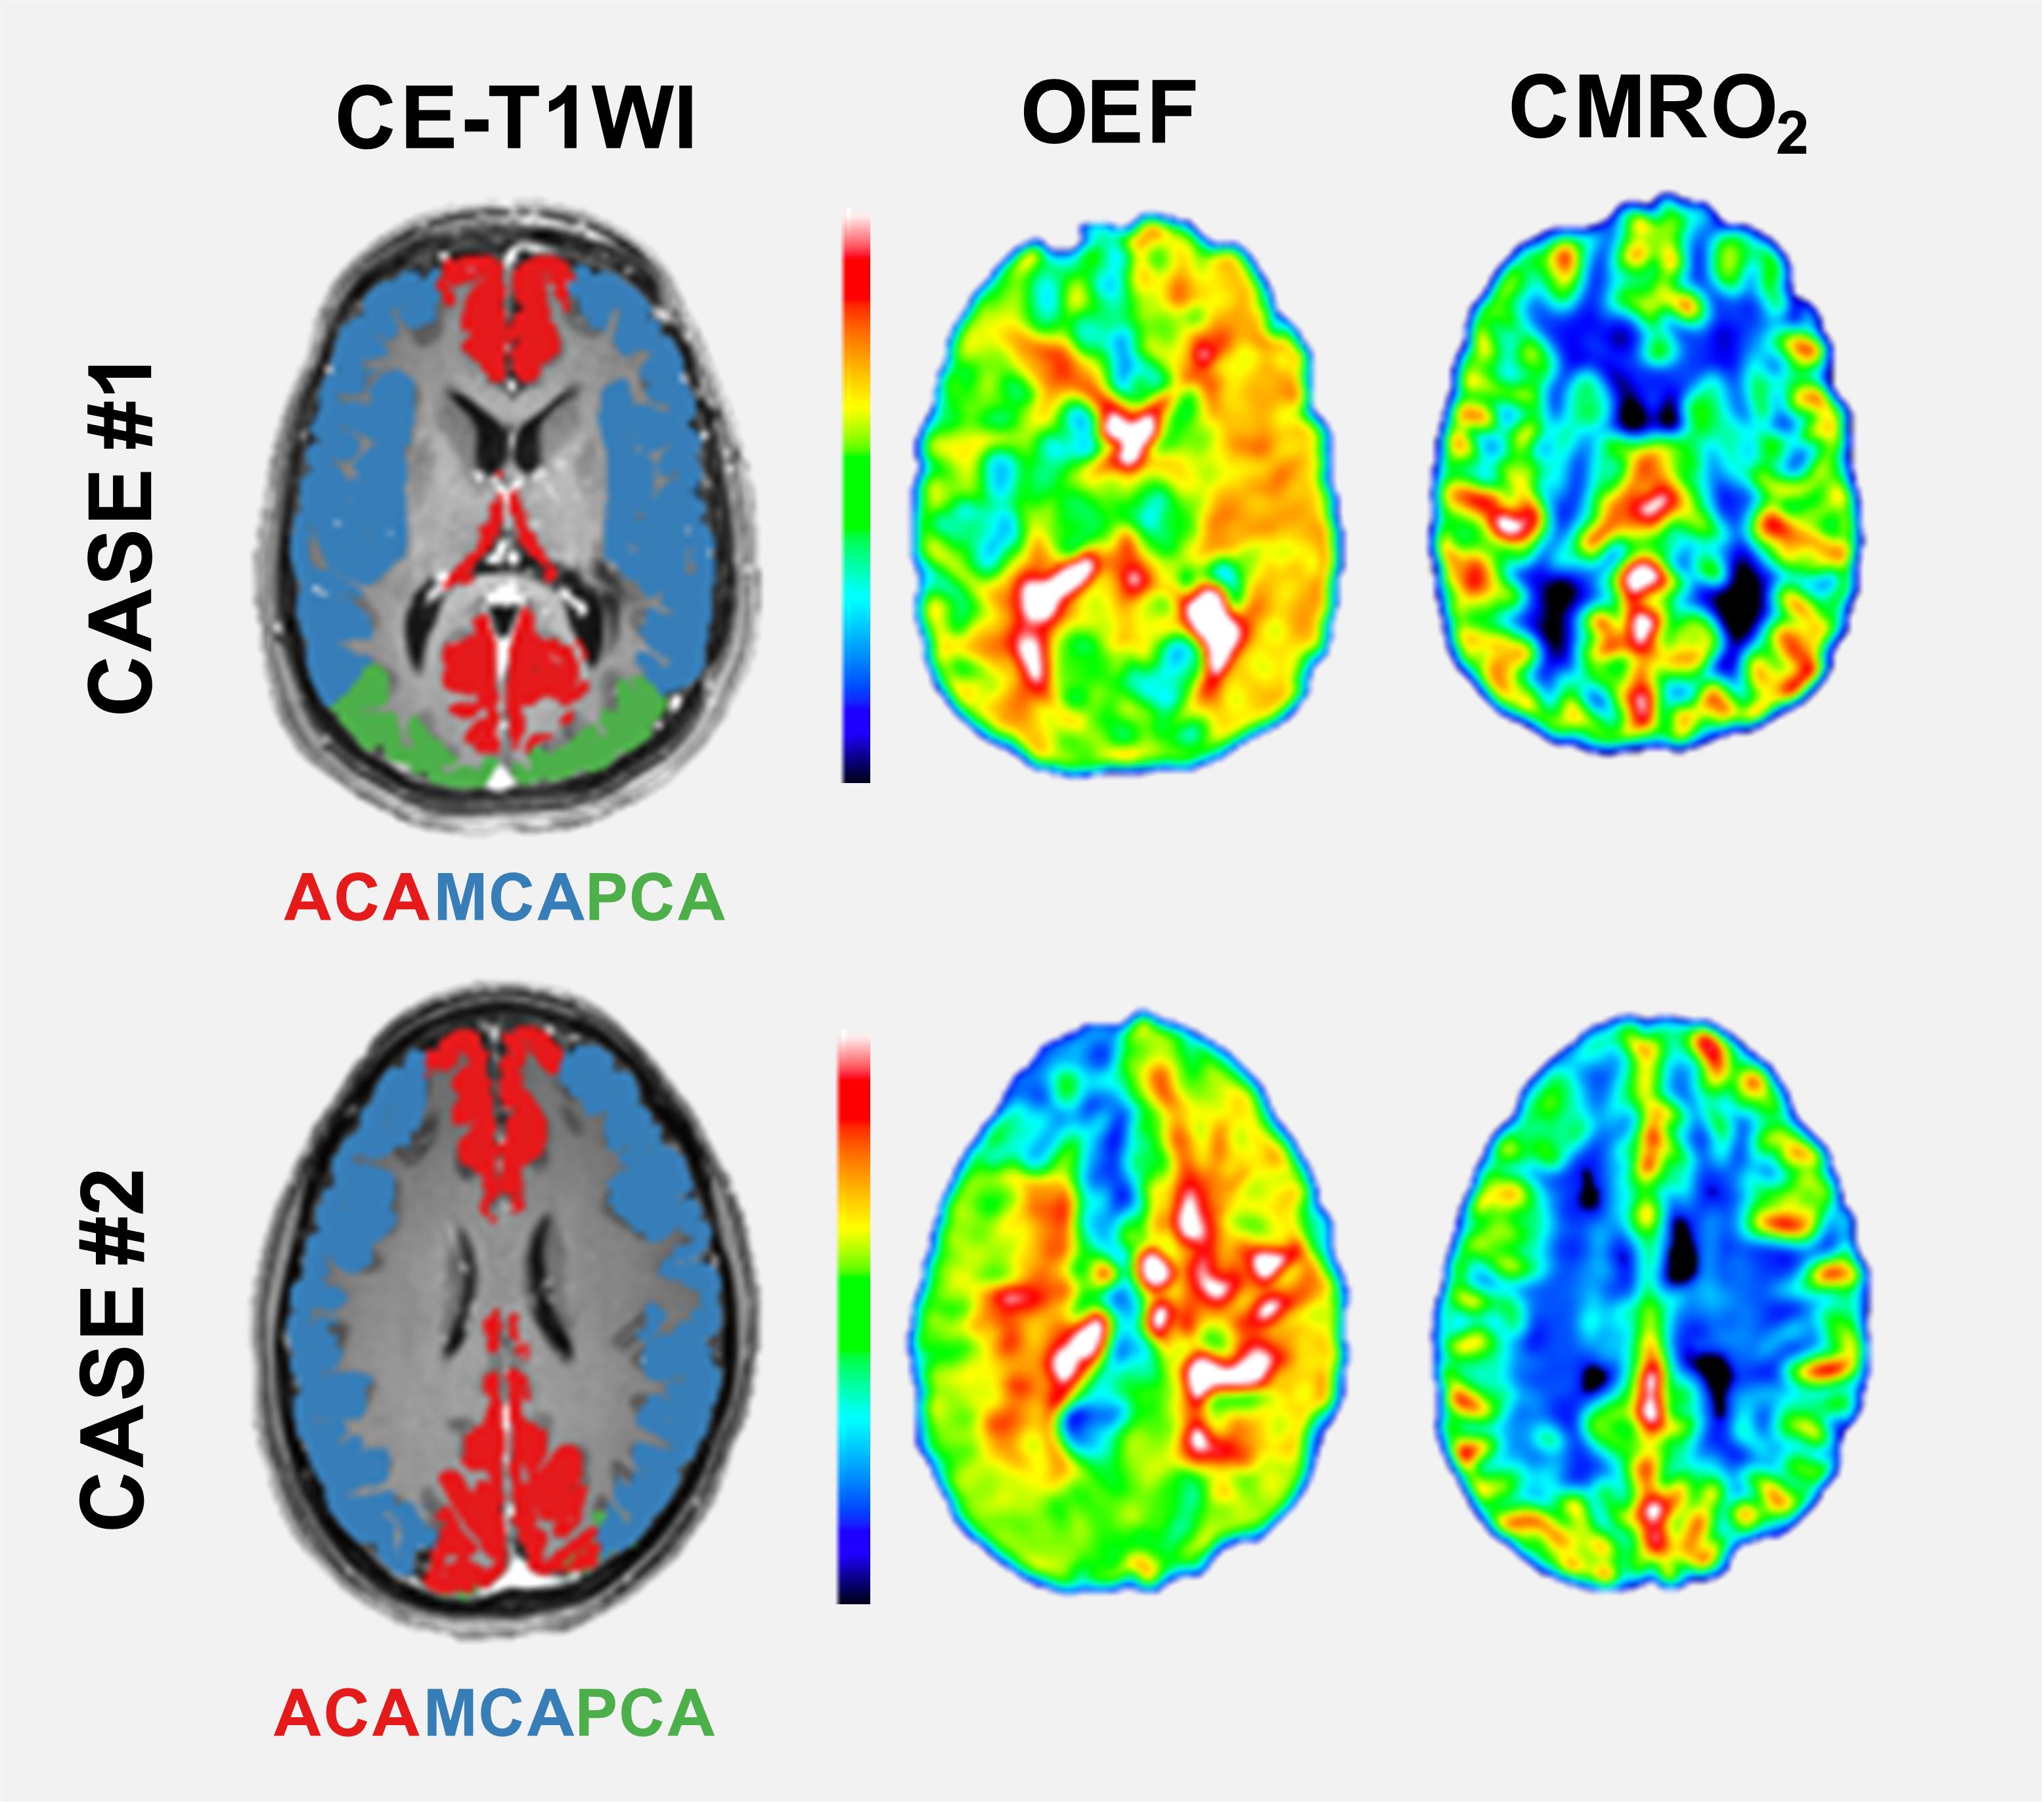
Vascular regions were designated affected or unaffected based on Suzuki Score system grading using digital subtraction angiography. All PCA regions and contralateral ACA- and MCA regions in MMD patient with unilateral disease were considered unaffected. For descriptive analysis of OEF and CMRO2 average and standard deviation were calculated. Comparison of nOEF and nCMRO2 between affected and unaffected regions was performed using an unpaired t-test. Computed p-values are two-sided and presented as exact values, and p < 0.05 was used as the level for statistical significance. GraphPad Prism 9 for Mac (GraphPad Software, La Jolla, CA, USA) was used for statistical analysis. Two cases are presented and discussed in more detail.
Results
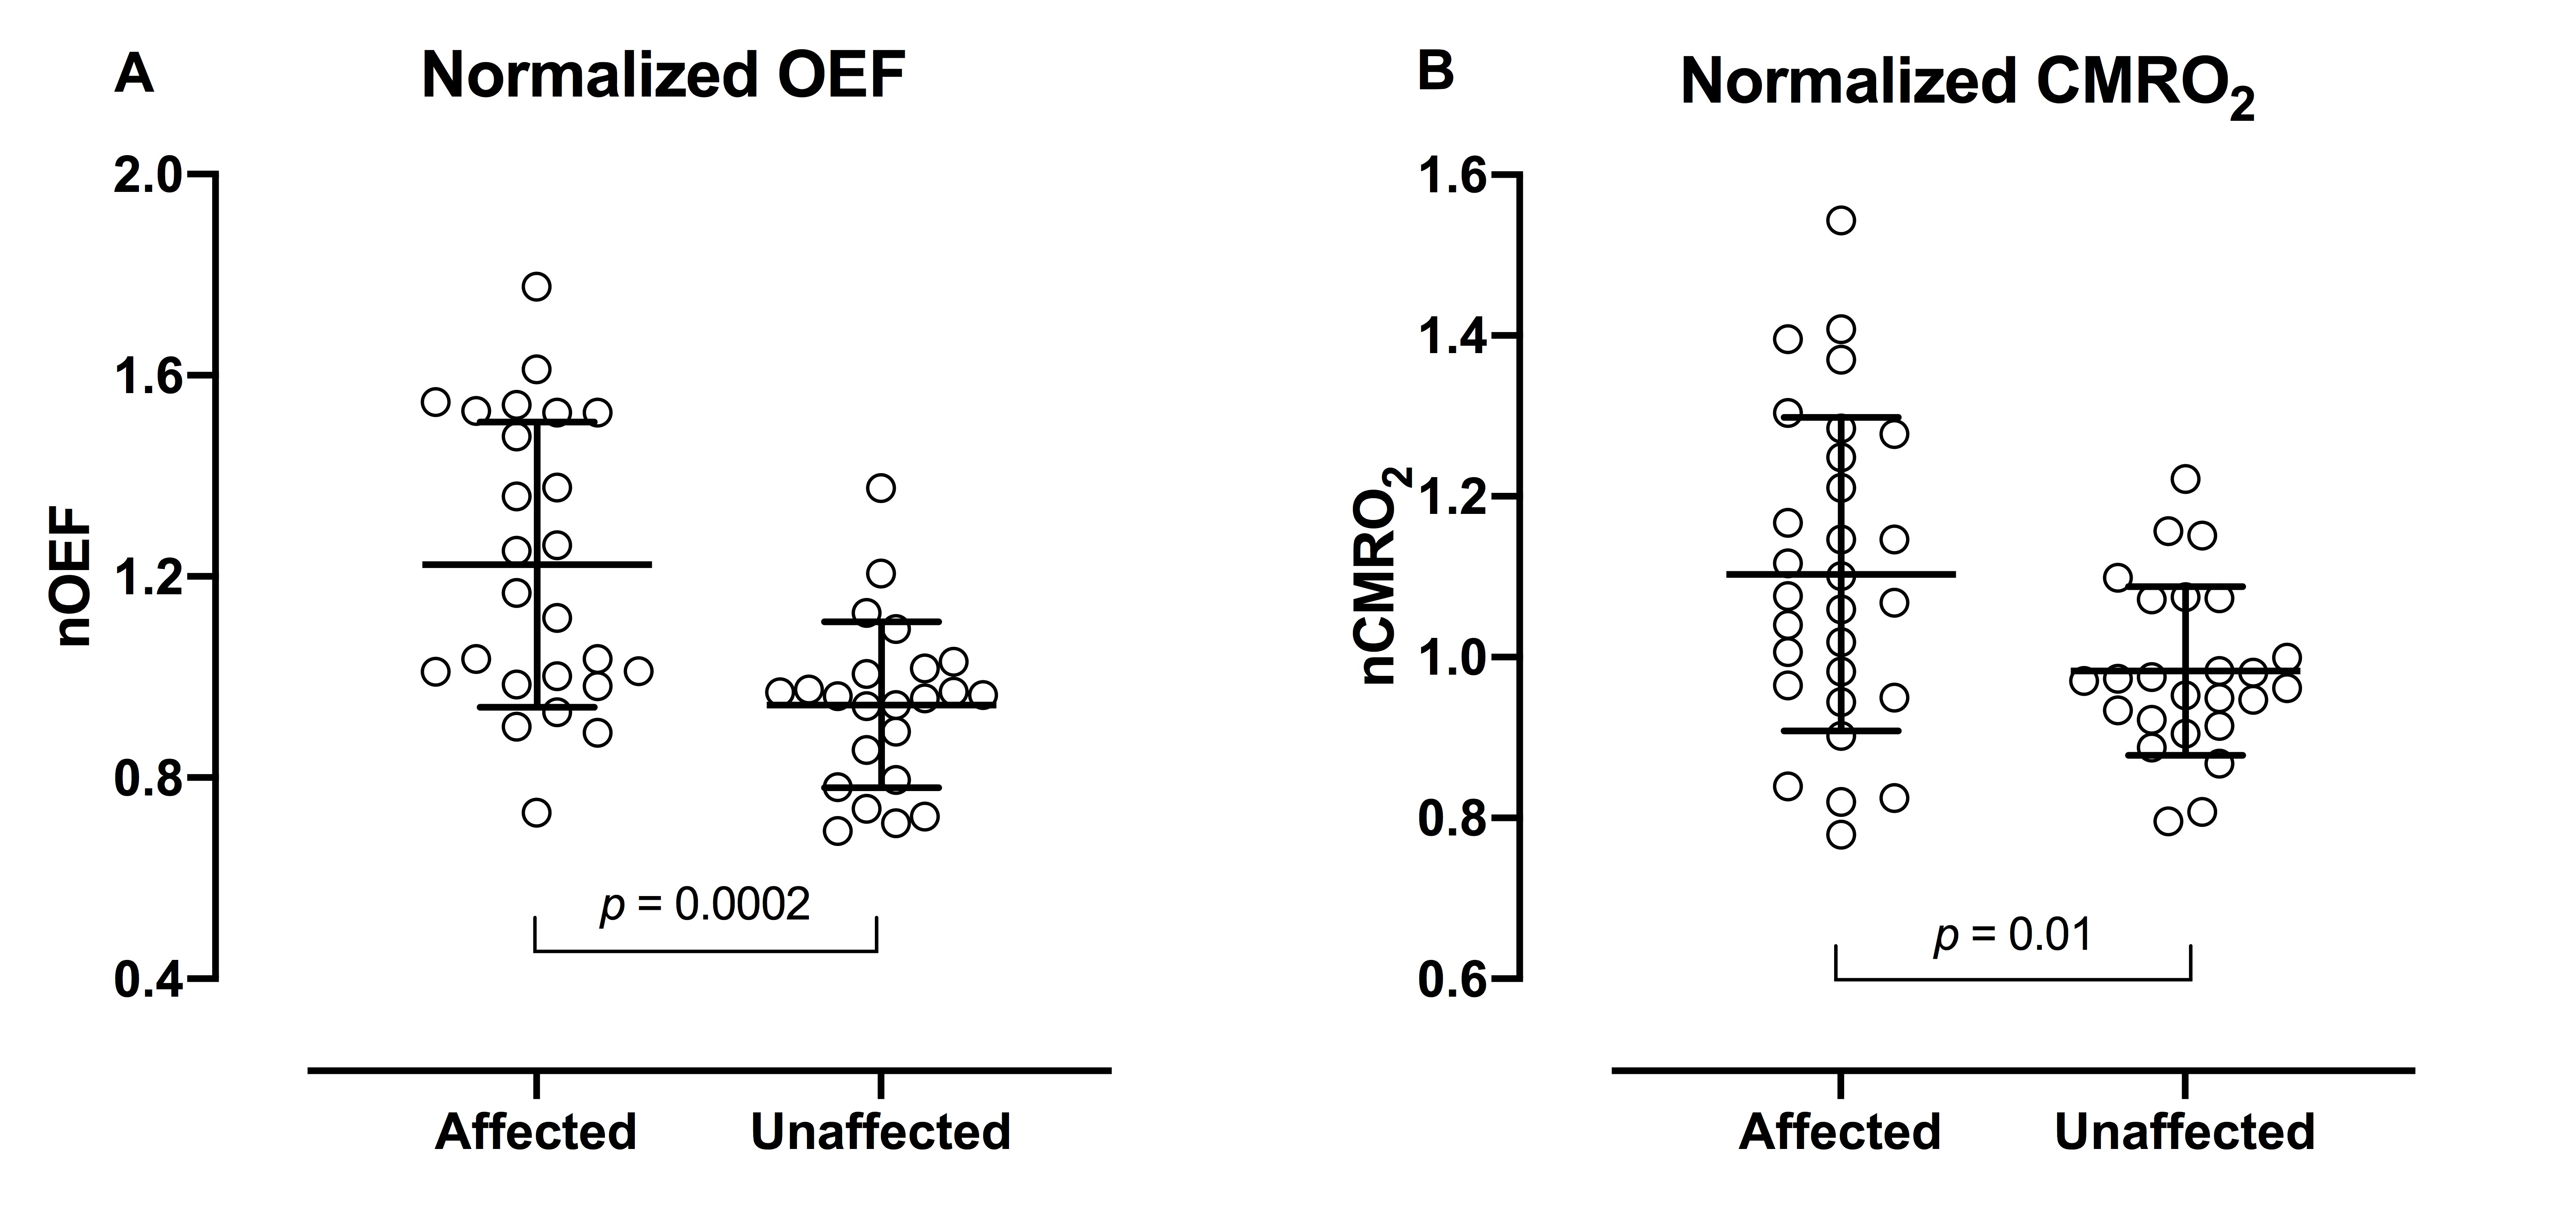
Group-averaged nOEF was higher in affected vascular regions (mean ± SD, 1.2 ± 0.29) compared to unaffected vascular regions (0.95 ± 0.17) (p = 0.0002), see figure 1A. Group-averaged nCMRO2 was slightly higher in the affected vascular regions (1.1 ± 0.20) compared to unaffected vascular regions (0.99 ± 0.10) (p = 0.01), see figure 1B. Two cases are presented in figure 2.Discussion
Affected vascular regions were observed to have increased nOEF compared to unaffected vascular regions, which is in line with expectation 1. Unexpected, significantly higher nCMRO2 in affected compared to unaffected vascular regions was found. The authors speculate that this observation is driven by a large spread in nCMRO2 values in affected regions, where factors such as revascularization surgery, delay and dispersion of the arterial input function and delayed flow may influence the data 9. Furthermore, acetazolamide, a vasodilatory agent, has been shown to decrease OEF with stable CMRO2 in healthy controls 10,11, although response in OEF and CMRO2 in patients with MMD is unknown, effects on the data presented cannot be ruled out. The two cases presented in figure 2 adds to the support of the use of DSC perfusion-based OEF and CMRO2 in patients with MMD, to distinguish between hemodynamic impaired and healthy vascular regions.Conclusion
OEF and CMRO2 derived from DSC perfusion shows promise in detecting cerebral hemodynamic impairment in patients with MMD. Further investigations are needed to clarify the clinical potential of and address possible limitations.Acknowledgements
The authors wish to thank Cercare Medical personnel for assistance with data processing and interpretation of results. No financial commitment to or from Cercare Medical before, during, or because of the present study was given.References
1. Derdeyn CP, Videen TO, Yundt KD, et al. Variability of cerebral blood volume and oxygen extraction: stages of cerebral haemodynamic impairment revisited. Brain. 2002;125(Pt 3):595-607.
2. Kuroda S, Houkin K. Moyamoya disease: current concepts and future perspectives. Lancet Neurol. 2008;7(11):1056-66.
3. Watchmaker JM, Juttukonda MR, Davis LT, et al. Hemodynamic mechanisms underlying elevated oxygen extraction fraction (OEF) in moyamoya and sickle cell anemia patients. J Cereb Blood Flow Metab. 2018;38(9):1618-30.
4. Liu Z, Li Y. Cortical Cerebral Blood Flow, Oxygen Extraction Fraction, and Metabolic Rate in Patients with Middle Cerebral Artery Stenosis or Acute Stroke. AJNR Am J Neuroradiol. 2016;37(4):607-14.
5. Lee M, Zaharchuk G, Guzman R, et al. Quantitative hemodynamic studies in moyamoya disease: a review. Neurosurg Focus. 2009;26(4):E5.
6. Jespersen SN, Ostergaard L. The roles of cerebral blood flow, capillary transit time heterogeneity, and oxygen tension in brain oxygenation and metabolism. J Cereb Blood Flow Metab. 2012;32(2):264-77.
7. Mouridsen K, Hansen MB, Ostergaard L, et al. Reliable estimation of capillary transit time distributions using DSC-MRI. J Cereb Blood Flow Metab. 2014;34(9):1511-21.
8. Jiang TT, Videen TO, Grubb RL, Jr., et al. Cerebellum as the normal reference for the detection of increased cerebral oxygen extraction. J Cereb Blood Flow Metab. 2010;30(10):1767-76.
9. Calamante F, Ganesan V, Kirkham FJ, et al. MR perfusion imaging in Moyamoya Syndrome: potential implications for clinical evaluation of occlusive cerebrovascular disease. Stroke. 2001;32(12):2810-6.
10. Okazawa H, Yamauchi H, Sugimoto K, et al. Effects of acetazolamide on cerebral blood flow, blood volume, and oxygen metabolism: a positron emission tomography study with healthy volunteers. J Cereb Blood Flow Metab. 2001;21(12):1472-9.
11. Vaclavu L, Petr J, Petersen ET, et al. Cerebral oxygen metabolism in adults with sickle cell disease. Am J Hematol. 2020;95(4):401-12.
Figures