1471
Relative cerebral blood volume reduction in hyperintense brain regions of glioma patients treated with proton radio(chemo)therapy1Helmholtz-Zentrum Dresden-Rossendorf, Institute of Radiooncology – OncoRay, Dresden, Germany, 2OncoRay - National Center for Radiation Research in Oncology, Faculty of Medicine and University Hospital Carl Gustav Carus, Technische Universität Dresden, Helmholtz-Zentrum Dresden-Rossendorf, Dresden, Germany, 3Institute of Neuroradiology, University Hospital Carl Gustav Carus and Medical Faculty of Technische Universität, Dresden, Germany, 4Department of Radiotherapy and Radiation Oncology, Faculty of Medicine and University Hospital Carl Gustav Carus, Technische Universität Dresden, Dresden, Germany, 5German Cancer Consortium (DKTK), Partner Site Dresden, and German Cancer Research Center (DKFZ), Heidelberg, Germany, 6National Center for Tumor Diseases (NCT), Partner Site Dresden, Germany: German Cancer Research Center (DKFZ), Heidelberg, Germany; Faculty of Medicine and University Hospital Carl Gustav Carus, Technische Universität Dresden, Dresden, Germany, and; Helmholtz Association / Helmholtz-Zentrum Dresden-Rossendorf (HZDR), Dresden, Germany
Synopsis
Imaging biomarkers capable of distinguishing between tumor recurrence and treatment effect are of high relevance for radiation therapy. In 14 glioma patients, we analyzed changes in relative cerebral blood volume (rCBV) in areas of hyperintensities on T2-weighted magnetic resonance imaging (MRI) appearing after irradiation with protons. rCBV values were evaluated comparing the baseline and the latest follow-up measurement both visually and based on histograms. A significant rCBV perfusion decrease was observed in those hyperintensities, which may be interpreted as treatment effect. Further work is needed correlating the rCBV changes with histology and patient outcome.
Introduction
Adjuvant radio(chemo)therapy (RT) is part of the treatment of patients with primary brain tumors. A major challenge following radiotherapy is to distinguish between tumor recurrence and radiation-induced effects. Hyperintensities in T2-weighted (T2w) MRI are commonly observed after radiotherapy but are not specific to the underlying tissue changes. The value of advanced methods, such as perfusion MRI, has already been shown for differentiating between tumor and treatment effect1,2. The aim of this study was to evaluate changes of relative cerebral blood volume (rCBV) in areas of T2w-hyperintensities in order to establish an imaging biomarker differentiating between tumor and treatment effect.Methods
In a longitudinal study, anatomical and functional MRI data of glioma patients undergoing gross tumor resection followed by RT were collected. We analyzed a subset of this cohort, which consisted of 14 glioma patients (3 grade II, 8 grade III, 3 grade IV, average age 48.1 ± 13.5 years) with tissue hyperintensities on T2w FLAIR images after proton beam irradiation. All MRI data were collected on a 3T Philips Ingenuity PET/MR scanner (Philips, Eindhoven, The Netherlands) using an 8 channel head coil and included anatomical T1w images [3D-GRE, TR/TE=10/3.7ms, FA=20°, voxel size 1×1×1mm3], contrast enhanced T1w images (CET1w) [3D Turbo Field Echo (TFE), TR/TE=8.2/3.7ms, FA=8°, voxel size 1×1×1mm3], 3D FLAIR images [TR/TE = 4800/293ms, TI = 1650ms, 2 averages, voxel size 0.49×0.49×0.5mm3, 360 slices], and dynamic susceptibility contrast (DSC) images using a PRESTO sequence [TR/TE=15/21ms, FA=7°, 60 dynamics, dynamic scan time=1.7s, voxel size 1.8×1.8×3.5mm3] with intravenous gadolinium contrast agent (0.1mol/kg, 4ml/s, 7s delay) followed by a saline flush (20ml, 4ml/s). The same dose of contrast agent was given as a pre-bolus for leakage correction of the DSC perfusion images. MRI scans were acquired prior to RT and post RT in three monthly intervals. In this analysis only the baseline data and the measurement of the latest follow-up time point (18.9 ± 8.2 months after RT) were considered.To determine cerebral blood volume (CBV) with DSC, the signal time curves of the dynamic PRESTO measurements were converted to concentration time curves. CBV was calculated by the division of the area under the time curve determined by a gamma variate fit function with the arterial input function. CBV-maps were normalized to a normal appearing WM ROI receiving a radiation dose less than 1Gy resulting in the rCBV. The hyperintensity mask indicated on T2w images was determined by the ratio of follow-up and baseline FLAIR images which were registered non-linearly to each other with ANTs3. The area showing contrast enhancements in the follow-up measurement was identified by comparing CET1w and T1w images. Hyperintensity mask (HI), contrast enhancement mask (CE), planning computed tomography images (CTs), radiation dose, clinical target volume (CTV) and gross tumor volume (GTV) resp. tumor bed volume (TBV) contour were rigidly registered first to the T1w image and then to the CBV image using ANTs3. The region of interest (ROI) was defined based on the hyperintensity mask in the follow-up measurement excluding the GTV resp. TBV and the CE. Four patients did not show any contrast enhancement. The ROI was transferred to the baseline images to evaluate the same region in baseline and follow-up measurement. The rCBV distributions were evaluated comparing the histograms of follow-up and baseline measurement and the Kolmogorow-Smirnow (KS)-test was used to examine the similarity of the histograms. Additionally, the rCBV alterations were analyzed visually.
Results
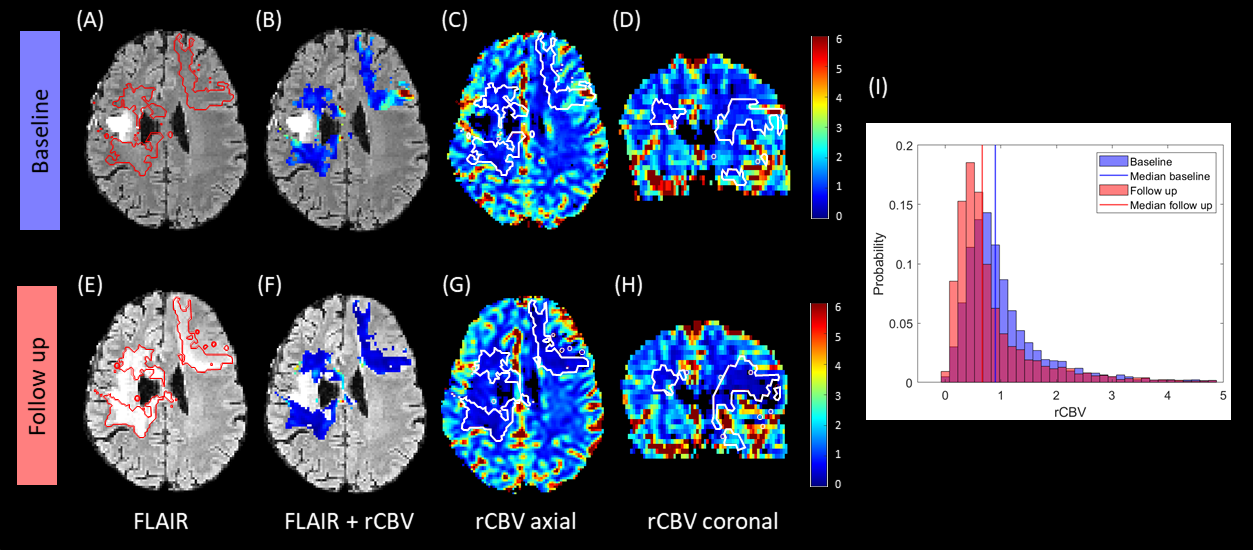
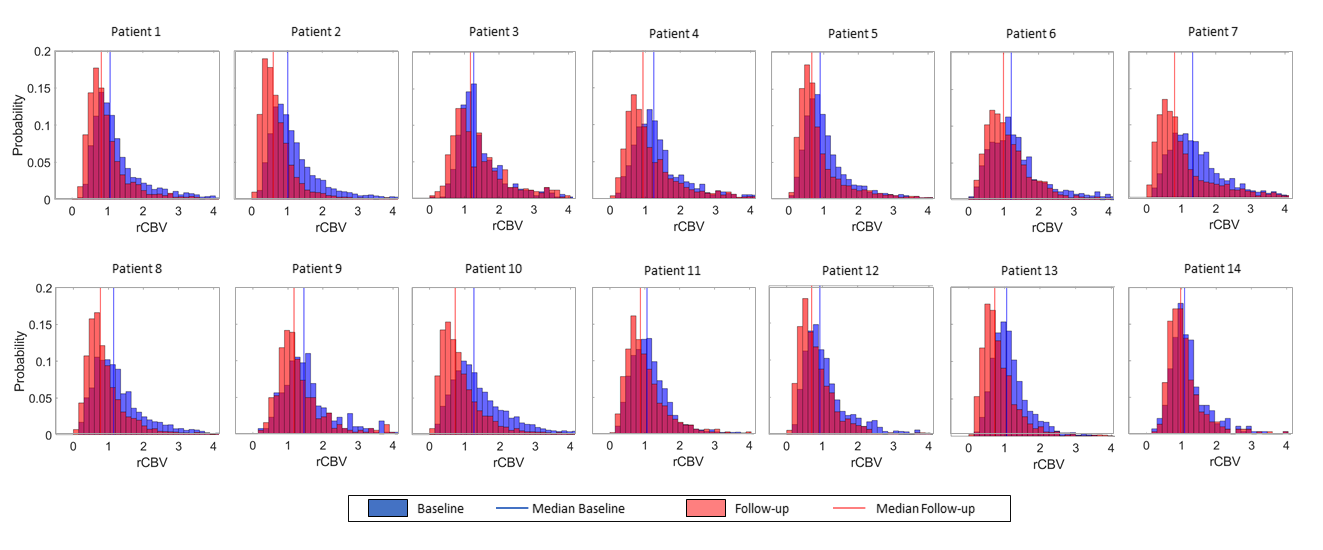
The KS-test revealed a significant inequality between follow-up and baseline histograms for all patients, which was expressed by a shift to lower rCBV values in the follow-up measurement (figure 2). Visual examination confirmed the impression of decreasing perfusion in the hyperintense areas, as shown for one patient in figure 1.Discussion
We found decreasing perfusion in the hyperintense areas which can be interpreted as treatment effect appearing after RT according to previous studies4-6. The baseline evaluation is more distorted by the vascular influence due to inaccuracies in registration and tissue deformation to the transmitted ROI. This can potentially lead to higher baseline perfusion values in some areas caused by grey matter (GM) or vessels. The baseline maps (figure 1B-D) show this effect of blood vessels to the rCBV in the ROI. Due to these factors, comparing mean rCBV values within the ROIs or voxel-based evaluation of the perfusion changes is compromised. Further work is now needed to correlate the observed perfusion changes with histological data.Conclusion
The combination of visual impression and histogram analysis showed a decreasing perfusion in the hyperintense areas. Quantitative evaluation requires the exclusion of the influence of the vessels as well as the consideration of tissue displacements. For further studies, the appearance of rCBV changes in areas depending on proximity to contrast enhancement would be of high interest7,8 as well as a dose-dependent evaluation.Acknowledgements
We thank all patients and healthy volunteers for participating in the respective studies. This work was partly funded by the National Center for Tumor Diseases (NCT), Partner Side Dresden.References
1. Wang L, Wei L, Wang J, Li N, Gao Y, Ma H, Qu X, Zhang M. Evaluation of perfusion MRI value for tumor progression assessment after glioma radiotherapy: A systematic review and meta-analysis. Medicine (Baltimore). 2020 Dec 24;99(52):e23766.
2. Verma N, Cowperthwaite MC, Burnett MG, Markey MK. Differentiating tumor recurrence from treatment necrosis: a review of neuro-oncologic imaging strategies. Neuro Oncol. 2013;15(5):515-534.
3. Avants BB, Tustison NJ, Stauffer M, Song G, Wu B, Gee JC. The Insight ToolKit image registration framework. Front Neuroinform 2014; 8:44
4. Hu LS, Baxter LC, Smith KA, et al. Relative cerebral blood volume values to differentiate high-grade glioma recurrence from posttreatment radiation effect: direct correlation between image-guided tissue histopathology and localized dynamic susceptibility-weighted contrast-enhanced perfusion MR imaging measurements. AJNR Am J Neuroradiol. 2009;30(3):552-558
5. Prager AJ, Martinez N, Beal K, Omuro A, Zhang Z, Young RJ. Diffusion and perfusion MRI to differentiate treatment-related changes including pseudoprogression from recurrent tumors in high-grade gliomas with histopathologic evidence. AJNR Am J Neuroradiol. 2015;36(5):877-885.
6. Barajas, Ramon F et al. Differentiation of recurrent glioblastoma multiforme from radiation necrosis after external beam radiation therapy with dynamic susceptibility-weighted contrast-enhanced perfusion MR imaging. Radiology 253 2 (2009): 486-96 .
7. Cluceru J, Nelson SJ, Wen Q, et al. Recurrent tumor and treatment-induced effects have different MR signatures in contrast enhancing and non-enhancing lesions of high-grade gliomas. Neuro Oncol. 2020;22(10):1516-1526
8. Muto, M., Frauenfelder, G., Senese, R. et al. Dynamic susceptibility contrast (DSC) perfusion MRI in differential diagnosis between radionecrosis and neoangiogenesis in cerebral metastases using rCBV, rCBF and K2. Radiol med 123, 545–552 (2018)
Figures