1470
QTM Quantifies Velocity of Tumor Vasculature in Gliomas
Dominick Jon Romano1, Qihao Zhang1, Ilhami Kovanlikaya2, Gloria Chia-Yi Chiang2, Pascal Spincemaille2, and Yi Wang3
1Biomedical Engineering, Cornell University, New York, NY, United States, 2Radiology, Weill Cornell Medical College, New York, NY, United States, 3Radiology, Cornell University, New York, NY, United States
1Biomedical Engineering, Cornell University, New York, NY, United States, 2Radiology, Weill Cornell Medical College, New York, NY, United States, 3Radiology, Cornell University, New York, NY, United States
Synopsis
A recently proposed perfusion analysis method, Quantitative Transport Mapping (QTM), was applied in malignant Glioma (grade III and IV) to obtain the flow speed map. Pathological lesions were separated into DCE-Enhancing, Darkening, and total affected ROIs. The average speed scalar for each ROI suggests that DCE-Enhancing tumor presents with significantly increased speed while non-enhancing tumor does not experience a speed change.
Introduction
Perfusion weighted imaging such as PET, DCE-CT, and DCE-MRI have become an important component in the diagnosis diseases such as cancer (1). Quantifying perfusion parameters from the image maps can potentially provide researchers and clinicians with tissue specific information (1-3). Gliomas are of particular interest, and are partially graded based upon T2-FLAIR and DCE-MRI findings (2). Higher grade gliomas, called glioblastomas, are characterized by a DCE-enhancing ring and a non-enhancing surrounding region (4). The observed DCE enhancement may likely be due to angiogenesis — vascular formation due to hypoxic and growth signaling which is typical of tumors and more pronounced for aggressive gliomas (5). In turn, increased vascular density may induce greater flow speeds, defined as the magnitude of vascular velocity, in these regions] (6). To investigate this matter, QTM was applied to obtain flow speed maps of the whole brain. ROI selection based on DCE enhancement and tumor morphology allowed to split the pathological ROI into Enhancing, non-enhancing, and total tumor regions. Our results show that DCE-Enhancing glioma regions have significantly higher flow speeds compared to contralateral normal appearing white matter regions. The non-enhancing regions did not experience a change in flow speed.Theory and Methods
The tracer concentration is derived from the DCE-MRI intensity assuming a linear relationship $$$c(\bf{r},t) \propto I(\bf{r},t)$$$ (7). The time-resolved concentration map was then processed using QTM. This consists of fitting the concentration to the transport equation in the convection dominant regime (7):$$\partial_{r}c(\bf{r},t)=-\nabla\cdot(c(\bf{r},t)\cdot\bf{u}(\bf{r})) [1]$$
Where $$$\partial_{t}$$$ is the time derivative, $$$\nabla$$$, is the gradient operator with the following representation in cartesian coordinates ($$$\nabla \to (\partial_x,\partial_y,\partial_z)$$$) $$$c(\bf{r},t)$$$ is the tracer concentration spatiotemporal scalar field at voxel position $$$\bf{r} = (r^{x}, r^{y}, r^{z})$$$ encloeds in the volume $$$\omega \to (N_{x},N_{y},N_{z})$$$ along $$$(x,y,z)$$$ and time index $$$t\in [1,2,...,N_{t}-1]$$$ with $$$N_{t}$$$ as the number of frames in the acquisition the voxel velocity field is $$$\bf{u}(\bf{r})$$$ Eq. 1 is implemented using finite differences. The resulting linear system is solved as an optimization problem that is regularized using total variation with the regularization parameter$$$\lambda = 10^{-4}$$$ chosen according to the L-curve method as detailed in a previous QTM study (7):
$$\bf{u}=argmin_{\bf{u}} \sum_{t=1}^{N_{t} - 1}|\partial_{t}c+\nabla \cdot (c\bf{u})^{2}_{2}+\lambda |\nabla \bf{u}|_{1}| [2]$$
The speed scalar map is then the vector magnitude of the velocity, $$$u \equiv |\bf{u}|$$$ DCE-MRI images of high grade (III-IV) glioma patients (n=15) were processed with QTM. For each case, an experienced radiologist selected total, enhancing, and non-enhancing tumor regions along with a control region contralateral to the tumor (Figure 1). The enhancing regions correspond to relatively hyperintense patterns post-contrast. Non-enhancing regions are characterized by little to no enhancement observed in the tumor region. Lastly, the control is defined as healthy tissue contralateral to the tumor region. The speed was averaged over these regions and used for statistical testing. (:p<0.05, :p<0.01, :p<0.001)
Results
Figure 2 shows that the entire tumor ROI displayed a significantly higher average flow speed compared to the control. Furthermore, flow speeds in DCE-enhancing regions were significantly higher compared to the control, while non-enhancing speeds could not be distinguished from the control distribution (Figure 2a, c). This result indicates that DCE-enhancing and non-enhancing tumor regions have distinct flow speeds. To further investigate this idea, we directly compare the enhancing and non-enhancing pathology. We found that the enhancing region produced significantly higher flow speeds compared to non-enhancing flow speeds (Figure 2b,c, p<0.001), indicating that a total tumor ROI average of flow speed is not justified. DCE-Enhancing ROI averages had significantly higher ROI speed averages compared to the total tumor regions speed (Figure 2a,b, p<0.001). Meanwhile, DCE- non-enhancing region speeds were significantly lower than the total tumor region flow speed (Figure 3). These results suggest that DCE-enhancing and non-enhancing tumor regions have differing biofluid properties.Discussion and Conclusion
Angiogenesis is characteristic of high-grade gliomas (5,8). The literature has reported increased blood flow (9) and perfusion in gliomas (2). Our observation of increased blood flow at DCE-brightening further supports that gliomas change tissue perfusion as detailed in previous reports and simulations (10,11). Interestingly, the DCE-non-enhancing region experienced no change in flow speed magnitude. This is likely due to the peripheral invasion and edema areas where nascent growth factor signals have not yet taken effect. Our results suggest that blood flow speed is distinct to DCE-enhancing regions, providing further insight into the interpretation of glioma DCE-MRI images.Acknowledgements
No acknowledgement found.References
1. Türkbey B, Thomasson D, Pang Y, Bernardo M, Choyke PL. The role of dynamic contrast-enhanced MRI in cancer diagnosis and treatment. Diagn Interv Radiol 2010;16(3):186-192. 2. Jain R, Griffith B, Alotaibi F, Zagzag D, Fine H, Golfinos J, Schultz L. Glioma Angiogenesis and Perfusion Imaging: Understanding the Relationship between Tumor Blood Volume and Leakiness with Increasing Glioma Grade. American Journal of Neuroradiology 2015;36(11):2030. 3. Wälchli T, Mateos JM, Weinman O, Babic D, Regli L, Hoerstrup SP, Gerhardt H, Schwab ME, Vogel J. Quantitative assessment of angiogenesis, perfused blood vessels and endothelial tip cells in the postnatal mouse brain. Nat Protoc 2015;10(1):53-74. 4. Keil VC, Gielen GH, Pintea B, Baumgarten P, Datsi A, Hittatiya K, Simon M, Hattingen E. DCE-MRI in Glioma, Infiltration Zone and Healthy Brain to Assess Angiogenesis: A Biopsy Study. Clinical Neuroradiology 2021. 5. Hardee ME, Zagzag D. Mechanisms of glioma-associated neovascularization. Am J Pathol 2012;181(4):1126-1141. 6. Gillies RJ, Schornack PA, Secomb TW, Raghunand N. Causes and effects of heterogeneous perfusion in tumors. Neoplasia 1999;1(3):197-207. 7. Zhou L, Zhang Q, Spincemaille P, Nguyen TD, Morgan J, Dai W, Li Y, Gupta A, Prince MR, Wang Y. Quantitative transport mapping (QTM) of the kidney with an approximate microvascular network. Magn Reson Med 2021;85(4):2247-2262. 8. Perry A, Wesseling P. Histologic classification of gliomas. Handb Clin Neurol 2016;134:71-95. 9. Shin JH, Lee HK, Kwun BD, Kim J-S, Kang W, Choi CG, Suh DC. Using Relative Cerebral Blood Flow and Volume to Evaluate the Histopathologic Grade of Cerebral Gliomas: Preliminary Results. American Journal of Roentgenology 2002;179(3):783-789. 10. Alberding JP, Secomb TW. Simulation of angiogenesis in three dimensions: Application to cerebral cortex. PLoS Comput Biol 2021;17(6):e1009164. 11. Pries AR, Secomb TW, Gaehtgens P. Structural adaptation and stability of microvascular networks: theory and simulations. Am J Physiol 1998;275(2):H349-360.Figures
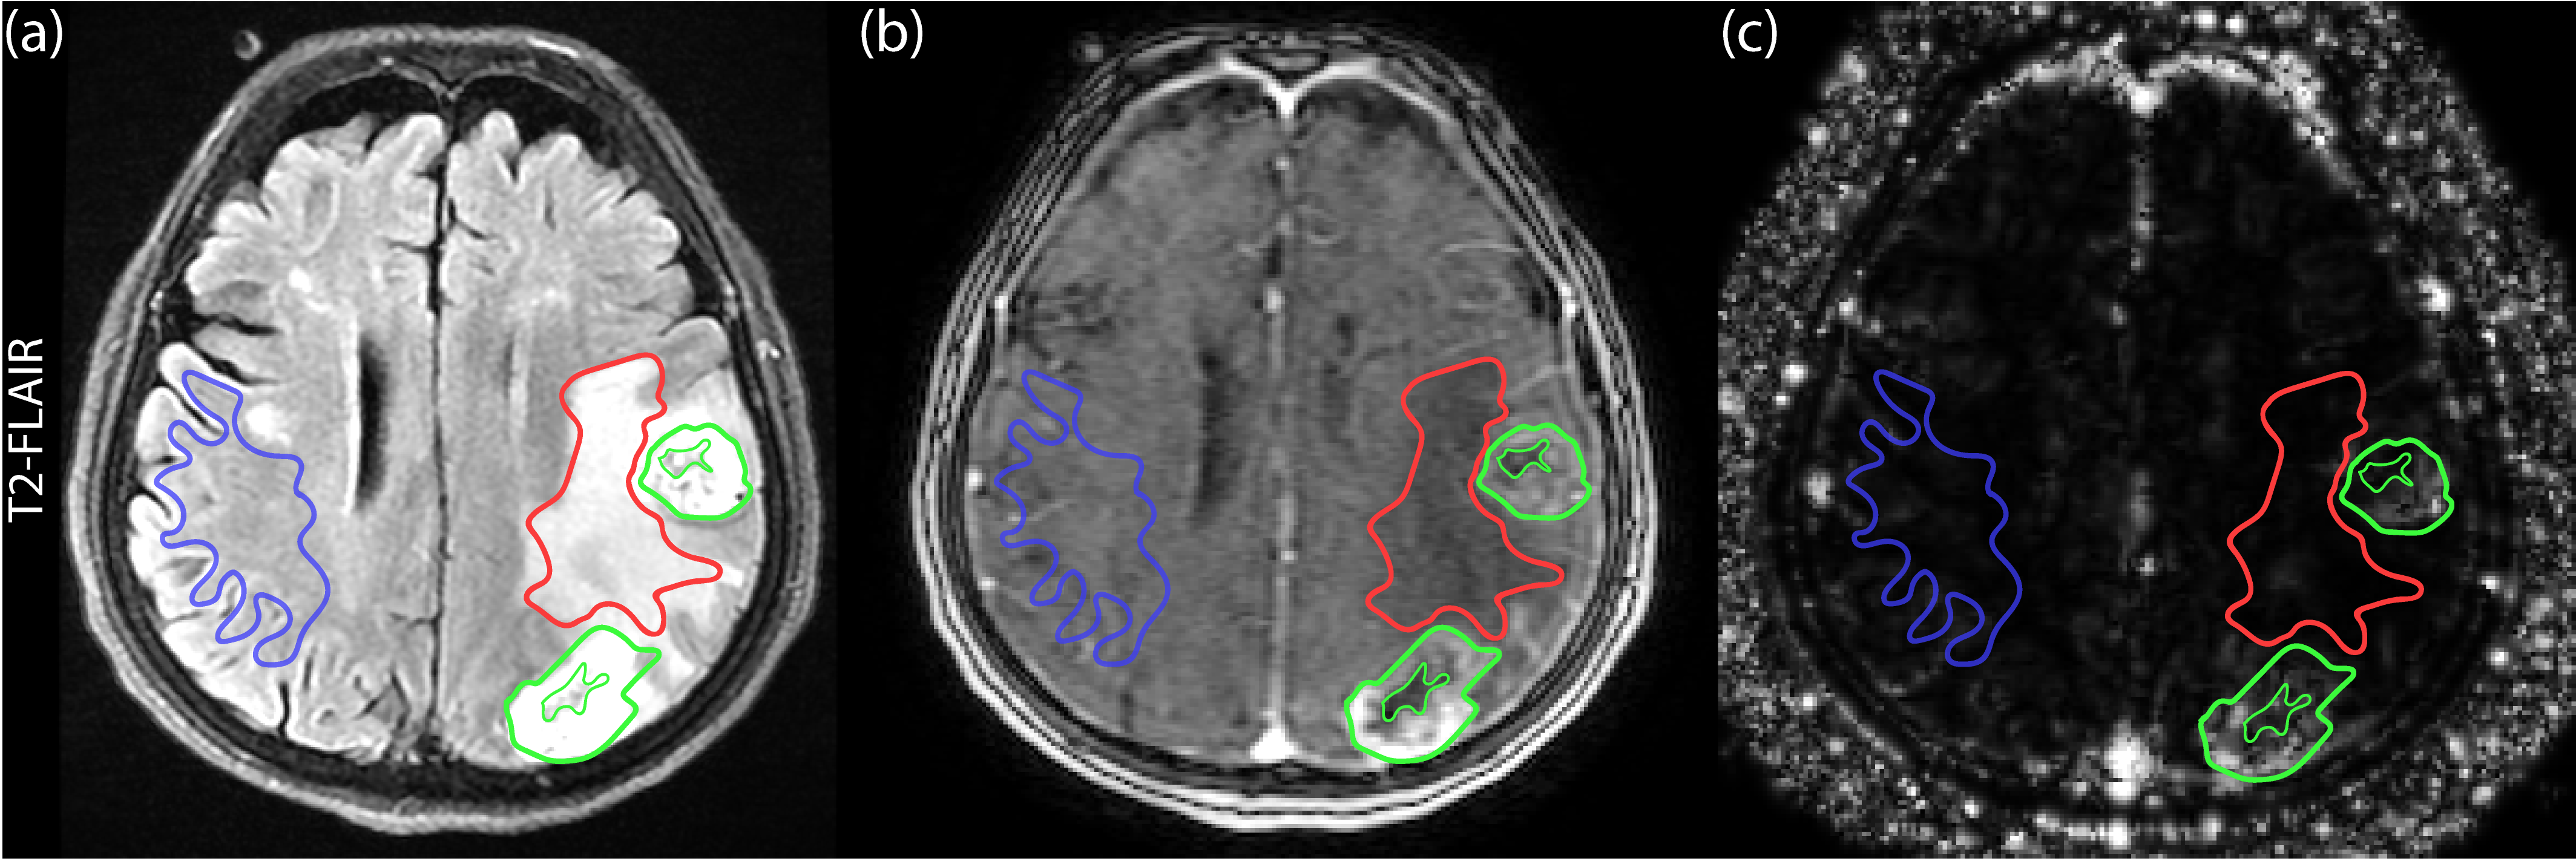
Figure 1. Illustration of glioma ROI selection. (a) T2-FLAIR reference. (b)
DCE-MRI (c) Representation of tumor ROI. (c) speed scalar map from solving the
QTM inverse problem. DCE-enhancing regions are contoured between the two green
lines. The non-enhancing region (red) corresponds to edema and invasion signals
on FLAIR. Control ROI was determined to be the contralateral normal appearing
white matter to the tumor (blue). These masks are then applied to the speed
scalar map to obtain the ROI averaged speed.
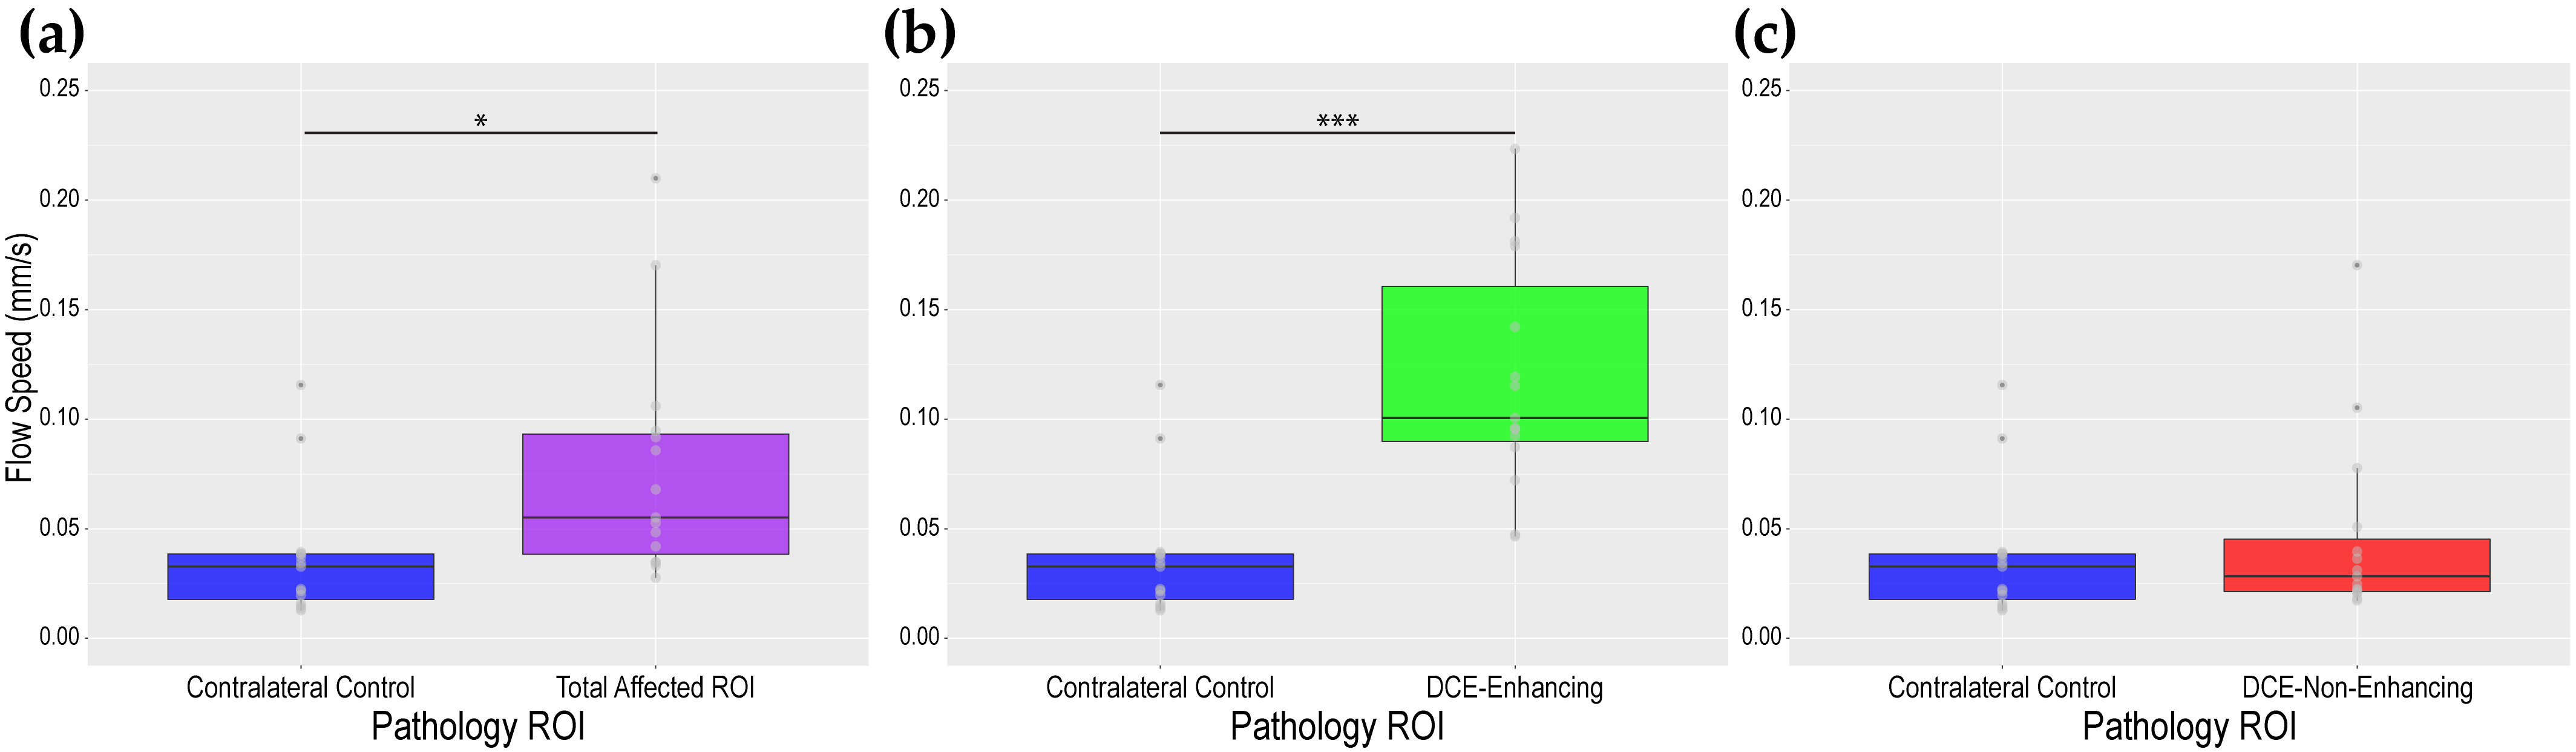
Figure 2. The y-axis for each of the presented plots
represents the flow speed and are on the same scale. (a) Flow speed
comparisons for the control and total tumor ROI. (b) Flow speed
comparisons for the control and DCE-enhancing tumor ROI. (c) Flow speed
comparisons for the control and DCE-Non-Enhancing ROI.
DOI: https://doi.org/10.58530/2022/1470