1469
Multi-modal Study Comparisons of Hemodynamics after a Traumatic Brain Injury (TBI) and Subarachnoid Hemorrhage (SAH)1Biomedical Engineering, University of Arizona, Tucson, AZ, United States, 2Physiology, University of Arizona, Tucson, AZ, United States
Synopsis
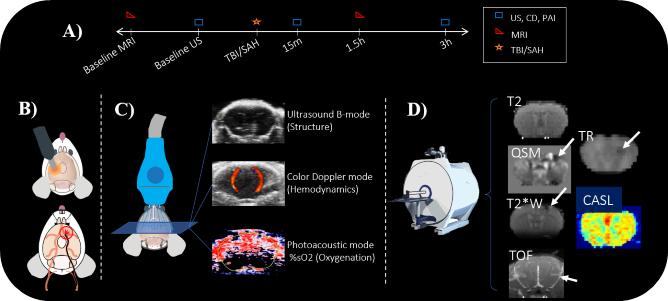
To examine the first hours after brain injury, we utilized photoacoustic imaging (PAI), ultrasound (US), and color doppler (CD) alongside MRI metrics. We wanted to investigate the early pathomechanisms that involve hemodynamic response such as blood flow, oxygenation, and edema.
Introduction
The first hours after brain injury are a critical period during which pathomechanisms evolve and give rise to secondary outcomes that will determine the ultimate outcomes of degeneration and recovery. At the center of this time course are hemodynamic changes including decreased blood flow and tissue oxygenation that can be transient or associated with cell damage and loss. While these cerebrovascular pathomechanisms are critical, they remain poorly understood in the hyperacute period after injury1. Non-invasive imaging in animal models of traumatic brain injury and hemorrhage plays an important role in determining the pathomechanisms. Recently, advances in imaging technology such as photoacoustic imaging (PAI) and ultrasound (US) for brain applications offer the ability to capture this acute time period for us to better understand and study early pathological mechanisms2. MRI metrics such as Arterial Spin Labelling (ASL) allow us to measure cerebral blood flow (CBF), diffusivity, which measures water restriction that is associated with edema, and T2 all offer important information about disease pathology. Additionally, PAI measures percent of oxygenation saturation, an important metric that usually requires invasive techniques3 to quantify along with color doppler (CD), which quantifies blood flow velocity.In our study, we set out to combine metrics from MRI, PAI, CD, and ultrasound (US) to better understand hemodynamic injury which is characterized by oxygenation, blood flow, and edema. We implemented this multi-modality experimental design in mice utilizing 2 different injury schemes, Traumatic Brain Injury (TBI) and Sub-arachnoid Hemorrhage (SAH).
Methods
Baseline scans were acquired prior to injury on both the MRI and PAI/CD/US equipment. Our PAI/CD/US battery was composed of a structural image of the brain, B mode, followed by CD and then PAI for oxygenation. All PAI, CD, and US were obtained at 0.15mm intervals across the entire brain (approximately 99 slices). The MRI battery was composed of Diffusion Tensor Imaging (DTI) acquired using Echo Planar Imaging (EPI) (b values 800-1600 s/mm2,60 directions; 250x250x400 micron resolution), T2 along with ASL (which we use to obtain CBF or blood water; 281x281x1000 micron). Following baselines, we induced either a TBI using controlled cortical impact (CCI) or SAH using a previously established endovascular perforation model. TBI-sham mice were placed on stereotaxic frame but did not receive CCI and SAH-sham mice underwent occlusion of the carotid but no advancement of the filament to induce hemorrhage. Each group had 6 mice (3 male and 3 female). PAI/CD/US scans were collected 15 minutes after injury, followed by MRI scans collected at 90 minutes, and then PAI/CD/US scans again at the 3-hour time point. Animals were kept consistently on isoflurane anesthesia and 50-50 O2 medical air mixture for the entire duration of experiments.All data from both modalities were manually segmented to separate brain from skull and were separated into 2 hemispheres, ipsilateral and contralateral. Extents of injury for were manually drawn for MRI T2 and diffusivity maps such as Trace (TR). Scan types that collected only 3 slices in the brain, such as ASL were averaged for analysis. MRI data was processed using University of Arizona’s high performance computing cores which included TORTOISE3,4,5 for DTI. PAI/CD/US scans were processed utilizing VEVO6 imaging analysis software.
For statistical analysis, we performed repeated measure analysis of variance (ANOVA) alongside post-hoc Tukey-Kramer test.
Results
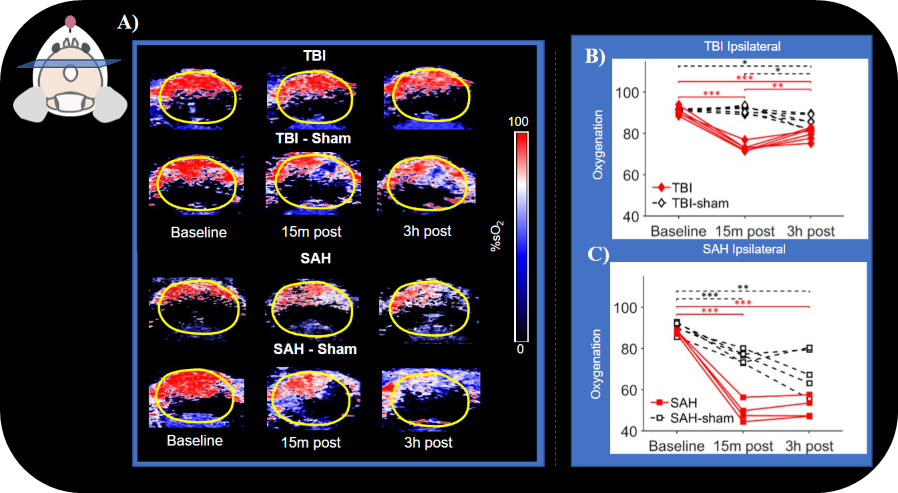
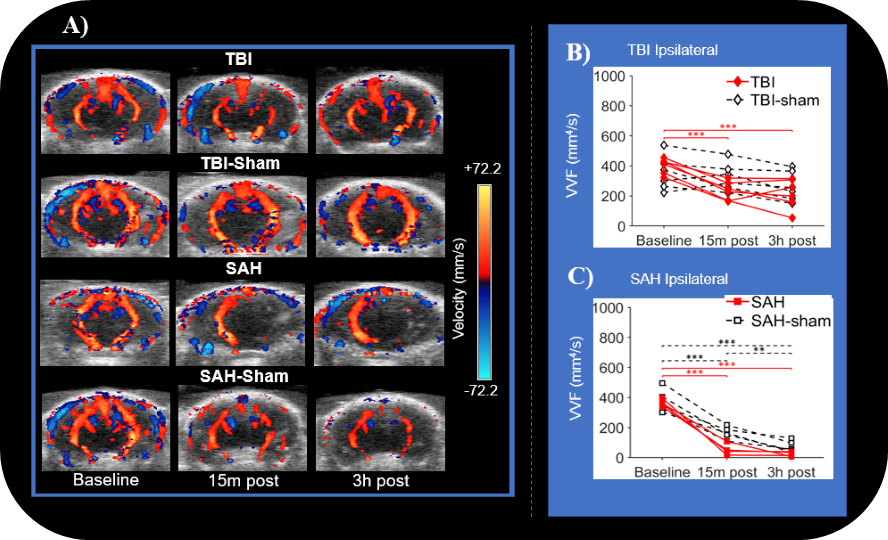
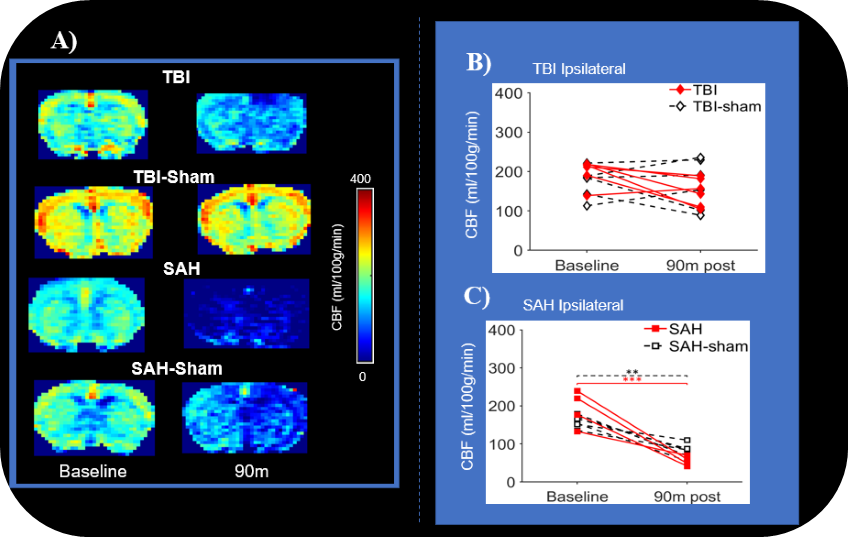
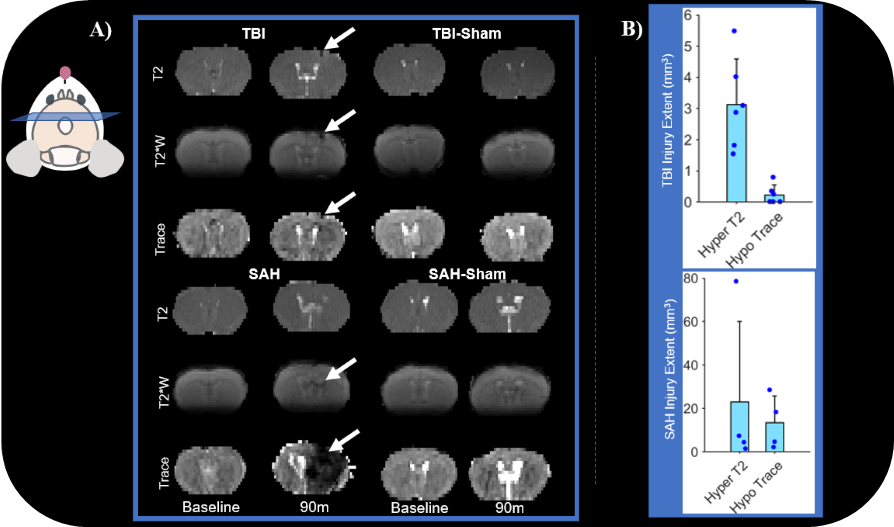
Line plots of TBI and TBI-sham ipsilateral oxygenation showed significant difference from baseline compared to 15 minute and the 3-hour post-injury. A similar trend was also observed for SAH and SAH-sham. Ipsilateral VVF was significantly different from baseline for TBI at 15 minutes and 3 hours post-injury but was not observed in TBI-sham. Both SAH and SAH-sham had a significant difference in VVF from baseline to the other 2 post-injury time points. No significant difference was observed when comparing CBF on the ipsilateral side of TBI or TBI-sham. This is in stark contrast to what we observed in SAH and SAH-sham, which both had significant difference in CBF value from baseline. Hyperintensities were observed in T2 while hypo intensities were observed in TR for both injury types. Extent of injury location for T2 and TR maps differed in both injury types. We observed smaller extent of TR compared to T2.Discussion
Multi-modal assessment of blood flow, oxygenation and edema were combined to assess the first hours following TBI or hemorrhage. For all metrics assessed the SAH model produce far more prominent outcomes. Both ASL and CD/US demonstrated reduced blood flow for both TBI and SAH models and Oxygenation was also significantly reduced in both injury models at 15 minutes and 3 hours after injury. Diffusivity was found in both models to be far less extensive than ASL or sO2 reductions suggesting differential outcomes for tissue with the same level of blood flow or oxygenation levels acutely. In the TBI model, the extent of reduced diffusivity was very small and T2 hyperintensities were found to be more extensive in volume.Conclusions
We successfully were able to investigate oxygenation, CBF, and edema which are all important facets involved in vasculature injury. The characterization of differences between TBI and SAH models was made more rigorous by the multi-model assessment using PAI, CD, US, and MRI across the whole mouse brain.Acknowledgements
All imaging was performed in the UA translational bioimaging resource (TBIR) and made possible by the NIH small instrumentation grant: S10 OD025016.References
1. W Tong , P Zheng , J Xu, Y Guo, J Zeng, W Yang, et al. Early CT signs of progressive hemorrhagic injury following acute traumatic brain injury. Neuroradiology. 2011 May;53(5).
2. P Yushkevich, J Piven, H Hazlett, R Smith, S Ho, J Gee, and G Gerig. User-guided 3D active contour segmentation of anatomical structures: Significantly improved efficiency and reliability. Neuroimage 2006 Jul 1;31(3):1116-28.
3. C.Pierpaoli, L.Walker, M.O.Irfanoglu, A.Barnett, P.Basser, L-C. Chang, C.Koay, S.Pajevic, G.Rohde, J.Sarlls, and M. Wu. TORTOISE: an integrated software package for processing of diffusion MRI data. ISMRM 18th annual meeting,Stockholm,Sweden, 2010; #1597.
4. M. O. Irfanoglu, A. Nayak, J. Jenkins, and C. Pierpaoli. TORTOISEv3:Improvements and New Features of the NIH Diffusion MRI Processing Pipeline, ISMRM 25th annual meeting, Honolulu, HI, abstract #3540
5. M.O. Irfanoglu, P. Modi, A. Nayak, E. B. Hutchinson, J. Sarlls, C. Pierpaoli. DR-BUDDI (Diffeomorphic Registration for Blip-Up blip-Down Diffusion Imaging) method for correcting echo planar imaging distortions, Neuroimage. 2015 Feb 1;106:284-99. doi: 10.1016/j.neuroimage.2014.11.042. Epub 2014 Nov 26
6. Vevo 3100 Preclinical Imaging System, FUJIFILM VisualSonics; https://www.visualsonics.com/product/imaging-systems/vevo-3100.
Figures