1468
MRI Estimates of Cerebral Blood Flow and Venous Oxygenation as Surrogate Markers in a Mouse Model for Sickle Cell Anemia1Athinoula A. Martinos Center for Biomedical Imaging, Massachusetts General Hospital, Chalrestown, MA, United States, 2Pfizer, Inc, Cambridge, MA, United States
Synopsis
We have assessed cerebral blood flow (CBF), venous T2, and hematocrit (Hct) in mice to characterize the performance of MR markers of cerebral physiology in wildtype (WT) mice and the Townes transgenic mouse model of Sickle Cell Disease (SCD). SCD mice exhibited increased CBF, decreased venous T2, and decreased Hct compared to matched WT mice. Combining MR measures of CBF and venous T2 with Hct measurement improved the disease-specific differentiation. Test-retest variability was approximately 20% for CBF and venous T2 and 10% for Hct. Methods employed in this study are fully translational to the clinic.
INTRODUCTION
SCD is characterized by a severe hemolytic anemia characterized by low Hct. This contributes to elevated cerebrometabolic strain, which manifests in SCD patients by compensatory increases in CBF and OEF (1-2), even prior to silent infarct. It is thus thought that measures of CBF and OEF may be useful translational imaging tools for assessing local pre-ischemic metabolic stress and may be valuable for assessing ameliorating effect of pharmacologic intervention. To that end, this study was designed to provide data to determine MRI variability, test-retest reproducibility, and disease-related differentiation of CBF and OEF using a Townes model of SCD.METHODS
All animal procedures were performed under an IACUC-approved protocol. Six WT mice and 6 Townes SC mice were scanned once per week for 3 weeks. In each scanning session, we measured CBF, venous T2 from the sagittal sinus, and hematocrit (Hct) from tail snips at the end of each imaging session. Differentiation between WT and SC mice was quantified by effect sizes based upon Cohen’s D using both primary data (CBF, T2, Hct) and derived quantities.CBF measurements employed unbalanced pseudo-continuous arterial spin labeling (pCASL) (3) with 2500 ms labeling and control RF pulse trains, a 1 ms inter-pulse separation, progressive phase tables, and a slice plane located 10 mm from the magnetic isocenter and about 4 mm posterior to cerebellum. Flow phantom studies demonstrated good insensitivity to fluid velocity across a physiological range. Data were analyzed both on a voxel-wise level and using a whole-brain index after spatial normalization using a multi-subject mouse MRI template (4).
Venous blood T2 was assessed using a T2-Relaxation-Under-Spin-Tagging (TRUST) sequence developed and disseminated by Johns Hopkins University (5). Based upon a field strength- and hematocrit-dependent calibration (6,7), results were converted to venous saturation (Yv).
RESULTS
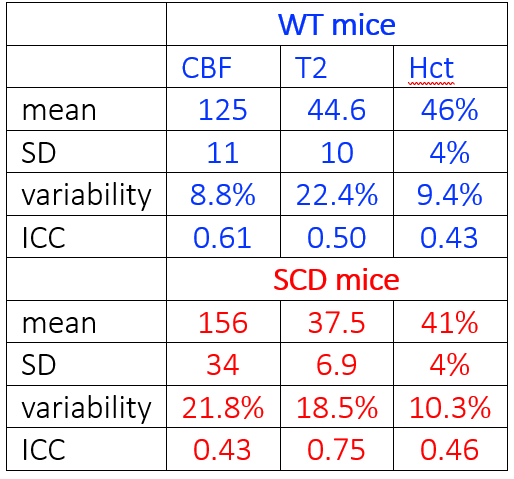
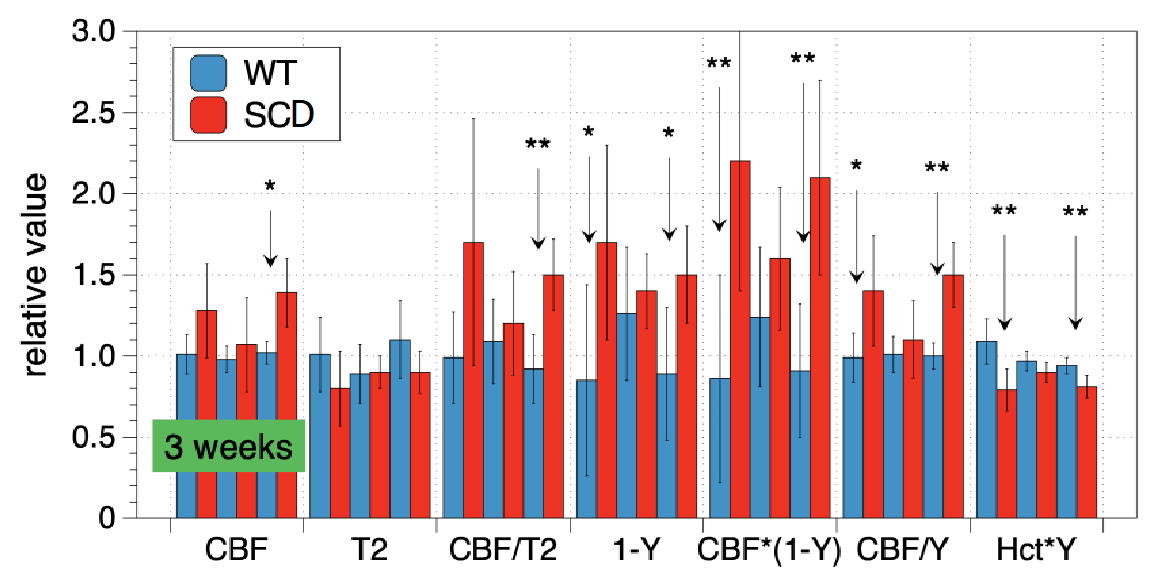
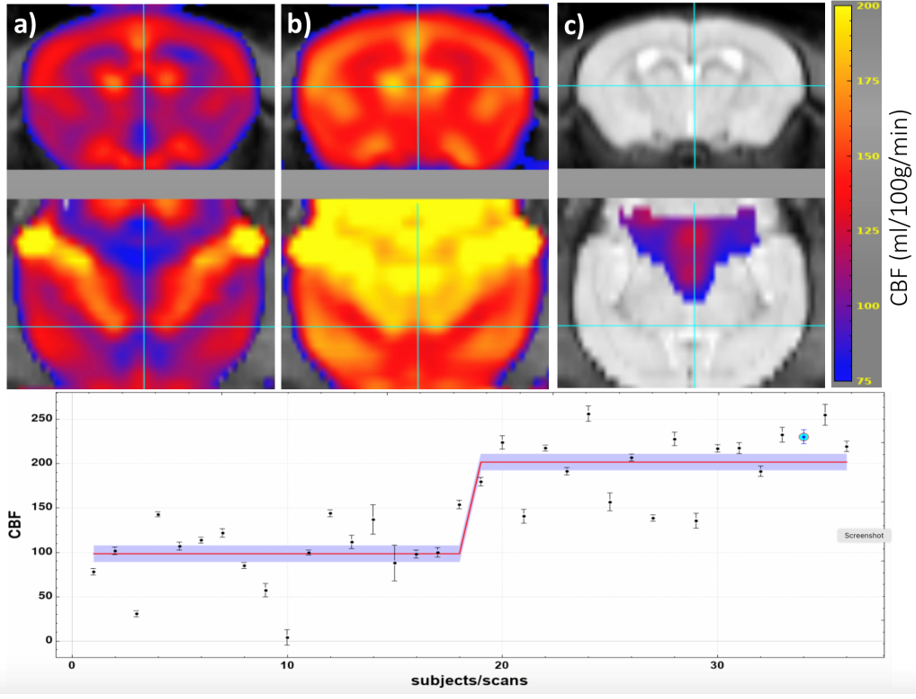
Primary measurements are summarized in Table 1. CBF demonstrated test-retest variabilities of 9% and 22% in WT and SCD mice, respectively, and measurements of sagittal sinus T2 showed variabilities of 22% and 19%. Hematocrit variability was approximately 10%. Figure 1 uses relative values, normalized to WT averages, to illustrate test-retest variability across weeks and to demonstrate differentiation between WT and SCD mice cohorts.Whole-brain measurements of CBF (Figure 2) illustrate that the highest difference in regional CBF occurs in occipital regions and may be indicative of reduced transit times due to higher flow velocities in large feeding arteries of SCD mice (8). The graph in Figure 2 shows that CBF in medial occipital regions is elevated 2-fold in SC animals (last 18 data points) relative to WT animals (first 18 data points). This difference is much larger than the 25% whole-brain difference in CBF listed in Table 1.
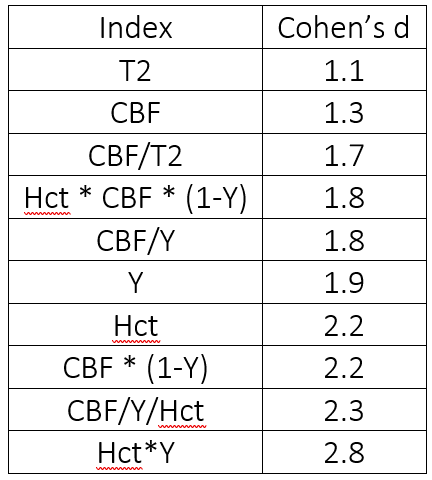
All measurements yielded large effect sizes (d>0.8). CBF alone (d=1.3) provided better discrimination than T2 alone (d=1.1), but neither matched Hct (d=2.2), combined MRI indices like CBF/T2 (d=1.7), or combined MRI and benchtop indices like CBF*(1-Y) (d=2.2) or Hct*Y (d=2.8). Table 2 summarizes the effect sizes for SC vs. WT.
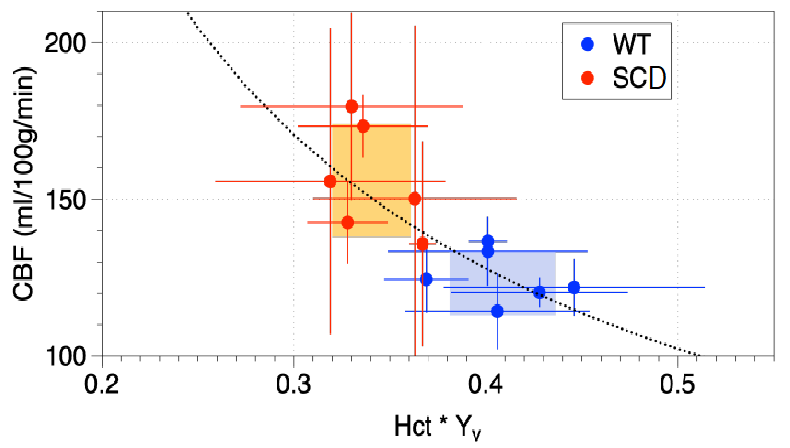
Bench measurements of Hct further helped differentiate animals beyond measurements based only on imaging. Figure 3 shows CBF versus the product of Hct and Yv, under the assumptions that 1) CMRO2 is preserved in disease and 2) the ratio of venous saturations is a proxy for the ratio of arterial changes.
DISCUSSION
SCD reduces blood oxygen carrying capacity and therefore is associated with elevated CBF as a response mechanism to preserve oxygen delivery to the brain. In agreement with another report (8), we found significantly elevated CBF in this Townes model of SCD. Additionally, we found that TRUST-based measurements of venous blood T2, which can be related to venous oxygen saturation, provide additional power to discriminate SCD from WT mice. The combination of these measurements, along with Hct, provide means to monitor disease progression and treatment using cerebral markers that may be indicative of deleterious effects.This study suggests that CBF appears to roughly compensate for losses in oxygen carrying capacity. The increase in CBF was greater than the reduction in Hct, but oxygen carrying capacity also depends upon the ability of blood cells to bind oxygen. Reduced venous saturation in SCD could indicate either reduced arterial saturation or increased OEF.
The Hct values in WT mice (46%) were higher compared to the SCD mice (41%). These Hct values in SCD mice were higher than expected, which may be due the blood collection via tail snip versus a terminal collection from the heart. Alternatively, elevated hematocrit values could be due to dehydration associated with inspiration gases during scanning, which would have a larger effect on SCD mouse Hct than WT.
CONCLUSION
WT and SCD mice were easily differentiated with a large effect size using MRI alone or in combination with Hct, setting the stage for studies to evaluate treatment effects. Differences between WT and SCD mice were consistent with the hypothesis that CBF is responding to decreased arterial blood oxygenation in SC animals, due a combination of lower Hct and lower saturation, to maintain cerebral oxygen delivery. The methods employed have been back-translated from clinically available methods, so this protocol is a fully translational platform on which to assess potential therapeutics for SCD.Acknowledgements
Pfizer, Inc provided financial support for this study.References
1. Jordan LC, et al., Brain 139:738-750 (2016).
2. Guilliams KP, et al., Blood 131:1012-1021 (2018).
3. Hirschler L, et al., MRM 79:1314-1324 (2018).
4. Ma Y, et al., Front. Neuroanat 2:1-10 (2008).
5. Wei Z, et al., MRM 80:521-528 (2018).
6. http://godzilla.kennedykrieger.org/cgi-bin/bloodT2T1_cal.pl
7. Li W., et al., NMR Biomed 33 (2020).
8. Cahill LS, et al, JCBFM 37:994-1005 (2017).
Figures