1467
Comparison of cerebral oxygen extraction fraction using ASE and TRUST methods in patients with sickle cell disease and healthy controls1Washington University School of Medicine, Saint Louis, MO, United States, 2Johns Hopkins University School of Medicine, Baltimore, MD, United States
Synopsis
We evaluated cerebral oxygen extraction fraction (OEF) in patients with sickle cell disease (SCD) and controls using two MR techniques: asymmetric spin echo (ASE) and T2-relaxation-under-spin-tagging (TRUST). We hypothesized that both methods would yield similar OEF and that TRUST-derived OEF would be elevated in patients with SCD vs. controls as previously found using ASE-derived OEF. ASE-derived and TRUST-derived OEF using the Lu 2012 calibration model showed a positive correlation (rho=0.823, p<0.001). Conversely, ASE-derived vs. TRUST-derived OEF using the Bush 2021 model showed a negative association (rho=-0.569, p<0.001). The directionality of these associations was heavily dependent on the calibration model used.
Introduction
Sickle cell disease (SCD) is a rare blood disorder that affects around 100,000 people in the U.S. It is caused by an autosomal recessive mutation in the β-globin gene that results in the production of an abnormal hemoglobin (hemoglobin S). In the brain, SCD causes disruption in white matter microstructure, silent cerebral infarcts (SCIs), stroke, and cognitive impairment. We have previously measured voxel-wise oxygen extraction fraction (OEF) using an asymmetric spin echo (ASE) method, finding globally and regionally elevated OEF, particularly in watershed regions. Elevated OEF may indicate compromised oxygen delivery and regional vulnerability in patients with SCD1-4. Several other investigators, however, have obtained whole brain OEF by measuring venous oxygen saturation fraction (Yv) within the superior sagittal sinus (SSS) using T2-relaxation-under-spin-tagging (TRUST). The latter method found variable results ranging from low to high OEF in patients with SCD compared to controls 2-4. In this study, we hypothesized: (1) TRUST-derived OEF would be similar to ASE-derived OEF, and (2) TRUST-derived OEF, as a metric of cerebral oxygen metabolic stress, would be elevated in patients with SCD compared to controls as found with the ASE-derived OEF approach.Methods
This study was approved by our IRB and written informed consent was obtained from all participants. Healthy African-American controls and patients with SCD were prospectively enrolled and underwent brain MRI in a 3T PRISMA scanner (Siemens, Erlangen, Germany). MR protocol included 3D T1-weighted MPRAGE, FLAIR, TRUST (TE/TR=3.9/2000ms, TI=1020ms, 3.44x3.44x5mm) and ASE (TE1/TE2/TR=64/99.2/4400ms, 1.72x1.72x3mm) sequences, measuring tissue deoxyhemoglobin, permitting OEF quantification as described previously5-7.SCI lesions on FLAIR were manually outlined using MIPAV software and excluded from the analysis, allowing comparisons within normal appearing white matter (NAWM). T1-weighted images were segmented using statistical parametric mapping software (SPM12, Wellcome Institute of Neurology, London, UK). TRUST images were processed as described previously8,9. T2 in SSS was converted to Yv using two calibration models respectively10,11 and TRUST-derived OEF was calculated as 1-Yv. ASE-derived OEF maps were co-registered to T1-weighted images using FMRIB’s Linear Image Registration Tool (FLIRT) to extract gray and NAWM values. Group comparison was performed using Fisher’s exact test or the non-parametric Wilcoxon rank-sum test and correlations were tested using Spearman’s rho. The threshold for significance was p<0.05.Results
Twenty-nine young adults with SCD (median age = 26 years) and 11 healthy (median age = 29 years) African-American controls were included in this study. Table 1 summarizes participants’ characteristics. There were no differences in the participant age, sex, and race between the two cohorts. Whole brain, NAWM and gray matter ASE-derived OEF were significantly higher in SCD patients compared to healthy controls (Table 2, p ≤ 0.001). TRUST-derived OEF was also higher in SCD vs. controls when using the Lu et al.10 calibration model (Table 2, p = 0.001). However, opposite results were found (OEF lower in SCD) when using the Bush et al.11 model (Table 2, p ≤ 0.001). Spearman correlation showed a strong positive association between whole brain OEF measured with ASE vs. TRUST when using the Lu et al. model (Figure 1A; rho = 0.823, p<0.001). ASE OEF appeared lower than the TRUST OEF in this model (Figure 1A). In contrast, a negative correlation was observed between whole brain ASE-derived OEF and TRUST-derived OEF when using the Bush et al. model (Figure 1B; rho = -0.569, p<0.001).Figure 2 shows cohort comparisons of OEF in SCD patients vs. controls for: (A) ASE, (B) TRUST with the Lu et al. model, and (C) TRUST with the Bush et al. model.Discussion
Individuals with SCD are at increased risk of ischemic stroke due to low arterial oxygen content and inadequate cerebral oxygen delivery. Therefore, imaging methods for quantifying oxygen extraction, as a metric of cerebral oxygen metabolic stress, has been of particular interest as a potential marker to stratify ischemic risk. In this study, we used two MR techniques (ASE and TRUST) to measure OEF in SCD patients and healthy controls. TRUST-derived OEF was strongly correlated with ASE-derived OEF. Moreover, OEF differed between SCD patients and healthy controls when measured using both methods. However, the directionality of these associations and differences, either positive or negative, depended on which calibration model was used. ASE-derived OEF was positively correlated with TRUST-derived OEF using the T2 model calibrated with bovine blood. The bovine model has a disadvantage of non-human and non-SCD blood, however, it was strongly correlated with OEF measured using the gold standard 15O-PET in healthy subjects12. When using the T2 model calibrated using pooled data from individuals with SCD11, TRUST-derived OEF was negatively correlated with ASE-derived OEF. This latter model is strengthened by including SCD patients as well as accounting for the presence of transfused blood; however, a downside is that the precise HbS% effect was not quantified and the model was not derived on healthy controls using the same experimental methods4,13.Conclusion
Our results highlight associations between the voxel-based ASE OEF and SSS TRUST OEF. However, the directionality of these associations between ASE OEF and TRUST OEF, and between SCD vs. controls depends on the R2-oxygenation calibration models used in TRUST. Further work is needed to investigate the effect of HbS on T2 calibration for TRUST-derived OEF.Acknowledgements
No acknowledgement found.References
1. Ford AL, Ragan DK, Fellah S, et al: Silent infarcts in sickle cell disease occur in the border zone region and are associated with low cerebral blood flow. Blood 132:1714-1723, 2018
2. Fields ME, Guilliams KP, Ragan DK, et al: Regional oxygen extraction predicts border zone vulnerability to stroke in sickle cell disease. Neurology 90:e1134-e1142, 2018
3. Bush AM, Coates TD, Wood JC: Diminished cerebral oxygen extraction and metabolic rate in sickle cell disease using T2 relaxation under spin tagging MRI. Magn Reson Med 80:294-303, 2018
4. Jordan LC, Gindville MC, Scott AO, et al: Non-invasive imaging of oxygen extraction fraction in adults with sickle cell anaemia. Brain 139:738-50, 2016
5. An H, Lin W: Impact of intravascular signal on quantitative measures of cerebral oxygen extraction and blood volume under normo- and hypercapnic conditions using an asymmetric spin echo approach. Magn Reson Med 50:708-16, 2003
6. Lee JM, Vo KD, An H, et al: Magnetic resonance cerebral metabolic rate of oxygen utilization in hyperacute stroke patients. Ann Neurol 53:227-32, 2003
7. Eldeniz C, Binkley MM, Fields M, et al: Bulk volume susceptibility difference between deoxyhemoglobin and oxyhemoglobin for HbA and HbS: A comparative study. Magn Reson Med 85:3383-3393, 2021
8. Xu F, Uh J, Liu P, et al: On improving the speed and reliability of T2-relaxation-under-spin-tagging (TRUST) MRI. Magn Reson Med 68:198-204, 2012
9. Lu H, Ge Y: Quantitative evaluation of oxygenation in venous vessels using T2-Relaxation-Under-Spin-Tagging MRI. Magn Reson Med 60:357-63, 2008
10. Lu H, Xu F, Grgac K, et al: Calibration and validation of TRUST MRI for the estimation of cerebral blood oxygenation. Magn Reson Med 67:42-9, 2012
11. Bush A, Vu C, Choi S, et al: Calibration of T2 oximetry MRI for subjects with sickle cell disease. Magn Reson Med 86:1019-1028, 2021
12. Jiang D, Deng S, Franklin CG, et al: Validation of T2 -based oxygen extraction fraction measurement with (15) O positron emission tomography. Magn Reson Med 85:290-297, 2021
13. Watchmaker JM, Juttukonda MR, Davis LT, et al: Hemodynamic mechanisms underlying elevated oxygen extraction fraction (OEF) in moyamoya and sickle cell anemia patients. J Cereb Blood Flow Metab 38:1618-1630, 2018
Figures
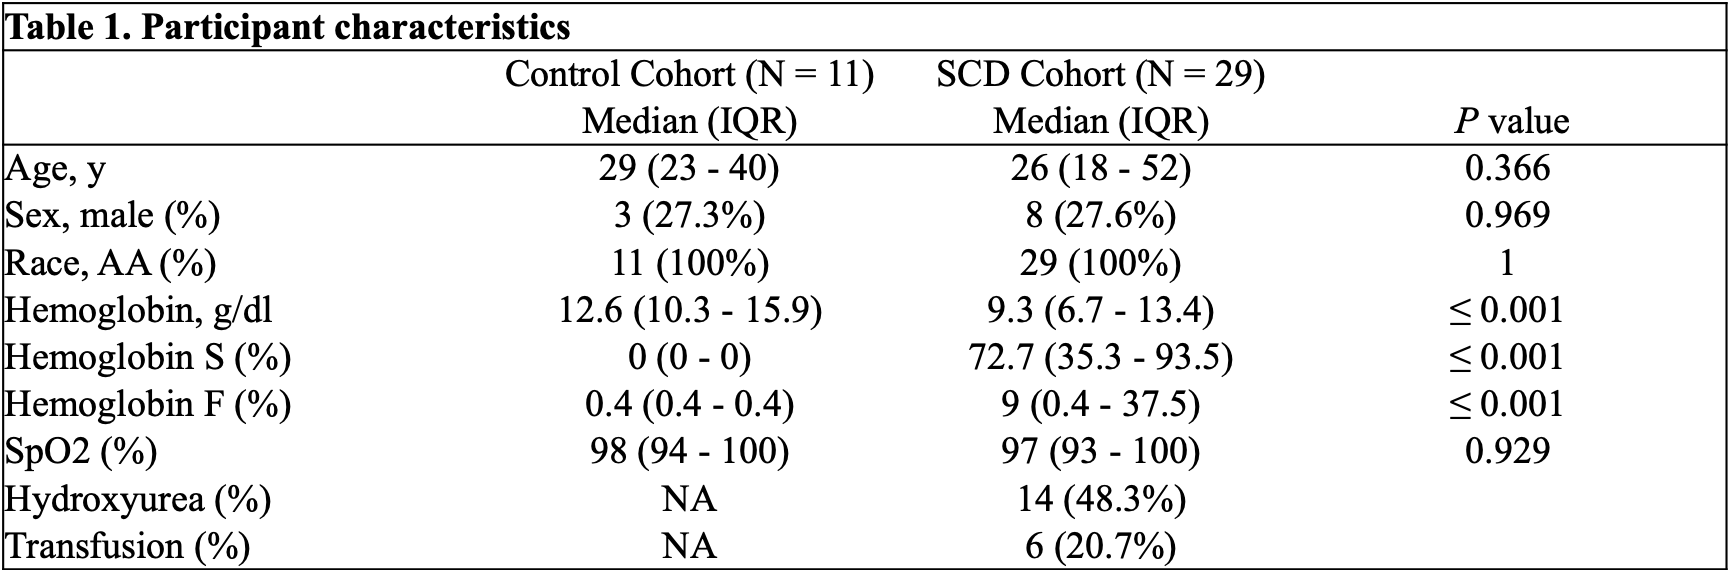
Table 1: Participant characteristics.
Abbreviations: AA, African-American; SCD, sickle cell disease; SpO2, peripheral oxygen saturation.
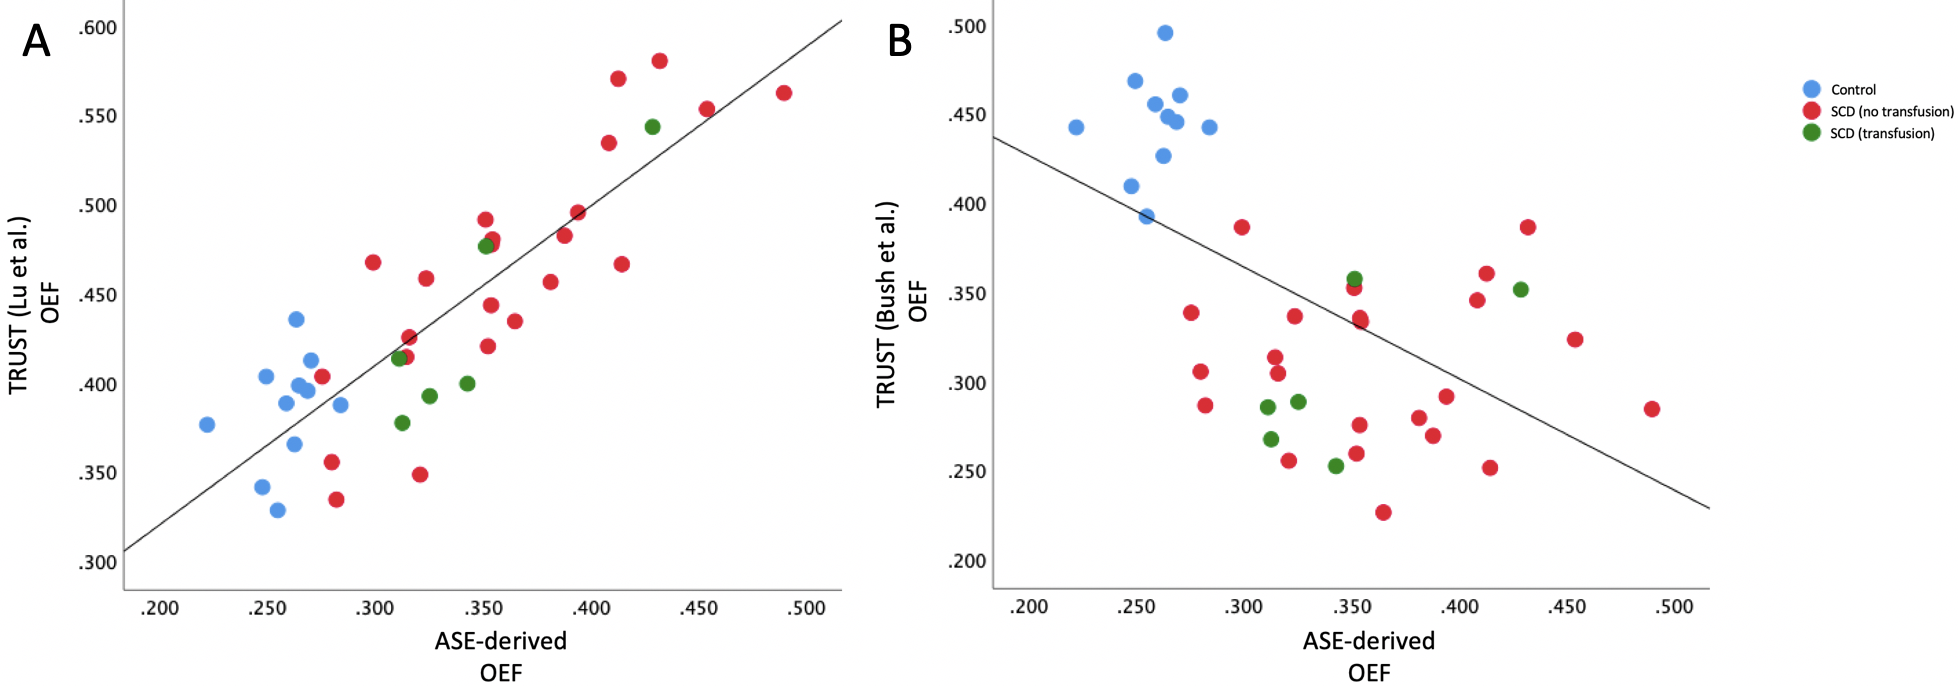
Figure 1: Scatter plots showing associations between ASE-derived and TRUST-derived oxygen extraction fraction using 2 calibration models.
Figure 1A: Positive correlation between ASE-derived and TRUST-derived (Lu et al. 2012 model) oxygen extraction fraction (rho = 0.823, p<0.001).
Figure 1B: Negative correlation between ASE-derived and TRUST-derived (Bush et al. 2021 model) oxygen extraction fraction (rho = -0.569, p<0.001). Non-transfused and transfused SCD subjects are shown in red and green, respectively, while healthy controls are represented in blue.
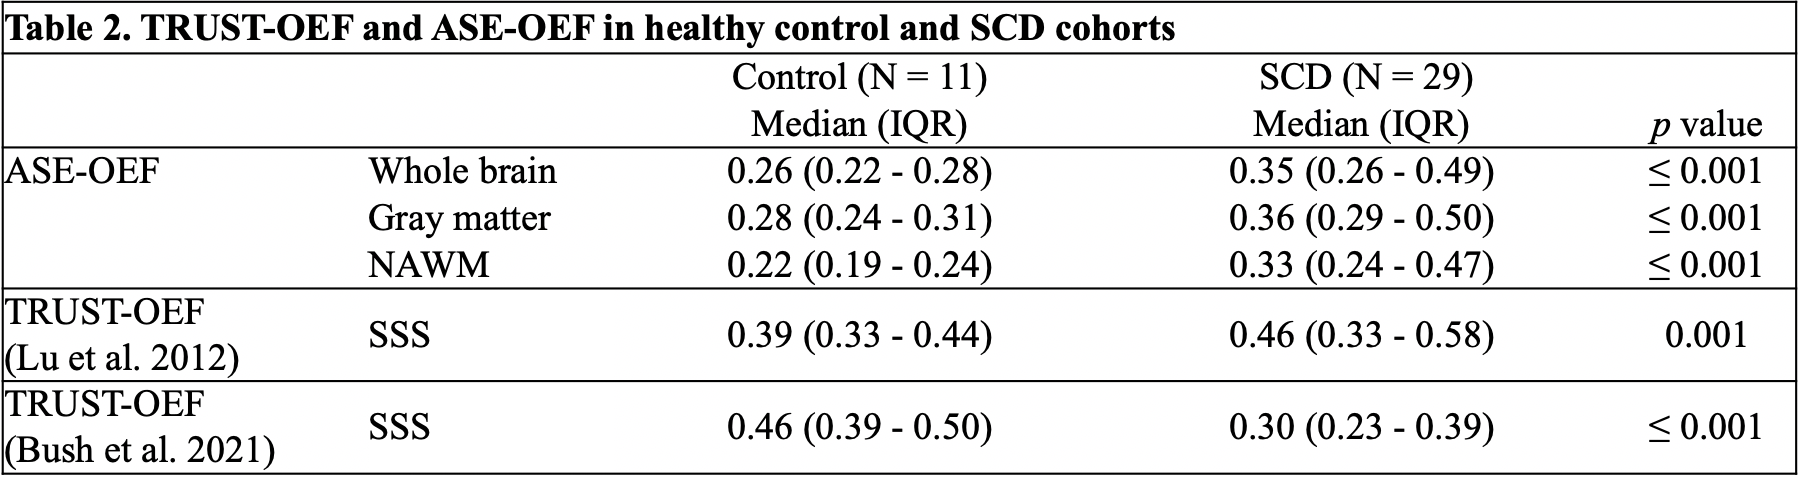
Table 2: TRUST-OEF and ASE-OEF in healthy control and SCD cohorts.
Abbreviations: ASE, asymmetric spin echo; TRUST, T2-relaxation-under-spin-tagging; NAWM, normal appearing white matter; OEF, oxygen extraction fraction; SSS, superior sagittal sinus.
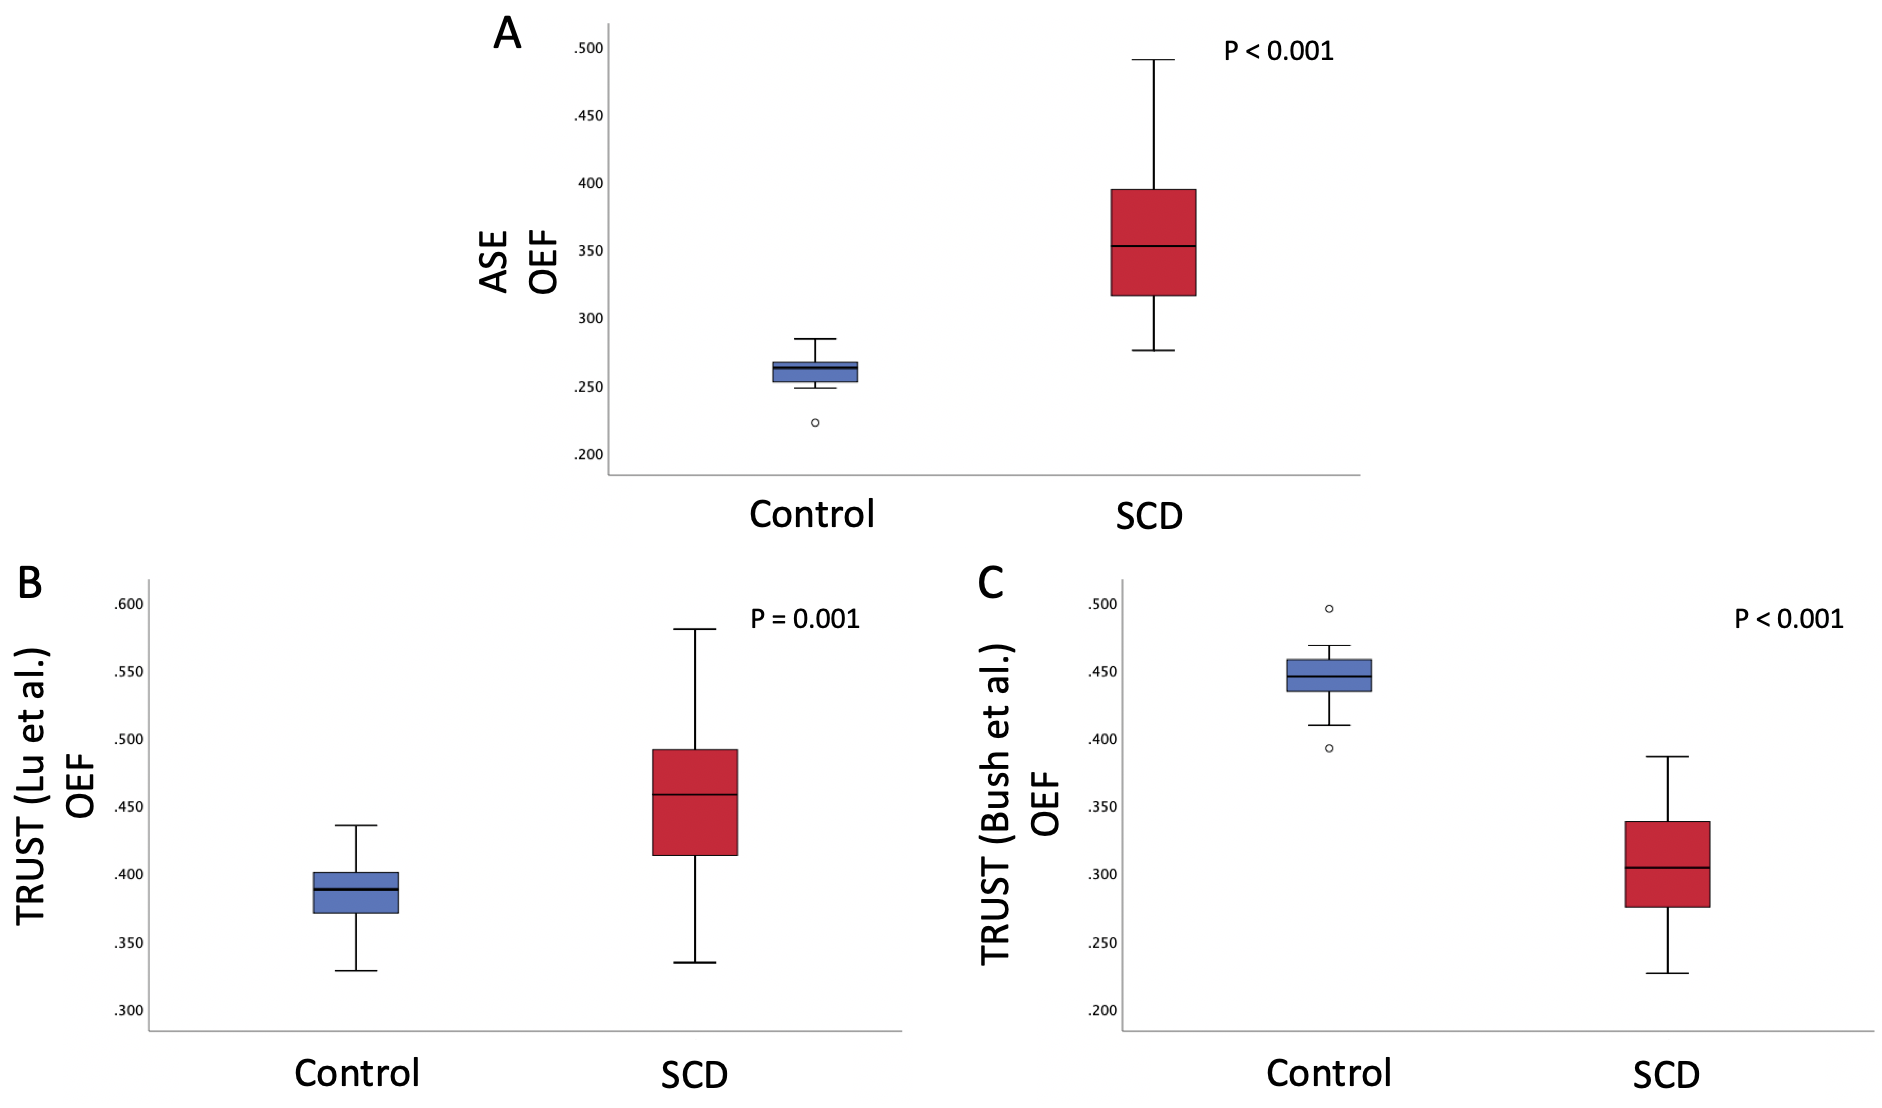
Figure 2: Boxplots showing pairwise comparisons of OEF measured with both ASE and TRUST methods in SCD and control subjects.
TRUST data were generated using 2 models: model1 by Lu et al. 2012; model2 by Bush et al. 2021.
Abbreviations: ASE, asymmetric spin echo; TRUST, T2-relaxation-under-spin-tagging; OEF, oxygen extraction fraction; SCD, sickle cell disease.