1466
Assessing Drug Effect on the Velocity Pulsatility in the Perforating Arteries of the Basal Ganglia at 3T-MRI in Pseudoxanthoma Elasticum1Radiology, UMC Utrecht, Utrecht, Netherlands, 2Neurology and Neurosurgery, UMC Utrecht, Utrecht, Netherlands, 3Vascular Medicine, UMC Utrecht, Utrecht, Netherlands
Synopsis
This feasibility study aimed to detect drug effects on perforating artery velocity as measured with two-dimensional phase-contrast (2D-PC) velocity measurements at 3T-MRI. Seventeen patients with pseudoxanthoma elasticum were included into a treatment group who received etidronate (n=9) and into a placebo group (n=8). No significant differences were found between both groups at baseline and one-year follow-up. In the etidronate group, mean velocity (Vmean) was significantly higher at follow-up (5.61 [4.77–6.45] cm/s) compared to baseline (4.80 [4.05–5.54] cm/s). In the placebo group, Vmean did not increase significantly. Measuring drug effects was feasible using 2D-PC measurements at 3T-MRI.
Introduction
Pseudoxanthoma elasticum (PXE) is a rare disorder that results in severe calcifications in the skin, eyes and along the internal elastic lamina of the major arteries of the body1. PXE is associated with increased arterial stiffness, peripheral arterial disease, stroke and cerebral small vessel disease (SVD)2–4. Recently published results of the Treatment of Ectopic Mineralization in Pseudoxanthoma elasticum (TEMP) trial showed that systemic arterial calcification was halted in PXE patients who received one-year etidronate, a bisphosphonate, treatment compared to placebo2. Arterial calcification can lead to increased blood flow pulsatility which has been associated to increased SVD-related brain damage5,6. Previously we have shown that blood flow velocity can be investigated in the small cerebral arteries in SVD using a 7T-MRI two-dimensional phase contrast (2D-PC) method7,8. Recently we translated this method to 3T-MRI for the potential of more widespread application9. In this proof-of-concept study, we assess whether our 3T method is sufficiently sensitive to detect potential effects of drugs that are expected to affect small vessel function.Methods
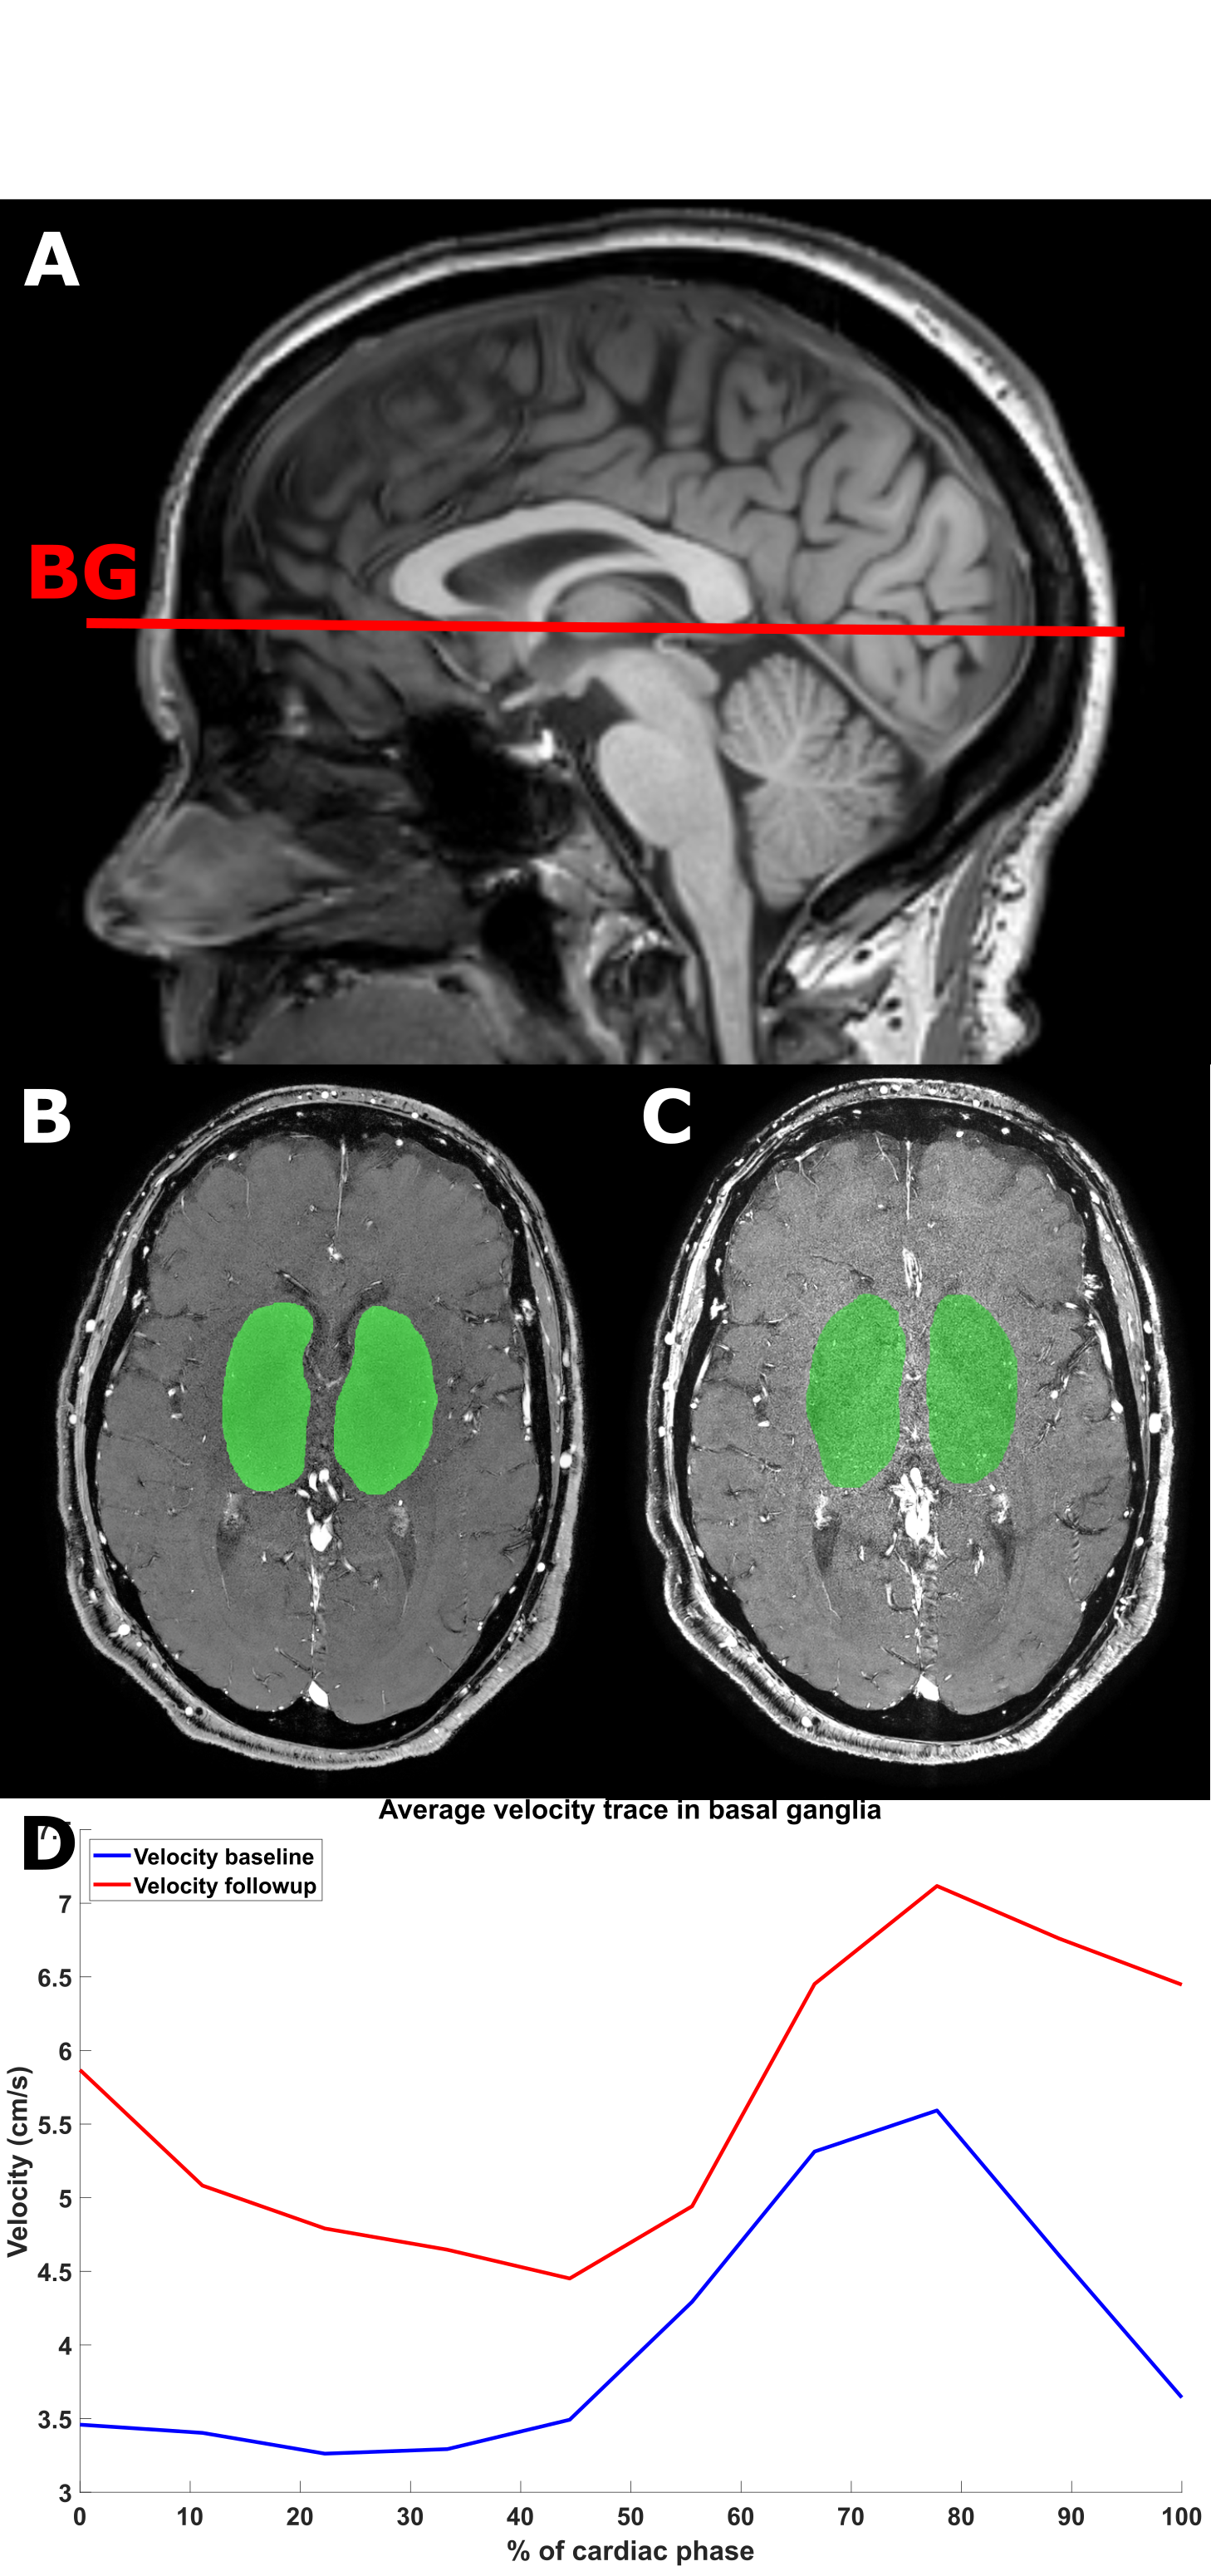
MRI data were obtained from subjects who participated in the TEMP trial, and received a 3T-MRI with a 32-channel head coil (Philips Healthcare, Best, The Netherlands). The acquisitions included a previously published 2D-PC acquisition with retrospective cardiac gating. The 2D-PC acquisition was planned on a 3D anatomic (T1) acquisition at the level of the basal ganglia (BG), shown in Figure 1. The following imaging parameters were used: 250x250 mm2 field of view; acquired spatial resolution 0.3x0.3x2 mm3; reconstructed resolution 0.2x0.2x2 mm3; TR/TE: 28.2/14.5 ms; flip angle: 50°; acquired temporal resolution: 169 ms; reconstructed heart phases: 8-10; and velocity encoding 20 cm/s; SENSE factor 1.5. Scan duration was about 3 minutes for a heart rate of 60 beats per minute.The 2D-PC images were analyzed as described previously9, but the algorithm has been re-implemented in a Python based tool (SELMA) to improve the user friendliness, warrant the correct implementation of the algorithm, and to extend its applicability to DICOM data from different MRI vendors. A region of interest (ROI) needed to be drawn in the BG to initiate the analysis (Figure 1). SELMA was used to assess the number of detected perforating arteries (Ndetected), the mean velocity (Vmean) and the velocity pulsatility index (vPI) with respective 95% confidence intervals (CI). The vPI was obtained from the mean (over all vessels) normalized blood flow velocity curve, using the following formula: $$vPI = \frac{V_{max} - V_{min}}{V_{mean}}$$ where Vmax, Vmin, and Vmean, are the maximum, minimum and mean over the cardiac cycle, respectively (Vmean equals 1.0 due to normalization).
Results
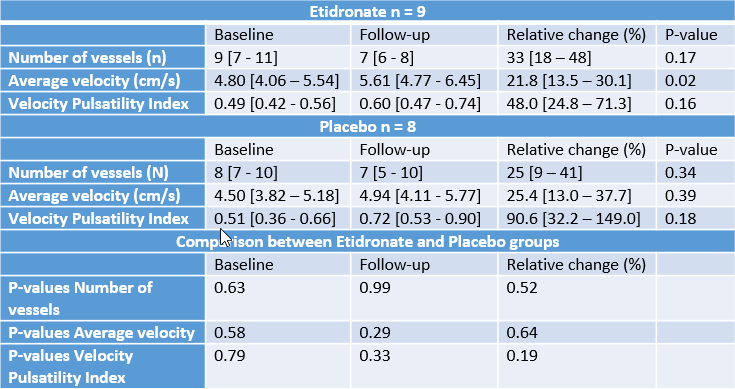
In the etidronate and placebo group, 9 and 8 subjects respectively had a successful 2D-PC acquisition at baseline and follow-up. No significant differences were found between the etidronate and placebo group for Ndetected, Vmean, vPI and their respective relative changes at baseline and follow-up (Table 1). When comparing the baseline with the follow-up scans within groups, no significant difference in Ndetected was found between the baseline and follow-up scans in either the etidronate (baseline: 9 [7 - 11]; follow-up 7 [6 - 8], p=0.17), or placebo group (baseline: 8 [7 - 10]; follow-up: 7 [5 - 10], p=0.34). Vmean was significantly higher in the follow-up scan for the etidronate group (4.80 [4.05 – 5.54] vs. 5.61 [4.77 - 6.45] cm/s, p=0.02), but not different in the placebo group (4.50 [4.56 - 6.11] vs. 4.94 [4.11 - 5.77] cm/s, p=0.39). No difference in vPI was found between the baseline and follow-up scans in either the etidronate (baseline: 0.48 [0.42 – 0.56]; follow-up: 0.60 [0.47 – 0.74], p=0.16), or placebo group (baseline: 0.51 [0.36 – 0.66]; follow-up: 0.72 [0.53 – 0.90], p = 0.18) (Figure 2).Discussion
This post-hoc analysis showed a first proof of concept that 2D-PC velocity measurements are capable of assessing the effect of drugs at the level of the perforating arteries in the BG on 3T-MRI. Our technique was able to detect significant differences in small vessel function in a relatively small subject group. Analysis on the PXE data with the SELMA tool showed a decrease in Ndetected and an increased Vmean and vPI after follow-up in both patient groups. Only the increase in Vmean in the etidronate group was statistically significant (p = 0.02). The differences we measured in small vessel function were most likely largely determined by upstream effects of the systemic calcification changes induced by etidronate in the carotid siphon and common carotid artery that were reported earlier10. The ability to measure these differences between groups shows the potential to use 3T-MRI measurements of perforating artery condition in cerebrovascular disease.Conclusion
In this post-hoc analysis we showed that drug effects in the small perforating arteries at the level of the BG can be measured on 3T-MRI. PXE patients who received etidronate had a significantly higher mean blood flow velocity after one-year follow-up compared to those who received a placebo. These findings suggest that small vessel function was altered after one-year follow-up in PXE patients. Future research should focus on the direct relation between PXE and small vessel function and include larger cohorts.Acknowledgements
We thank all participants of the TEMP trial for participating in the
study and acknowledge funding from the European Research Council (FP/2007-2013,
grant no. 841865).
References
1. Plomp AS, Toonstra J, Bergen AAB, et al. Proposal for updating the pseudoxanthoma elasticum classification system and a review of the clinical findings. Am J Med Genet Part A. 2010;152(4):1049-1058.
2. Kauw F, Kranenburg G, Kappelle LJ, et al. Cerebral disease in a nationwide Dutch pseudoxanthoma elasticum cohort with a systematic review of the literature. J Neurol Sci. 2017;373:167-172.
3. Kranenburg G, Visseren FLJ, de Borst GJ, et al. Arterial stiffening and thickening in patients with pseudoxanthoma elasticum. Atherosclerosis. 2018;270(February):160-165.
4. Leftheriotis G, Kauffenstein G, Hamel JF, et al. The Contribution of Arterial Calcification to Peripheral Arterial Disease in Pseudoxanthoma Elasticum. PLoS One. 2014;9(5):e96003.
5. Geijselaers SLC, Sep SJS, Schram MT, et al. Carotid stiffness is associated with impairment of cognitive performance in individuals with and without type 2 diabetes. The Maastricht Study. Atherosclerosis. 2016;253:186-193.
6. Tap L, van Opbroek A, Niessen WJ, et al. Aortic stiffness and brain integrity in elderly patients with cognitive and functional complaints. Clin Interv Aging. 2018;13:2161-2167.
7. Bouvy WH, Geurts LJ, Kuijf HJ, et al. Assessment of blood flow velocity and pulsatility in cerebral perforating arteries with 7-T quantitative flow MRI. NMR Biomed. 2016;29(9):1295-1304.
8. Geurts L, Biessels GJ, Luijten P, et al. Better and faster velocity pulsatility assessment in cerebral white matter perforating arteries with 7T quantitative flow MRI through improved slice profile, acquisition scheme, and postprocessing. Magn Reson Med. 2018;79(3):1473-1482.
9. Arts T, Meijs TA, Grotenhuis H, et al. Velocity and Pulsatility Measures in the Perforating Arteries of the Basal Ganglia at 3T MRI in Reference to 7T MRI. Front Neurosci. 2021;15:480.
10. Bartstra JW, de Jong PA, Kranenburg G, et al. Etidronate halts systemic arterial calcification in pseudoxanthoma elasticum. Atherosclerosis. 2020;292:37-41.
Figures