1463
B1 shimming for cervical spine 7T parallel transmission MRI: preliminary in vivo imaging and preparation of virtual observation points1Aix-Marseille Université, CNRS, CRMBM, Marseille, France, 2AP-HM, Hôpital de la Timone, Pôle d'imagerie médicale, CEMEREM, Marseille, France, 3iLab-Spine - Laboratoire international associé - Imagerie et Biomécanique du rachis, Canada/, France, 4Aix Marseille Univ, CNRS, Centrale Marseille, Institut Fresnel, Marseille, France, 5RAPID Biomedical GmbH, Rimpar, Germany
Synopsis
Parallel transmission for 7T MRI of the spinal cord is a promising area of research, as high specific absorption rate and coil inefficiency in some levels may limit certain applications. In the absence of virtual observation points (VOP) provided by the coil manufacturer, preliminary testing and first in vivo applications on a healthy volunteer were done in a conservative SAR-restricted, showing potential in regions that suffered from signal drops with the default shim parameters. The workflow to ensure radiofrequency safety with virtual observation points, based on simulations of the specific absorption rate and their validation, is also described.
Introduction
Spinal cord MRI at 7T is unfortunately not yet as developed as in the brain, mostly due to intrinsic challenges (size/shape, surrounding structures, physiological motions) and a currently limited number of radiofrequency (RF) coils1. However, the demonstration of clinical opportunities2–4, protocols that are compatible with clinical scan time and constraints5,6, and the growing number of pathologically relevant MR biomarkers continuously show the potential of spinal cord 7T MRI1,7–11. Current limitations include elevated specific absorption rate (SAR), which limits the number of slices, flip angle (FA) or resolution and B1 inhomogeneity along the cord, which leads to lower signal-to-noise ratio (SNR) and requires B1 bias correction for some sequences. These issues have been mitigated in organs such as the brain using parallel transmit (pTx) techniques12, but have not yet been performed for the cord.In this work, preliminary in vivo results based on B1 shimming are shown using a multi-echo gradient echo (MGE) sequence. The process of ensuring proper monitoring of the 10g-averaged SAR (SAR10g), with estimation of a safety factor to account for different sources of errors13, is also presented in the perspectives of using state-of-the-art pTx methods.
Methods
In the absence of virtual observation points (VOP)14 provided by the coil manufacturer, preliminary testing and first in vivo applications on a healthy volunteer were done in a conservative SAR-restricted mode, by assuming that the entirety of the input power would go in a single cube containing 10g of tissue. B1-shimming was performed on B1-map and MGE sequences, on a 7T Siemens TERRA (Siemens Healthcare, Erlangen, Germany), with a Rapid 8Tx/8Rx cervical spine pTx coil8, with parameters shown in Fig.1&2, respectively. The sequences were repeated at different cervical levels (C1, C3 and C7), as well as the pons, with the default shim and after B1 shimming using the manufacturer optimization.To prepare the future use of state-of-the-art pTx, the SAR10g was calculated based on electromagnetic simulations of the RF field in realistic human models, as required to use VOPs. The effect of different sources of errors was evaluated using Sim4Life (ZMT, Switzerland), to ensure RF safety:
- Intersubject variability15: Simulations on the Duke and Ella human models16, as well as Duke after modifying the tissue properties by ± 10% to account for variations of the SAR10g in the population17.
- Scanner hardware: Scanner manufacturer, errors of ± 12% of input power and ± 5° of phase need to be accounted for.
- Inaccuracies from simulations were evaluated by comparing measured and simulated fields:
- Errors in the B1-field were evaluated in the SAM phantom (SAM V4.5BS, Speag, Switzerland) using B1-mapping18 with different shims.
- Errors in the E-field were evaluated in a custom phantom by sequentially measuring the E-field of each channel with a commercial SAR probe (details in Fig.5).
Results
Fig.1 shows anatomical images and B1-maps along the cord (Fig.1A) and in an axial slice going through the pons (Fig.1B), before and after shimming different regions-of-interest (ROI). Fig.1C presents boxplots of the FA achieved in different ROI, and the associated SAR10g. Unfortunately, the shimming-box provided by the manufacturer could not be reduced to only include the spinal cord levels, and had a minimal size of 90x90x90 mm3.Fig.2 shows MGE images with different B1 shims, with the best improvement of 9% for C7 (which typically has ~30% lower efficiency compared with C3 with the standard shim) and in the brain around the pons (+470%).
Fig.3A presents a table of safety factor required to prevent underestimation when a ‘predictor’ model is used to limit the SAR10g in a ‘predicted’ model. The best compromise between preventing underestimation and overestimation was achieved when a combination of Ella and Duke with modified tissue properties (ρ -10%, εr -10%, σ +10%) was used as a VOP (an example is shown in Fig.3B). Although not shown, a similar process was used to evaluate the effect of scanner error, resulting in errors of up to 20%.
Fig.4&5 show comparisons between simulated and measured B1 and E-field, respectively, and show good agreement (mean error < 32%, average of mean errors = 7%). Errors in the B1-field were mostly located near the surface and may be due to inaccuracies of the B1-mapping sequence for large FA. The largest E-field errors were measured for channel 1 and are likely due to the proximity of capacitors in this region.
Discussion and Conclusion
In this work, results show that the B1 shimming tools provided by the manufacturer are not always reliable when applied to the cord, partly due to its small size compared with the minimum available shimming volume. Increase of the SAR10g was observed, and with a strong trade-off between uniformity (inside the ROI) and field strength. Promising results were nonetheless achieved, specifically in the C7 and pons regions, where the default shim typically has insufficient efficiency.The full process of generating VOPs for the used coil was presented. The combination of multiple human models and additional safety factors to account for errors will be used in the future to exploit the full capability of pTx techniques with accurate SAR10g estimation. This will enable the implementation of advanced pTx techniques19 emphasizing SAR-reduction and/or B1 strength.
Acknowledgements
We acknowledge ZMT (Zurich MedTech, Switzerland) for providing the free academic license of the software Sim4Life. This project has received funding from A*MIDEX and from Carnot STAR Institut.References
1. Barry RL, Vannesjo SJ, By S, Gore JC, Smith SA. Spinal cord MRI at 7T. NeuroImage. 2018;168(July):437-451. doi:10.1016/j.neuroimage.2017.07.003 SMASH
2. Ouellette R, Treaba CA, Granberg T, et al. 7 T imaging reveals a gradient in spinal cord lesion distribution in multiple sclerosis. Brain. 2020;143(10):2973-2987. doi:10.1093/brain/awaa249 SMASH
3. Dula AN, Pawate S, Dortch RD, et al. Magnetic resonance imaging of the cervical spinal cord in multiple sclerosis at 7T. Multiple Sclerosis. 2016;22(3):320-328. doi:10.1177/1352458515591070 SMASH
4. Callot V, Massire A, Guye M, Attarian S, Verschueren A. Visualization of Gray Matter Atrophy and Anterior Corticospinal Tract Signal Hyperintensity in Amyotrophic Lateral Sclerosis Using 7T MRI. Neurology. 2021;96(23):1094. doi:10.1212/WNL.0000000000012072 SMASH
5. Frebourg G, Massire A, Pini L, et al. The good, the bad and the ugly : a retrospective study of image quality in human cervical spinal cord MRI at 7T. In: Proceedings of the Annual Meeting of ISMRM. ; 2021.
6. Massire A, Demortière S, Lehmann P, et al. High-resolution multiparametric quantitative MRI of the cervical spinal cord at 7T: preliminary results at the early stage of multiple sclerosis. In: Proceedings of the Annual Meeting of ISMRM. ; 2019.
7. Massire A, Rasoanandrianina H, Guye M, Callot V. Anterior fissure, central canal, posterior septum and more: New insights into the cervical spinal cord gray and white matter regional organization using T1 mapping at 7T. NeuroImage. 2020;205:116275. doi:10.1016/j.neuroimage.2019.116275 SMASH
8. Massire A, Taso M, Besson P, Guye M, Ranjeva JPP, Callot V. High-resolution multi-parametric quantitative magnetic resonance imaging of the human cervical spinal cord at 7T. NeuroImage. Published online 2016. doi:10.1016/j.neuroimage.2016.08.055 SMASH
9. Dula AN, Pawate S, Dethrage LM, et al. Chemical exchange saturation transfer of the cervical spinal cord at 7 T: Cest of the Cervical Spinal Cord AT 7 T. NMR Biomed. 2016;29(9):1249-1257. doi:10.1002/nbm.3581 SMASH
10. Seifert AC, Kong Y, Miller KL, Tracey I, Vannesjo SJ. Finger-Tapping Task fMRI in the Human Cervical Spinal Cord at 7T. In: Proceedings of the Annual Meeting of ISMRM. ; 2019.
11. Galley J, Sutter R, Germann C, Wanivenhaus F, Nanz D. High-resolution in vivo MR imaging of intraspinal cervical nerve rootlets at 3 and 7 Tesla. Eur Radiol. Published online January 6, 2021. doi:10.1007/s00330-020-07557-3 SMASH
12. Padormo F, Beqiri A, Hajnal JV, Malik SJ. Parallel transmission for ultrahigh-field imaging. Nmr in Biomedicine. 2016;29(9):1145-1161. doi:10.1002/nbm.3313 SMASH
13. Fiedler TM, Ladd ME, Bitz AK. SAR Simulations & Safety. Neuroimage. Published online 2017. doi:10.1016/j.neuroimage.2017.03.035 SMASH
14. Eichfelder G, Gebhardt M. Local Specific Absorption Rate Control for Parallel Transmission by Virtual Observation Points. Magnetic Resonance in Medicine. 2011;66(5):1468-1476. doi:10.1002/mrm.22927 SMASH
15. Meliado EF, den Berg CAT, Luijten PR, Raaijmakers AJE. Intersubject specific absorption rate variability analysis through construction of 23 realistic body models for prostate imaging at 7T. Magnetic Resonance in Medicine. 2019;81(3):2106-2119. doi:10.1002/mrm.27518 SMASH
16. Gosselin MC, Neufeld E, Moser H, et al. Development of a new generation of high-resolution anatomical models for medical device evaluation: the Virtual Population 3.0. Physics in Medicine and Biology. 2014;59(18):5287-5303. doi:10.1088/0031-9155/59/18/5287 SMASH
17. Le Garrec M, Gras V, Hang MF, Ferrand G, Luong M, Boulant N. Probabilistic analysis of the specific absorption rate intersubject variability safety factor in parallel transmission MRI. Magnetic Resonance in Medicine. 2017;78(3):1217-1223. doi:10.1002/mrm.26468 SMASH
18. Chung S, Kim D, Breton E, Axel L. Rapid B1+ mapping using a preconditioning RF pulse with TurboFLASH readout. Magn Reson Med. 2010;64(2):439-446. doi:10.1002/mrm.22423 SMASH
19. Cloos MA, Boulant N, Luong M, et al. kT -points: short three-dimensional tailored RF pulses for flip-angle homogenization over an extended volume. Magn Reson Med. 2012;67(1):72-80. doi:10.1002/mrm.22978 SMASH
Figures
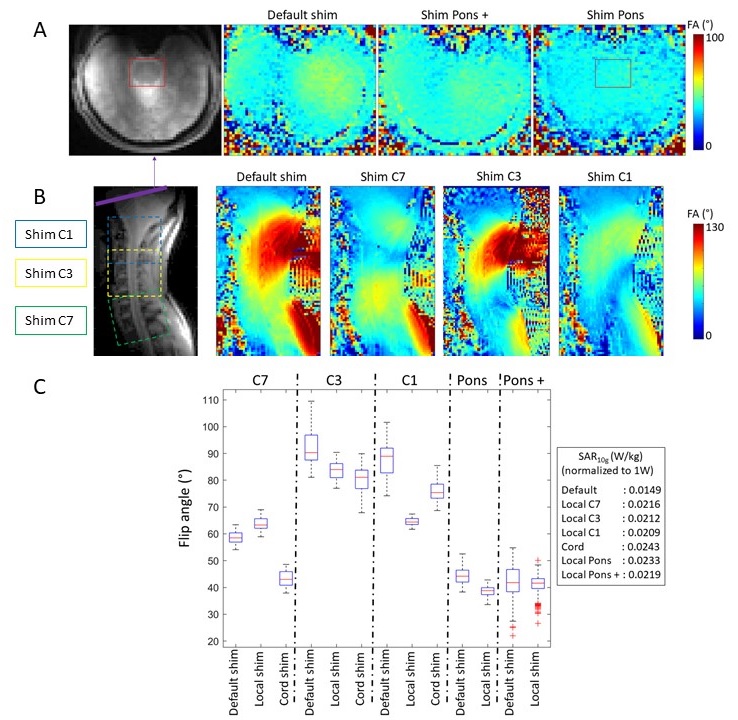
Figure 1: Anatomical and B1 maps (shown as FA maps) in (A) axial and (B) sagittal slice showing the pons+brain and cervical cord, with different B1 shims. B1 map parameters: single slice, tfl-based sequence, TE/TR = 1.99/5500 ms; FA = 3°; saturation angle = 90°, resolution = 3×3×6 mm3; (C) Boxplot of the FA achieved with the different B1 shims at the different locations. FA measurements were performed within a ROI including the spinal cord only (for C7, C3 and C1), the pons for ‘Pons’, or the pons+brain for ‘Pons +’. The SAR10g normalized to 1W of input power of each B1 shim is shown on the right.
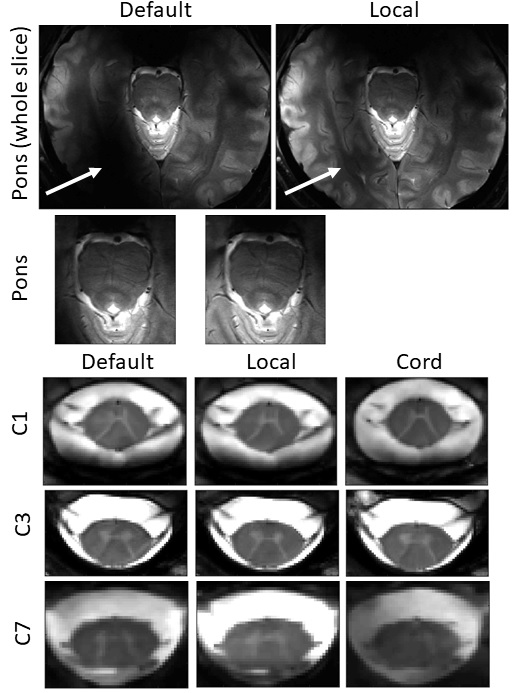
Figure 2: MGE images of a healthy volunteer (male, 31yo, 81 kg) at different slice locations (only one slice was acquired per serie, due to the SAR restricted mode). The sequence parameters were: single axial slice, 3 echoes: TE/TR = [5.5 9.4 13.4]/560 ms; FA = 50°; resolution = 0.4×0.4×2.5 mm3. Images acquired with the default shim were compared with images after B1 shimming localized on each region of interest (‘local’) and after B1 shimming along the cord from C1 to C7 (‘cord’). The white arrows show a region where a substantial amount of signal (470%) was recovered after shimming.
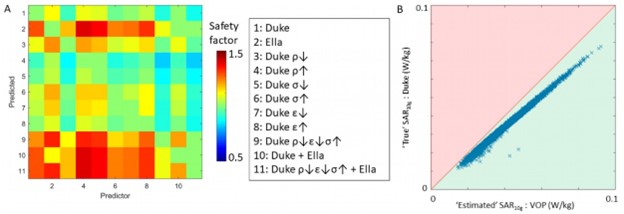
Figure 3: (A) Table showing the safety factor required to prevent underestimation of the SAR10g for 99.9% of 10000 random shims. Different models were used to predict the SAR10g in other models, including modifications of Duke with varied properties (density ρ, electric conductivity σ and permeability εr) by ± 10%; (B) Example of the SAR10g generated by 10000 shims when a VOP (combination of Ella and Duke ρ↓ε↓σ↑ (#11)) is used to predict the SAR10g in the Duke model. At least 99.9% of SAR10g predictions fall into the ‘overestimation zone’ (green area), to enforce RF safety.
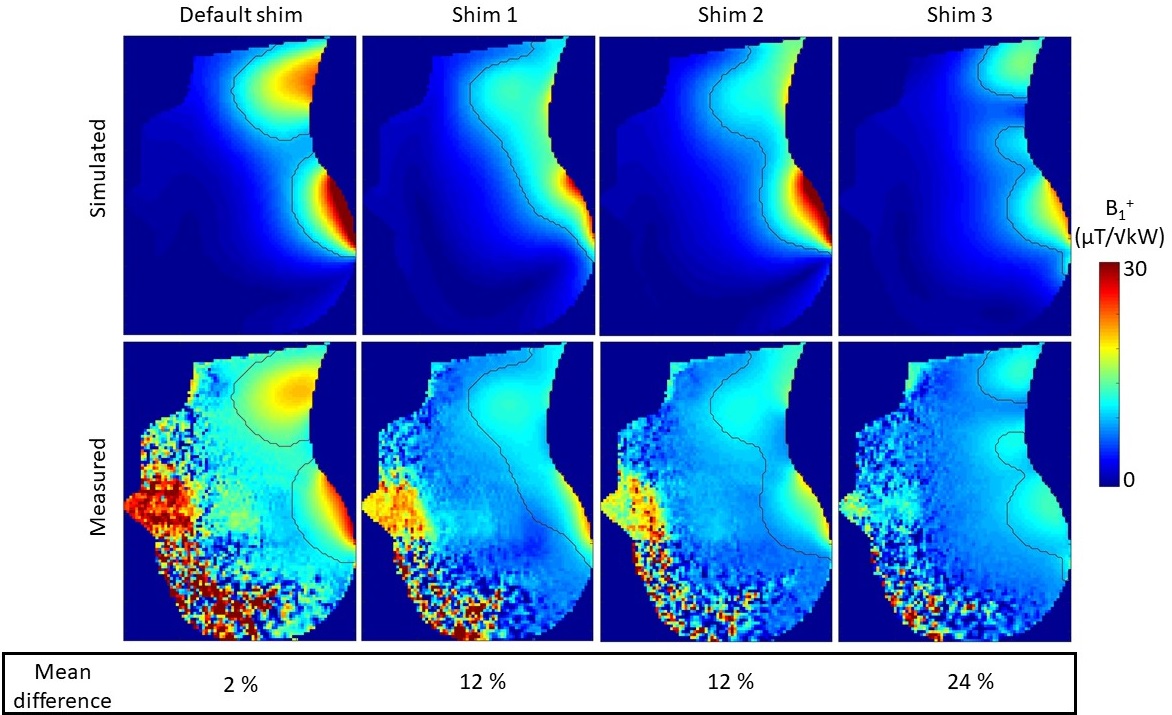
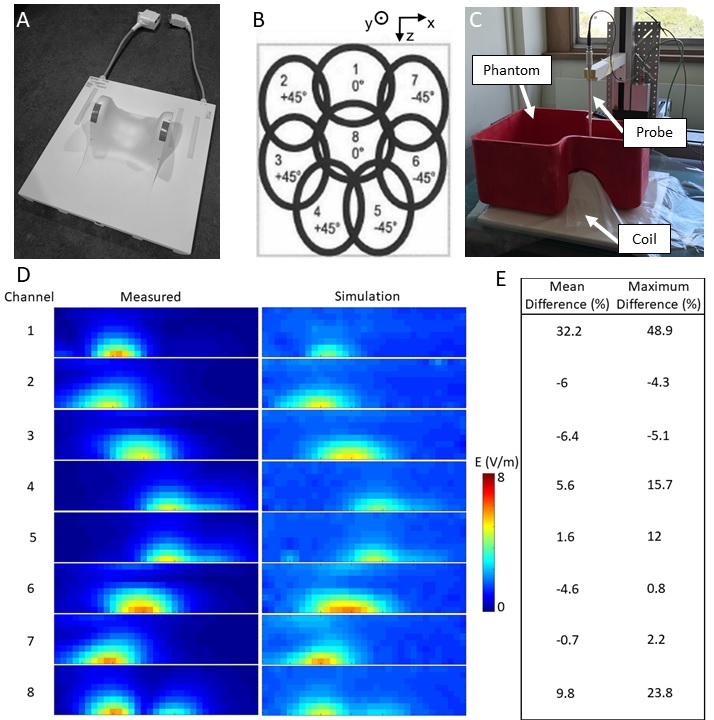
Figure 5: (A) pTx cervical spine coil and (B) illustration showing the default shim; (C) E-field measurement set-up: the SAR probe (MVG, France) was attached to a 3-axis machine to sample the field with 10 mm steps in a sagittal slice going through the center of the phantom (3D-printed and filled with a solution (MVG, France; εr = 43.5; σ = 0.87 S/m)). Input power = 13 dBm; inactive channels terminated with 50 Ohm; (D) Comparison of measured and simulated E-field (estimated loss = 0.8 dBm to account for cable losses). (E) Mean and maximum difference, averaged over regions >2 V/m (noise floor).